Abstract
We report preliminary results of a RossiXTE campaign on the 2002 outburst of the black-hole candidate GX 339–4. We show power density spectra of five observations during the early phase of the outburst. The first four power spectra show a smooth transition between a Low State and a Very High State. The fifth power spectrum resembles a High State, but a strong 6 Hz QPO appears suddenly within 16 seconds.
1 GX 339–4 as a transient: our campaign
After almost three years of quiescence, the “persistent” BHC GX 339–4 became active again on 2002 March 26 [1]. This source is important , as in the past it has shown in the past all of the “canonical” states of BHCs [2].
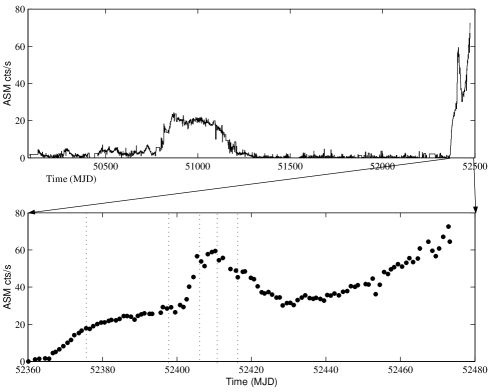
The full RossiXTE/ASM light curve from the start of the mission is shown in Fig. 1. We started our observations with RossiXTE on April 3rd and obtained roughly one pointing per week since then. The ASM rate (1.5-1 keV) increased to 0.8 Crab in less than two months, then decreased to 0.5 Crab in three weeks, to start rising again to 1 Crab, and at the time of writing it is still brightening (see Fig. 1).
We present here preliminary results of the timing analysis of a subset of PCA observations: four during the early phase of the outburst, when the source count rate was increasing monotonically with time, and one a few days into the decay. The times of the five observations considered here are marked with dotted lines in the bottom panel of Fig. 1.

2 Timing analysis of the early phase
For each of the first four observations, we produced a Power Density Spectrum (PDS) by selecting the energy range 3-15 keV, dividing the observation in shorter segments and averaging the corresponding PDS. The resulting PDS can be seen in Figure 2. A strong evolution with time is evident. The PDS of the first observation, on the initial rise of the outburst, is very similar to the typical Low-State PDS observed before with RTXE (e.g. [3, 4]). A weak QPO is seen at 0.25 Hz. During the second observation, on the flattening part of the initial rise, the PDS is similar, but shifted to higher frequencies (the QPO is now around 0.2 Hz). The third observation was made just before a sharp brightening. The characteristic frequencies are even higher, with two harmonically-related QPOs at 0.6 and 1.2 Hz. At a much higher count rate, the fourth PDS shows even higher frequencies, with a 6 Hz QPO with complex harmonic content. This PDS is almost indistinguishable from the VHS examples in [5]. At the same time, the X-ray colors measured with the PCA show that the first three observations follow a softening curve, while the fourth is much softer.
It is remarkable that we are observing here a smooth transition in the timing properties from LS to VHS, with no discontinuity seen, while the energy spectral parameters change abruptly.
3 A transient QPO!
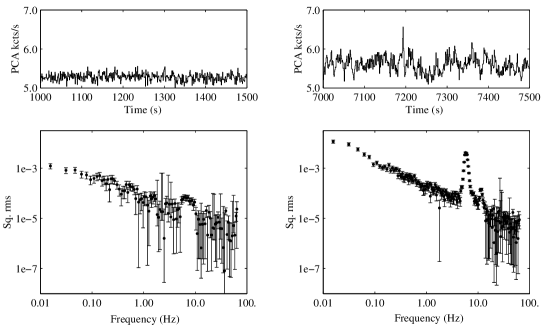
Our fifth observation, on 2002 May 17, shortly after the ASM flux started to decrease, is different. In the first RXTE orbit, the 1s binned light curve does not show much variability and the PDS shows a power-law noise component with a weak and broad bump between 6 and 10 Hz (Left panel in Fig. 3). In the second RXTE orbit, the power-law noise is stronger, as can be seen from the light curve directly, and a very strong QPO at 6 Hz appears in the PDS. A detailed analysis of a dynamical power density spectrum shows that this QPO is not present during the first 150 seconds of the orbit, then appears suddenly within a time scale shorter than 16 seconds.
4 A long-awaited outburst
Our preliminary results show that the timing properties of the source move gradually from the LS to the VHS, despite sudden changes in spectral shape. When at high flux, the source entered a HS, with reduced timing variability, but the appearance of a strong transient QPO at 6 Hz makes the HS interpretation questionable, as rapid oscillations between different “flavors” of VHS have already been observed [5].
References
- 1. Smith D.M., et al., 2002, ATel., 95.
- 2. Méndez M., & van der Klis M., 1997, ApJ, 479, 926.
- 3. Belloni T., et al., 1997, ApJ, 519, L159.
- 4. Nowak M.A., Wilms J., & Dove J.B., 2002, MNRAS, 332, 856.
- 5. Miyamoto S., & et al., 1991, ApJ, 383, 784.