Wide field weak lensing observations of A1835 and A2204
We present mass reconstructions from weak lensing for the galaxy clusters A1835 and A2204 over fields using data from the ESO/MPG Wide Field Imager. Using a background galaxy population of we detect the gravitational shear of A1835 at significance, and obtain best-fit mass profiles of km/s for a singular isothermal sphere model and kpc, for a ‘universal’ CDM profile. Using a color-selected background galaxy population of we detect the gravitational shear of A2204 at significance, and obtain best-fit mass profiles of km/s for a SIS model and km/s, for a ‘universal’ CDM profile. The gravitational shear at distances greater than is significantly detected for both clusters. The best fit weak lensing cluster masses agree well with both X-ray and dynamical mass measurements, although the central concentration of A1835 is much lower in the weak lensing mass profile than that measured by recent Chandra results. We suggest that this lower concentration is most likely a combination of contamination of the ’background’ galaxy population with cluster dwarf galaxies and the effect of a prolate or tri-axial cluster core with the major axis lying near the plane of the sky. We also detect a number of additional structures at moderate significance, some of which appear to be sub-haloes associated with the clusters.
Key Words.:
Gravitational lensing – Galaxies: clusters: individual: A1835 – Galaxies: clusters: individual: A2204 – dark matter1 Introduction
In recent years, cosmological N-body simulations have been used to obtain theoretical mass profiles for massive clusters of galaxies (Navarro et al. 1997, hereafter NFW; Moore et al. 1999; Jing 2000). While there is some discrepancy between the models for the mass profile at small radii ( kpc), at large radii ( Mpc) they agree that the mass density should decrease as . This is a much steeper slope at large radii than the singular isothermal sphere (hereafter SIS) model, which falls as . Measuring the mass profiles of clusters at large radii, therefore, should provide an excellent test of the predictions from N-body simulations.
Weak gravitational lensing, in which one determines the mass of an object by measuring the shear induced in background galaxies by the gravitational potential of the object, is a powerful tool for determining the mass and mass profile of clusters of galaxies. Because the gravitational shear depends linearly on the two-dimensional mass surface density, it can be used to measure mass profiles to much larger radii than X-ray observations, for which the emissivity scales as the square of the baryonic mass density. Further, the resulting mass measurements have no dependence on the dynamical state of the cluster and are not influenced by shocks caused by infalling material. To date, the primary limitation on the maximum radius to which the cluster mass profiles has been measured with weak lensing ( kpc) has been the size of the detector and the fact that the depth of exposure needed to obtain a sufficient number density of background galaxies for shear analysis made large-area mosaics impractical in telescope time.
With the advent of wide-field mosaic CCD detectors (Luppino et al. 1998), it is now possible to obtain a weak lensing signal to large radii ( Mpc) on moderate redshift clusters in a few hours of telescope time. The mass profile for A1689 out to Mpc was measured by Clowe & Schneider (2001, hereafter CS01). Here we present the mass profiles to similar radii for two additional massive clusters, A1835 and A2204. In Sect. 2 we discuss the image reduction and object catalog generation. We analyze the weak lensing signal for A1835 in Sect. 3 and for A2204 in Sect. 4. In Sect. 5 we present out conclusions. Unless otherwise stated we assume a cosmology, km/s/Mpc, and that the mean redshift of faint galaxies is at .
2 Observations and Data Reduction
Imaging on the fields was performed on the nights of May 29-30, 2000, with the Wide Field Imager (WFI) on the ESO/MPG 2.2m telescope in La Silla, Chile. In total, twelve 900 second exposures in were obtained on A1835 on May 30, twelve 900 second exposures in were obtained on A2204 on May 29, and three 600 second exposures in and were obtained on A2204 on May 30. The night of May 29 was photometric, while the night of May 30 was non-photometric and large changes in the brightness of objects can be seen in consecutive images. The images were taken with a dither pattern which filled in the gaps between the chips in the CCD mosaic, resulting in the final -band images having of their area receiving the full exposure time and the rest receiving varying amounts of lesser exposure times as the area was in the chip gap or out of the field of view for one or more of the images. The images were taken with large enough offsets to fill in the chip gaps, but the final image has of the area covered by a single input image. Because one of the three images is unusable due to severe extinction, the coadded image has of the area covered by just one input image and of the area is blank.
2.1 Image Reduction
The image reduction technique for the -band images is identical to that given in CS01. Treating each chip as its own separate camera, we de-biased the images from a master bias taken at the beginning and end of each night, and corrected for bias drift during the night by subtracting a linear fit to the residual of the overscan strip. The images were then flattened by a 9th by 17th order two-dimensional polynomial fit to the twilight flats. The fit to the twilight flat was performed in order to remove the sky interference fringes present in the -band data. All of the long exposure -band images from each night were then normalized with the mode sky value of the image and medianed together. The resulting night sky super-flat was also fit with a 9th by 17th order polynomial, and the images were flattened with this polynomial. The flattened images were re-normalized and medianed again to produce an image of the fringes, which have a peak-to-peak amplitude of , which was then scaled to each images’ mode sky value and subtracted. As this technique tends to incorrectly subtract regions of low quantum efficiency, such as dust spots, such regions were masked by hand. As was mentioned in CS01, due to the large number of input images and the dithering between the images, the lensing results from this technique are indistinguishable from those produced by simply dividing by the nightsky flatfield with the fringes left in place. This technique, however, should more accurately preserve the photometry of the objects than by dividing by the fringes, particularly around the edge of the image where few input images were averaged. We note that neither of these methods is in principle correct, but lacking the means to separate the fringes from the flat-field for this data set, these two methods were chosen to determine if the miscorrection of the fringes or pixel variations could produce a noticable systematic error in the lensing results. Because the lensing data from the two methods are statistically indistinguishable, we therefore conclude that any systematic error produced is much smaller than the noise in the data. The and -band images were flattened with a medianed flat without the fitting procedure above as the fringes are present only in the -band data.
The sky level in each image was determined by detecting minima in a smoothed image. An image containing only the minima was then smoothed by a 128 pixel, , FWHM Gaussian and divided by a similarly smoothed image containing the number of minima (1 or 0) in each pixel. This produced an image of the sky smoothed on the scale, which was then subtracted from the original image. This process was repeated on the sky-subtracted image using 96, 64, 48, and 32 pixel FWHM Gaussians. The first sky-subtracted image which only subtracts sky variations on the scale was subsequently used for the photometric measurements of cluster galaxies, while the final sky-subtracted image which removed sky variations on a scale, along with extended wings of bright stars and many of the larger galaxies, was used for the weak lensing measurements. The and -band images had only the first sky-subtraction performed, as they are used only for photometry. The sky-fitting routine performed in CS01 could not be used on these fields due to the presence of several large stellar reflection rings in each field.
Stellar reflection rings are quite predominant on the WFI images. Every saturated star with blooming in the core has two reflection rings, roughly in diameter, centered a few arcseconds from the star, radially away from the center of the image with the offset increasing with distance from the center of the image, with typically offset between the two rings. Stars which are bright enough to have the blooming extend beyond the stellar core also have a visible third fainter reflection ring, in diameter, which is centered about twice as far from the star and in the same radial direction as the two smaller rings. Exceptionally bright stars, however, reveal far more reflection rings. A star in the SW corner of the A1835 image, listed as in the USNO-A2.0 catalog (Monet et al. 2000), has three additional reflection rings: a diameter ring centered NE of the star, a diameter ring centered NE of the star, and a very faint ring in diameter centered NNE of the star. A star in the WSW edge of the A2204 image, in the USNO-A2.0 catalog, has two observable reflection rings, similar in size and offset to the first two given above. A star located only a few arcminutes SW of the A2204 cluster near the center of the image also has the same three additional rings, although the first is centered roughly on the star, the second about NE of the star, and the larger third ring centered SSW of the star. In addition, there appear to be a number of smaller reflection rings, in diameter, located SSW of this star which overlap each other sufficiently to make it impossible to determine an accurate count.
The sky-subtraction process above was able to remove the largest reflection ring such that we were confident of being able to accurately measure both magnitudes and second moments of the surface brightness for objects in this ring. For the other two larger rings, the sky-subtraction software was unable to remove the edges of the ring, including the spider shadows, so objects in these regions had their magnitudes and colors measured, but were excluded from the lensing analysis. The regions containing the three brighter rings found around all the stars were excluded from all subsequent analysis, both lensing and photometric.
The next step is to simultaneously combine the eight CCD images into a single image, move it to a common reference frame from all the images of a given field, and remove any distortion in the image introduced by the telescope optics. To do this we assumed that each CCD of the mosaic could be mapped onto a common detector plane using only a linear shift in the and directions and a rotation angle in the - plane. We also assume that these mappings are the same for all the data. In doing so we are assuming the CCDs are aligned sufficiently well vertically that there are no changes in depth at which the focal plane is sampled across the chip boundaries and that the CCDs do not move relative to each other when the instrument is subjected to thermal variations or flexure during the night. These assumptions are verified later by the inability to detect a change in the point spread function (PSF) across the chip boundaries.
We then used a bi-cubic polynomial to map the detector plane for each exposure to a common reference frame for each field. The parameters for the two coordinate mappings were determined simultaneously by minimizing the positional offsets of bright but unsaturated stars among the images of the same field and with the USNO-A2.0 star catalog. A downhill simplex minimization method with multiple restarts was used to minimize the 21 free parameters in the CCD-to-detector plane mapping, while at each step in the simplex the detector plane-to-sky mapping was determined with a LU decomposition (Press et al. 1992) of a minimization matrix. The resulting best fit mappings had a positional rms difference of .06 pixels, , among the images of the same field and between the images and the USNO-A2.0 star catalog coordinates, which is the positional uncertainty of this catalog. No large scale collective offsets between the final stellar positions and those of the USNO-A2.0 catalog were seen in any portion of the fields. We also attempted the mappings using fourth to seventh order two-dimensional polynomials for the detector plane to sky mappings, but the resulting rms dispersions in stellar positions did not improve over the bi-cubic mapping. A discussion of this technique in greater depth can be found elsewhere (Clowe & Schneider 2002).
Each CCD image was then mapped onto the common reference frame using a triangular method with linear interpolation which preserves surface brightness and has been shown not to induce systematic changes in the second moments of of objects in the case fractional pixel shift (Clowe et al. 2000). To attempt to minimize the non-photometric conditions for the -band of A1835 and and -bands on A2204, the images were multiplied by a factor determined from comparing the fluxes of bright but unsaturated stars to those of the image with the brightest fluxes. For A2204 -band, all twelve of the images were within of the brightest, thus confirming the photometric conditions of the first night’s data. For A1835 -band, four of the twelve images were within of the brightest with the remainder at 60-80 of the brightest image. Further, three of the twelve images had stellar FWHM significantly higher than the others, so these were excluded from the summed image. For the and -band images of A2204, all of the images were within of the brightest. The images were then averaged using a sigma-clipping algorithm to remove cosmic rays.
2.2 Catalog Generation and Lensing Analysis
For object detection and photometry in the final images, we used SExtractor (Bertin & Arnouts 1996). For the photometric catalog, SExtractor was used on the images with the smoothed sky subtraction to detect objects which had at least 5 pixels with fluxes greater than twice the signal-to-noise of the sky after smoothing with a 3 pixel FWHM Gaussian. The sky around each object was measured using a 32 pixel thick annulus around the object, and magnitudes were measured both down to a limiting isophote equal to the signal-to-noise of the sky and in a radius aperture. The best-fit Gaussian FWHM and maximum pixel flux were also generated to distinguish stars from galaxies. For the A2204 and -band images, SExtractor was used in two image mode, in which objects were detected and had the outer isophote determined in the -band image, but the magnitudes were measured in the appropriate passband. Unless otherwise stated, all magnitudes and fluxes are measured using the isophotal magnitudes and all colors are from the radius aperture magnitudes. All magnitudes are measured in the Vega system and determined from Landolt (1992) standard star fields observed at various times during the nights.

For the weak lensing analysis, SExtractor was used on the -band images with the smoothed sky subtraction to detect objects which had at least 3 pixels with fluxes greater than the signal-to-noise of the sky. The same sky determination, Gaussian FWHM, and magnitudes were measured as given above. The magnitudes for objects in common to both the lensing and photometric catalogs were statistically identical for galaxies with FWHM less than , which includes nearly all the galaxies used as background galaxies in the weak lensing process. The SExtractor catalog was then used with a modified version of the IMCAT software package, written by Nick Kaiser (http://www.ifa.hawaii.edu/kaiser/imcat). The objects were convolved with a series of Mexican-hat filters of increasing sizes in order to determine the smoothing radius at which the objects achieved maximum signal-to-noise against the sky. The radius with maximum signal-to-noise was then converted to a Gaussian smoothing radius (hereafter for the smoothing radius and for the signal-to-noise) and an average level and slope of the sky were determined. A new centroid for each object was then computed by minimizing the first moments of the surface brightness using a Gaussian weighting function with radius . At this position, a new smoothing radius and signal-to-noise were computed for the object, and a new centroid calculated. This was repeated until either the new centroid was displaced by less than th of a pixel from the previous centroid, in which case the object was kept in the catalog, or either the centroid moved more than a pixel from the original SExtractor coordinates or the signal-to-noise of the object fell below 5, in which case the object was removed from the catalog. For all surviving objects, a encircled light radius () was measured and the second and fourth moments of the surface brightness were calculated using a Gaussian weighting filter with radius . The second moments were then converted into ellipticities, and the flux, second, and fourth moments were used to calculate the shear and smear polarizability tensors ( and ) which define how the object reacts to an applied shear or convolution with a small anisotropic kernel, respectively (Kaiser et al. 1995, hereafter KSB, corrections in Hoekstra et al. 1998).
Unsaturated stars brighter than were selected by their half-light radius and used to model the PSF. As the half-light radius and ellipticity of the stars varied systematically, but smoothly, over the images, the half-light radius, ellipticity components, and the traces of the shear and smear polarizabilities of the stars were fit using two-dimensional seventh-order polynomials. It is important to note that there was no evidence for a change in the PSF, either in ellipticity or size, across any of the regions containing CCD boundaries. This demonstrates both that the WFI CCDs are sufficiently well aligned vertically to avoid changes in the PSF across chip edges and that all of the input images had sufficiently similar PSFs such that the area of the image which does not include contribution from any one image due to the chip gap has the same PSF as the rest of the image. The spatial variation in the PSF both before and after subtraction for the A1835 field can be seen in Fig. 1.
The ellipticities of the galaxies were corrected using (KSB) where is the fitted stellar ellipticity field evaluated at the position of the galaxy, is the original measured ellipticity of the galaxy, and is the fitted trace of the stellar smear polarizability evaluated at the position of the galaxy. The effects of circular smearing by the PSF can then be removed from the galaxies using (Luppino & Kaiser 1997) where , for which the denote the fitted traces of the stellar shear and smear polarizability evaluated at the position of each galaxy. The resulting ’s are then a direct estimate of the reduced shear , where both the shear and convergence , the dimensionless mass density, are second derivatives of the gravitational potential. Because the measured values are greatly affected by noise, we fit as a function of , and . Because the PSF size varied slightly over the image, we divided the background galaxies into 4 bins based on the stellar in their vicinity, and did the fitting separately for each bin. Simulations have shown that this technique reproduces the level of the observed shear to better than one percent accuracy for PSFs of similar profiles and ellipticities to those in these images (van Waerbeke 2000; Erben et al. 2001; Bacon et al. 2001).
3 A1835
Abell 1835, at (Allen et al. 1992) is the most X-ray luminous cluster in the ROSAT Brightest Cluster Sample (Ebeling et al. 1998). It has been studied with both XMM (Peterson et al. 2001) and Chandra (Schmidt et al. 2001, hereafter SA01), both of which demonstrate that the cluster has a relatively cool (3-4 keV) inner core surrounded by a hotter (8-12 keV) outer envelope. While this would suggest the presence of a massive cooling flow, a simple model has been ruled out by the lack of emission lines in the inner region (Peterson et al. 2001). The Chandra observations result in a best fit NFW model with Mpc and , for an cosmology (SA01).
A number of strong lensing arcs have been detected from the brightest cluster galaxy (BCG). The three tangential and one radial arcs are apparently from three or four lensed sources, and can be well fit using a NFW model consistent with the X-ray mass models (SA01). The BCG shows evidence for recent star formation from strong optical emission lines and UV continuum (Allen 1995; Crawford et al. 1999) and 850 m emission (Edge et al. 1999).
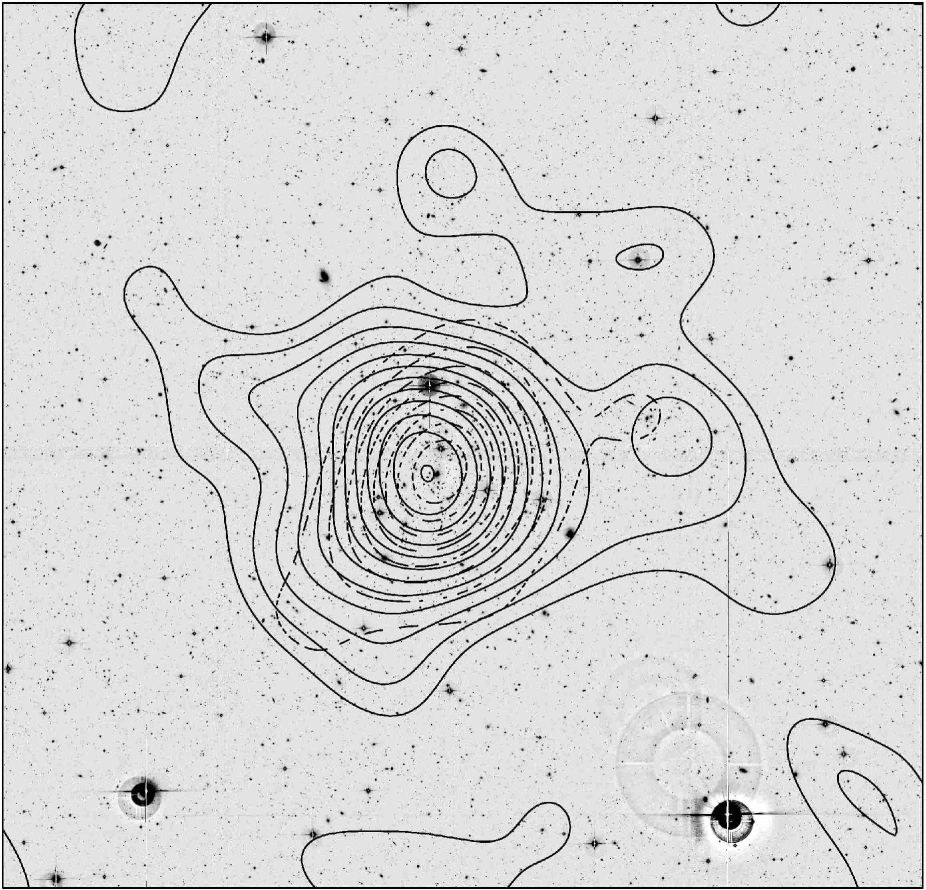
The WFI image used in the weak lensing analysis is shown in Fig. 2. Only nine of the twelve images taken were coadded for the final image, the remaining three having significantly larger seeing. The final image is with having the full exposure time and the remainder receiving lesser amounts due to the region being in a chip gap or out of the field of view for one or more of the images. The sky noise for the regions with the full exposure time is 27.7 mag/arcsec2. The mean seeing on the image is , but this varies systematically with position by , with the worst seeing in the SW quadrant. Object counts at a detection limit in the regions containing the full exposure time are complete to for a radius aperture, as measured by the point where the number counts depart from a power law. Galactic extinction was corrected for using (Schlegel et al. 1998), converted to (Cardelli et al. 1989).

Using the SExtractor isophotal magnitudes, with the outer isophote at 27.70 mag/arcsec2, potential cluster galaxies were selected from objects with best fit Gaussian FWHM larger than stars and with , where is the magnitude of the brightest galaxy of the largest overdensity of galaxies by number in the image, and the galaxy for which the redshift was measured by Allen et al. (1992). Within a radius aperture from the BCG (250 kpc for cosmology, as assumed by Bahcall 1981), the overdensity is galaxies with , where is the magnitude of the third brightest galaxy in the aperture, compared with the number density at the edge of the image, which corresponds to an Abell class III cluster (Abell 1958). Using the same radius for the determination of the second and third brightest cluster galaxies results in a Bautz-Morgan type I (Bautz & Morgan 1970) measurement for the cluster, . Inside a 500 kpc aperture () is a flux overdensity of compared to the flux density in an annulus with kpc. Using a passive evolution correction and K-correction on the synthetic elliptical galaxy spectra of Bruzual & Charlot (1993) results in a measured cluster luminosity of .

For the background galaxy catalog used in the weak lensing analysis, objects which had isophotal magnitudes with , , and (stars had ) were selected from those passing all the tests given in Sect. 2.2. This resulted in a catalog of 15,699 objects, or 14.9 galaxies/sq arcmin, which can be used as a direct measure of the gravitational shear. Shown in Fig. 4 is the radial shear profile of the catalog centered on the BCG. As can be seen, the profile shows an increase of the shear with decreasing radius to pixels (192″, kpc), inside of which the signal falls off. Using the shear between 800 and 4000 pixels (530–2650 kpc) distance from the BCG results in best fit models of km/s velocity dispersion for SIS and kpc, for NFW models. Both models have a significance of 8.8, as measured by from a zero mass model, and the error contours for the NFW models can be found in Fig. 5. The two models are indistinguishable in terms of quality of fit. Using the cosmology of SA01 results in a best fit NFW model with kpc, , which is of the same total mass but with a lower concentration as the Chandra fit. The Chandra best-fit model, however, is within our 1 errors. The mass overdensity inside a kpc aperture compared to the density in a kpc annulus gives a mass excess of for the SIS fit and for the NFW fit. These result in mass-to-light ratios of and respectively. The shear at the edge of the image is still measurable at greater than significance, and the shear from all galaxies more than away from the BCG is detected at significance.
The largest sources of possible systematic errors in these fits are the inclusion of stars and cluster or foreground dwarf galaxies in the background galaxy catalog and the determination of the mean redshift of the background galaxy catalog. The minimum size cut in the catalog, however, should have removed any faint stars, as well as galaxies too small to get a good determination of the second moment of the surface brightness. A catalog without the minimum size cut results in a shear estimate which is 83 of the value with the size cut, which suggests that of the objects in the full catalog are stars, in agreement with estimates from photometric redshift catalogs of the same magnitude range (Fontana et al. 1999). The size cut removed of the objects in the full catalog. As we have only one passband of the region, however, we cannot exclude likely cluster galaxies based on color. Using the same magnitude cuts on the galaxies in a photometric redshift catalog of the HDF-South (Fontana et al. 1999) as those used on the background galaxy catalog results in a means lensing redshift for the background galaxies of . We assume that the background galaxies lie in a sheet at this redshift for the lensing analysis. Contamination by cluster dwarf galaxies will lower the true mean lensing redshift, and therefore increased the measured cluster mass, although presumably not by a significant fraction at the edge of the field. This redshift determination, however, is based on only 47 galaxies in 1.4 square arcminutes, and thus both the Poissonian error and cosmic variance are presumably quite large.
In the determination of the NFW , the majority of the weight in the fit comes from the outer regions of the image. As such, it would be heavily affected by any stellar population remaining in the catalog, but have relatively little effect from cluster dwarfs. The determination of in the NFW fits, however, is strongly dependent on the inner regions of the fit area, and as such is greatly affected by any cluster galaxies in the catalog (an example is given in the A2204 results). A fit to the shear profile from 250-4000 pixels (165-2650 kpc) from the BCG gives kpc, , and the Chandra best-fit model is outside the contours. If one assumes that the Chandra mass model is the true mass model of the cluster, then these lower concentration best-fit NFW models for the weak lensing shear profiles indicate that the fraction of cluster galaxies in the ‘background’ galaxy catalog is at distances more than from the cluster center, at distances of , between , and at .
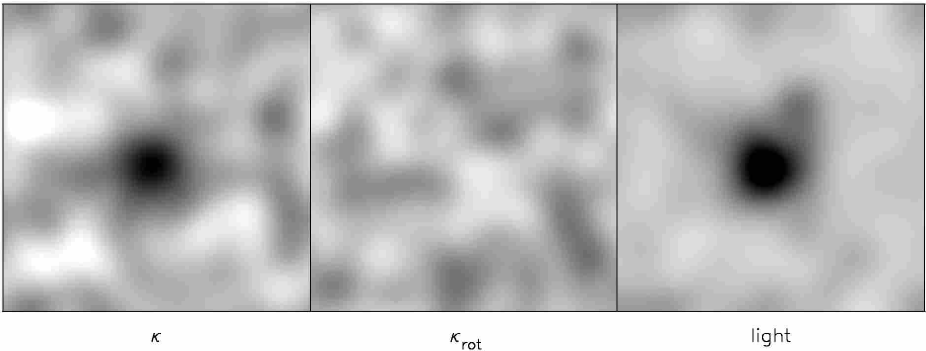
Overlayed in solid contours on the -band image in Fig. 2 is the resulting mass map from a KS93 reconstruction (Kaiser & Squires 1993) smoothed with a Gaussian. Massmaps were also generated with a finite-field reconstruction (Seitz & Schneider 1996) using the same smoothing scale, which show identical structures as seen in Fig. 2. Shown in Fig. 3 are the mass reconsruction in greyscale and a visual estimate of the noise created by rotating all of the shear estimators of the background galaxy catalog by . As can be seen, there is a significant detection of the cluster mass. The centroid of this mass is located east of the BCG, but this offset is not significant. In simulations of a km/s SIS lens with the same background galaxy density as measured in the image, the measured centroid of the mass reconstructions differ from the true centroid by more than of the time. Aside from the main cluster mass peak, several additional mass peaks are seen in the mass reconstruction. Significances for these features were measured using the mass aperture statistic (Schneider 1996; Schneider et al. 1998) after subtracting the cluster reduced shear profile measured in Fig. 4 from the shear estimators of the background galaxy catalog. For this we used the mass aperture statistic
| (1) |
where is the radial distance from galaxy to the aperture center normalized by the maximum filter radius, is the component of the reduced shear measurement for galaxy tangential to the center of the aperture, and the sum is taken over all galaxies within the maximum radius of the aperture.
The significance levels measured by the mass aperture statistic for a radius filter size can be seen in Fig. 6 as contour superimposed on the number density distribution of bright () galaxies. There are five mass peaks which a significance greater than . Four of these peaks, one west and one north of the cluster, and one each in the SW and NW corners of the field, are spatially coincident with peaks in the bright galaxy distribution and are seen in the mass reconstruction in Fig. 2. With a radius filter size, there are independent mass measurements in the field, and the chance of having a 2.5 positive noise peak is . There is only a chance of having five positive mass noise peaks at or higher significance. To measure a mass for these peaks an SIS model was fitted from to radius, centered on the position of highest signal-to-noise. The peak west of the cluster was best fit by a km/s SIS with significance, and the peak of the cluster was best fit with a km/s SIS with significance. The mass measurements assume the peaks are at the redshift of the cluster. The other three peaks were not well fit with a SIS model.
4 A2204
Abell 2204, at (Pimbblet 2001), has been a target of many X-ray surveys (eg Forman et al. 1978; Ulmer et al. 1981; Edge et al. 1990; Ebeling et al. 1996; Jones & Forman 1999; Böhringer et al. 2000). Using ROSAT and ASCA data, Allen (2000) obtains a best-fit model isothermal sphere with km/s with a small (25 kpc) core and a massive cooling flow with . Optical observations of this cluster are complicated by the relatively low galactic latitude, which results in a high extinction and stellar number count, and by the presence of a star southwest of the BCG. Using the 2dF spectrograph, Pimbblet (2001) has measured a velocity dispersion of km/s from 162 cluster galaxies. Also along the line of sight are two foreground groups at and 0.079 and one background group at (Pimbblet 2001). A2204 is measured to be Bautz-Morgan type II and Abell richness class 3 (Abell et al. 1989), but the number counts may be increased by the aforementioned foreground and background structures.
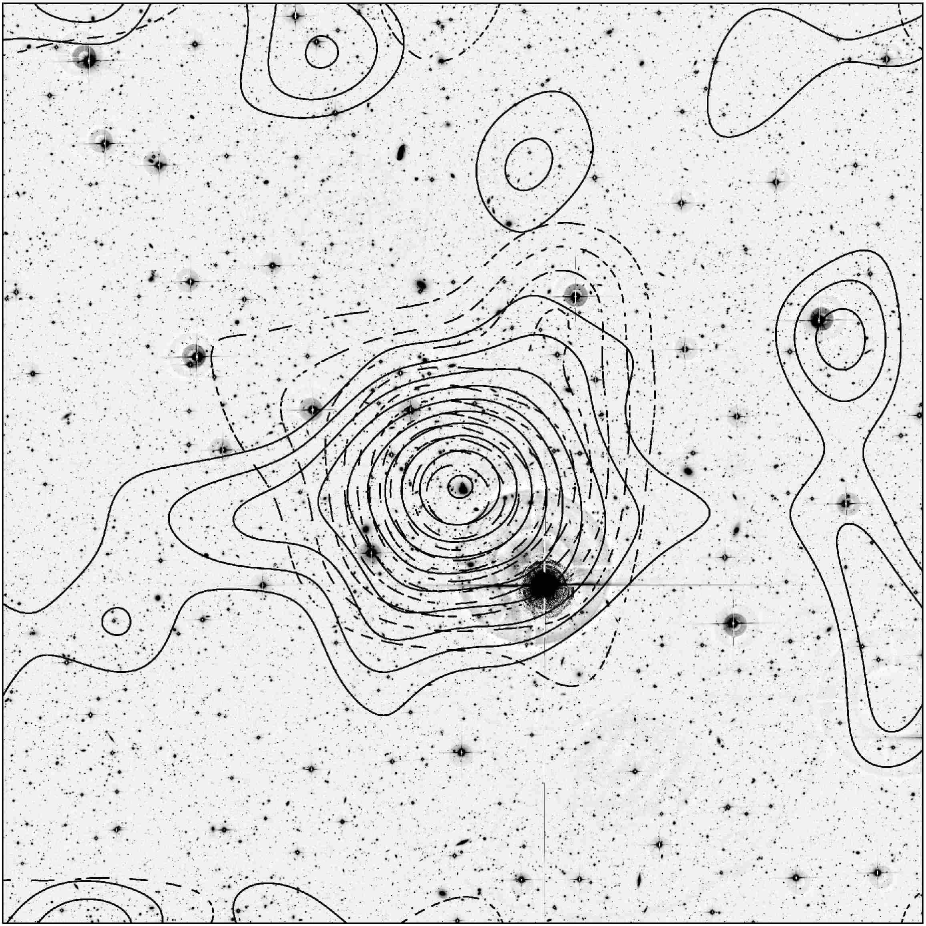
The WFI -band image used in the lensing analysis is shown in Fig. 7. The final image is with of the area receiving the full exposure time of 3 hours. The sky noise for the regions with the full exposure time is mag/arcsec2. The mean seeing on the image is , but this varies systematically with position by with the worse seeing near the bottom edge. Object counts at a detection limit in the regions containing the full exposure time are complete to ( after correction for galactic extinction) for radius aperture magnitudes. The 45 minute and 30 minute -band images are and respectively. Only objects in those regions common to all three images were used in the subsequent analysis, with the exception of objects in three wide vertical stripes located in the chip gaps for which the -band image is blank and thus only and and magnitudes measured. The final area for object detection was . Galactic extinction was corrected for using (Schlegel et al. 1998), converted to , , and (Cardelli et al. 1989).
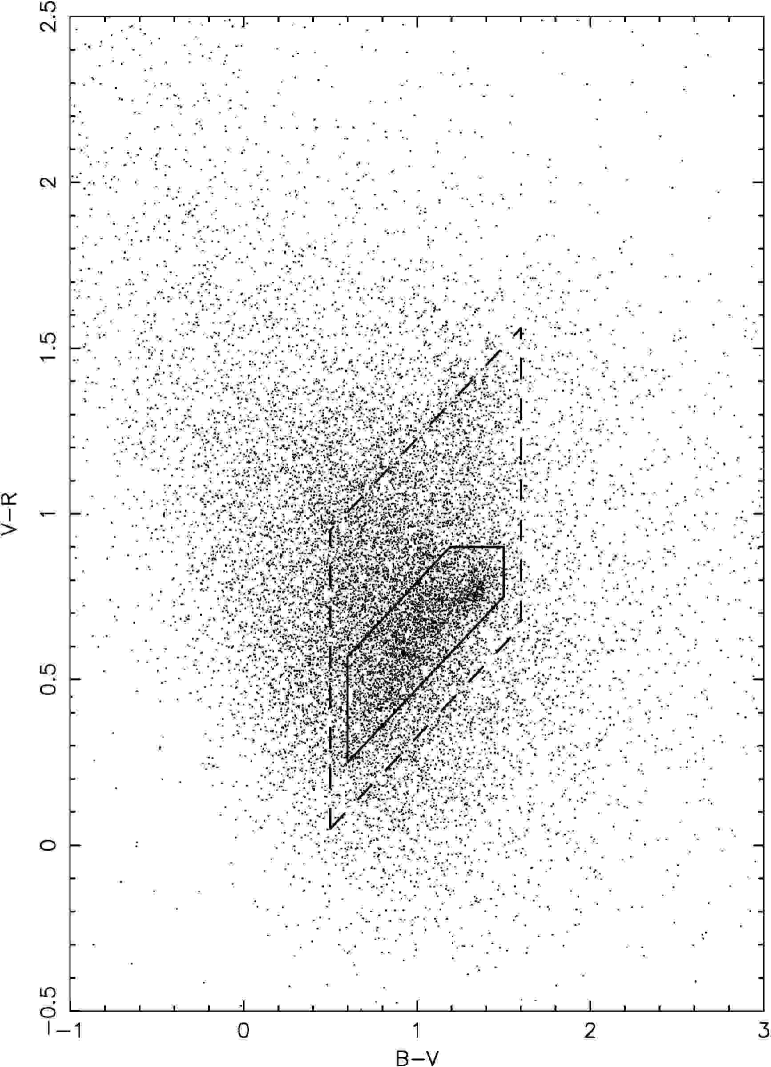
Using SExtractor isophotal magnitudes, with the outer isophote at mag/arcsec2, for luminosity measurements and radius aperture magnitudes for color measurements, potential cluster galaxies were selected from objects with best fit Gaussian FWHM larger than stars and with , , and (see Fig. 9). For objects in the narrow strips not covered by the -band image, potential cluster galaxies were selected with . Inside a 500 kpc aperture (2710) is a flux of . Using a passive evolution correction and K-correction on the synthetic elliptical galaxy spectra of Bruzual & Charlot (1993) results in an absolute cluster luminosity of . Using all of the non-stellar objects within the 500 kpc radius aperture with results in an excess flux of compared to the flux density in a () radius annulus. This results in a cluster luminosity of .

For the background galaxy catalog used in the weak lensing analysis, objects were selected which had isophotal magnitudes with , , , and not with colors , ( for objects in the image gaps). The colors were selected to exclude galaxies with . This resulted in a catalog of 12,989 galaxies, or 12.8 galaxies/sq arcmin, after accounting for the loss of image area due to the stellar reflection rings. Shown in Fig. 10 is the radial shear profile of the catalog centered on the BCG. While the shear at the edge of the image is only significant at the level, the shear for all galaxies greater than from the BCG is detected at greater than significance. Using the Fontana et al. (1999) HDF-S photometric redshift catalog, we find that the mean lensing redshift of after applying the same magnitude and color-cuts as mentioned above. Using the shear between and (– kpc) from the BCG results in best fit models of km/s velocity dispersion for SIS and kpc, for NFW models. The error contours for the NFW fits is given in Fig. 11. The significances of the fits are and for the SIS and NFW models respectively, calculated from the between the best fit and zero mass models. The NFW model provides a marginally better fit to the profile, with the Fχ test of additional term (Bevington & Robinson 1992) giving an confidence level. The mass contained within a kpc radius for these models are for SIS and for NFW. These result in mass-to-light ratios of and .

Also shown in Fig. 10 is the shear profile of the cluster for the background galaxy catalog without rejecting galaxies based on color. This increases the number of galaxies in the catalog by but decreases the mean lensing redshift, as measured from the Fontana et al. (1999) photometric catalog, to . Using this catalog results in a best fit SIS model of km/s velocity dispersion and NFW model with . This is consistent with the expectations discussed in Sect. 3, namely that because the cluster galaxies have an increasing density towards the cluster center, the inability to exclude faint cluster galaxies from the catalog does not significantly reduce the detected cluster mass at large radius, but reduces the concentration in the NFW model. While the measured shear at large radii () is essentially unchanged, the shear in the region - from the cluster center has been decreased by from that of the color-selected catalog. For these fits, the NFW model provides a better fit at a confidence level, although this is mainly due to the lower shear at smaller radius. The fact that the same shear measurement at larger radius results in a larger overall cluster mass is due to the change in the assumed mean lensing redshift of the galaxies. The larger mass in this case indicates that either the field has fewer galaxies in the region than in the HDF-S or that the color cut removed a portion of higher-redshift galaxies not seen in the HDF-S, presumably due to the noise in the color measurement scattering the points into or out of the selected region. This would also indicate that the mean lensing redshift for the color-selected catalog is somewhat overestimated, and that the mass measured for the cluster is underestimated. Simulations in which a similar level of noise was added to the HDF-S galaxy colors and the color-selection applied resulted in the mean lensing redshift decreasing by on average, which results in an increase in the mass models of .
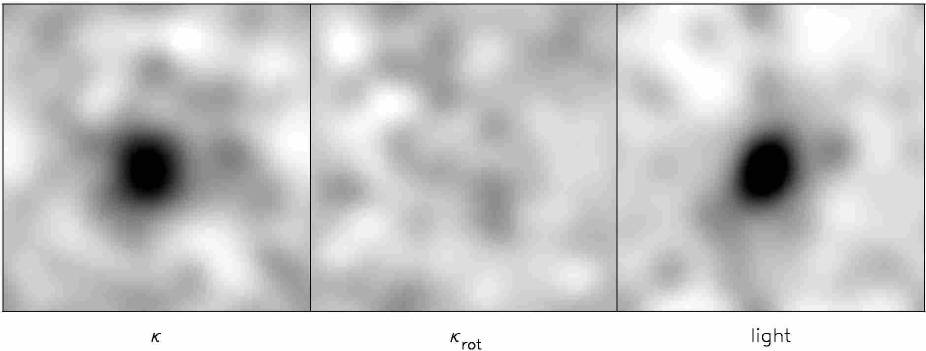
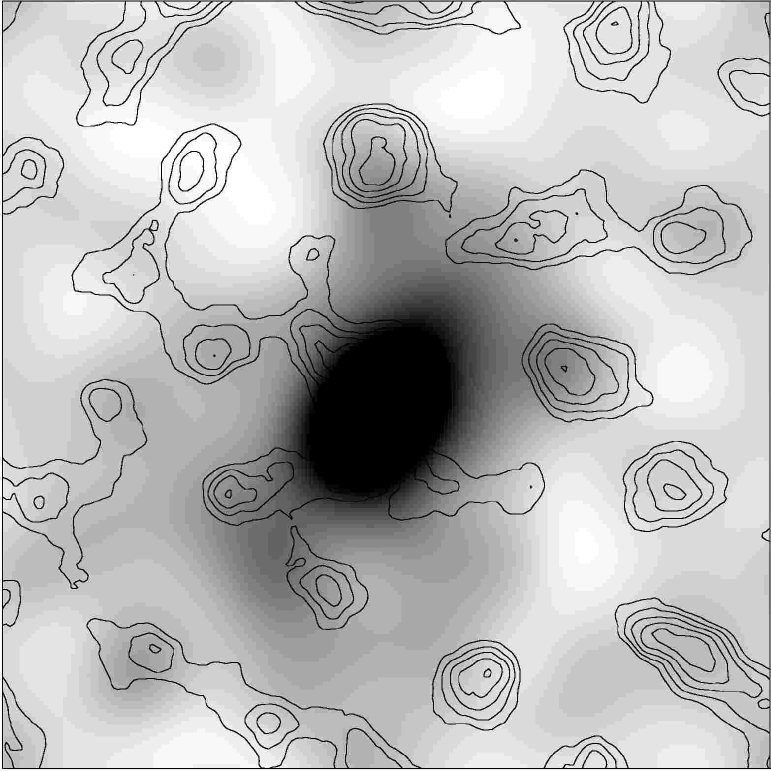
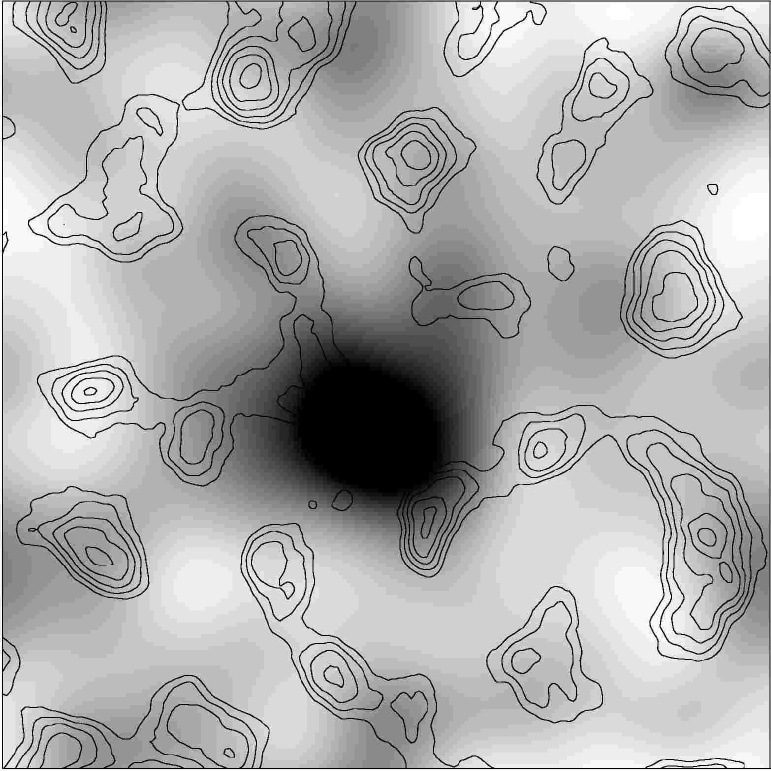
The KS93 mass reconstructions, smoothed by a Gaussian, is shown in solid contours on the -band image in Fig. 7. Shown in Fig. 8 are the mass reconsruction in greyscale and a visual estimate of the noise created by rotating all of the shear estimators of the background galaxy catalog by . As can be seen, there is a significant detection of cluster mass, and the peak of the mass distribution is coincident with the BCG. In addition to the main cluster peak, several additional structures are see in the mass map. Both the mass peak NNW of the cluster center and the filamentary-like structure extending to the east in the mass reconstruction are also found as overdensities of faint galaxies with colors consistent with the cluster galaxies. A smoothed galaxy number density of all galaxies with is shown in Fig. 12 along with signal-to-noise contours for a radius mass aperture statistic calculated on the shear estimators of the background galaxy catalog after subtracting the cluster radial shear profile shown in Fig. 10.
Using the mass aperture statistic with a radius, the NNW peak has a significance of , while the filamentary structure is associated with 2 peaks, a significance peak due east of the cluster and a peak south of there. The fact that the structure which appears filamentary in Fig. 7 is broken into two peaks by the mass aperture statistic is a result of the compensated filter used in the measurement. None of the three peaks is fit well by a SIS model. There are eight mass peaks with a significance of at least when using the radius mass aperture statistic. The expected number of positive mass peaks due to noise is , with a of having at least two such peaks. The chance that all 8 peaks are due only to noise is . In general, these peaks are spatially coincident with overdensities in the bright galaxy distribution, with offsets of expected due to noise. Several of the mass peaks, however, have maximum signal-to-noises given by larger filter radii.
The mass peak WNW of the cluster has a significance as measured from a radius mass aperture. The peak is spatially coincident with an overdensity of faint galaxies with colors magnitudes redder than the cluster sequence, which would imply that the peak is associated with a group of galaxies at . Placing this peak at results in a best fit SIS model of the cluster-shear subtracted background galaxy catalog from to of km/s velocity dispersion, and is distinguishable from a zero mass model at , as measured by the . While the colors of the galaxies near this peak are consistent with the structure in Pimbblet (2001), the best-fit lensing mass is ten times that inferred from the galaxy velocity dispersions. There are two additional structures at the WSW and NNE edges of the image. Both of the structures are significant at using a radius mass aperture, while the chances of having noisepeak from a radius mass aperture statistic in this image is only . Both peaks are near galaxy overdensities which are redder than the cluster galaxies, suggesting redshifts of .
5 Discussion and conclusions
We have detected a shear profile for the clusters A1835 and A2204 over a range of radii. Fitting a SIS model to these shear profiles gives best fit velocity dispersions of 1180 km/s for A1835 and 1040 km/s for A2204, in agreement with the mass measurements from X-ray observations, and significances of 8.8 and 7.2 from zero-mass models, respectively. A2204 has a best fit NFW profile of which is a better fit to the data at confidence. A1835 has a best fit NFW profile of which is statistically indistinguishable in quality of fit from the SIS model. For both clusters we detect the shear between and from the BCG at high significance, which suggests that one will still measure a shear signal from such clusters with even larger format cameras.

While the total mass measured for A1835 is in agreement with the Chandra X-ray observations of SA01, the concentration of mass towards the center of the cluster is much smaller. We believe this is due primarily to contamination of the ‘background’ galaxy catalog used to measure the shear with cluster dwarf galaxies. This would result in the shear in the inner regions of the cluster being reduced due to the presence of a population of zero shear objects, but the shear at large radii being virtually unchanged due to the decrease in number density of the cluster dwarfs with increasing distance from the cluster. We measured this effect in the A2204 data by comparing a catalog of galaxies which had probable cluster members rejected by color with a catalog without any color rejection. The color-selected catalog did have a higher shear in the inner few arcminutes of the cluster radial shear profile while having essentially the same shear at larger radius. The amount of the increase in shear by rejecting cluster dwarf galaxies in A2204 would not be sufficient to bring the X-ray and weak lensing mass concentrations of A1835 into agreement. Using the cluster dwarf number counts of Coma (Trentham 1998) we find from the observed magnitude limits that, given the same cluster richness, A2204, at , would have 2.5 times more cluster dwarfs in the ‘background’ galaxy catalog than A1835, at , but spread over a 2.2 times greater area. Thus, the actual contamination of the A1835 signal should be less than that observed in A2204, but in order to reconcile the shear profile with the X-ray observations, we need the contamination to be three times larger than that in A2204.
The galaxy density profiles in the background galaxy catalogs for the two clusters can be seen in Fig. 13. The rejection of low-z galaxies by color in the A2204 data results in a decrease in the number density of galaxies used for the weak lensing analysis of at large radius and at small radius. As can be seen, while A1835 has a similar number density of galaxies to the catalog without color selection for A2204 at large radius, it has a much larger galaxy density at small radius. There are three possible explanations for this increase in galaxy density in A1835 at small radius. The first is an increased number of cluster dwarf galaxies in the core of A1835 compared to A2204. The second is that there is either an overdensity of background galaxies near A1835 or an underdensity near A2204. The first explanation would result in an increase in the cluster dwarf fraction at small radius for A1835, and thus a greater decrease in the measured mass concentration than is seen in the non-color selected catalog for A2204, while the opposite would be true for the second explanation.
The third possible explanation of the increased galaxy density is that the decrease in the number density of galaxies in A2204 with decreasing radius is mostly due to the rejection of galaxies from the background galaxy catalog which have near neighbors and the increased bright galaxy density at the cluster core. A catalog of faint galaxies without this near neighbor rejection actually shows a slight rise in galaxy density at small radius in A2204, consistent with the small increase in color selected galaxies with decreasing radius discussed above. Because A1835 is at higher redshift than A2204, however, the cluster core has a much smaller angular size. As a result, the increase in rejection of galaxies from the background galaxy catalog should occur at a smaller angular radius in A1835 than in A2204, which is what appears to be occurring in Fig. 13. The fact that the number density profile of galaxies without the near neighbor rejection is similar for the two clusters suggests that this third explanation is the most likely, and thus the lensing mass profile does, in fact, have a smaller concentration than that measured from the X-ray data.
One possibility for the lower concentration in the weak lensing mass model than in the X-ray mass model would be an elliptical cluster core. The X-ray NFW profile was measured by using a spherical 3-dimensional model which was compared with a deprojected spectrum of the Chandra data. The weak lensing profile, however, is created by first integrating the mass along the line of sight, then fitting with a circularly symmetric model. In the case of a prolate cluster core, if the major axis of the core is lying in the plane of the sky then the best-fit weak lensing profile will have a smaller concentration than that of the X-ray model due to the fact that in the weak lensing analysis the mass is projected into a plane before being circularly averaged, while in the X-ray analysis the mass is spherically averaged. Conversely, if the major axis is lying along the line of sight, the weak lensing profile will have a higher concentration than the X-ray model. In studies of a CDM N-body cluster, King et al. (2001) found that the best fit 2-dimensional NFW concentration parameter among different projection axes could vary by .
In addition to the primary cluster mass peak, several additional peaks were found in both clusters at significance using - radius mass aperture statistics. Only two of the six peaks are not spatially coincident with galaxy overdensities, but both are located at the edge of the image, and thus could be associated with structures immediately outside the field of view. In addition, the mass reconstructions of both clusters have filamentary-like structures extending from the cluster cores. These structures are also seen in faint galaxy distributions, and part of the structure in A1835 is spatially coincident with an X-ray source.
Finally, we note that all of the masses quoted herein have assumed that the background galaxies have the redshift distribution given by the Fontana et al. (1999) HDF-S photometric redshift catalog. The appropriate magnitude and color cuts were made to this catalog, and the mean lensing redshift for the sample was calculated for each cluster. While the mean lensing redshift of the background galaxies does not affect the significance of the shear signals, it does affect both the total mass of the clusters and the concentration parameter of the best fit NFW profile. An overestimate of the mean background galaxy redshift would result in both the best-fit mass and concentration value for a cluster being lower than the true value. Because both A1835 and A2204 are at relatively low redshifts, the measured mass changes slowly with the mean lensing reshift. For the A2204 color selected catalog, the background galaxy mean lensing redshift would need to shift from the measured to or in order for the systematic error from the redshift estimate to equal the level of the random error from the intrinsic galaxy ellipticities and mass sheet degeneracy. For the A1835 catalog, the background galaxy mean lensing redshift would need to shift from the measured to or for the systematic error in the assumed mean lensing redshift to equate to the random error from the background galaxy distribution.
Acknowledgements.
We wish to thank Lindsay King, Jean-Paul Kneib, Robert Schmidt, and Ian Smail for help and useful discussions. This work was supported by the TMR Network “Gravitational Lensing: New Constraints on Cosmology and the Distribution of Dark Matter” of the EC under contract No. ERBFMRX-CT97-0172 and a grant from the Deutsche Forschungsgemeinschaft.References
- Abell (1958) Abell, G. O. 1958, ApJS, 3, 211
- Abell et al. (1989) Abell, G. O., Corwin, H. G., & Olowin, R. P. 1989, ApJS, 70, 1
- Allen (1995) Allen, S. W. 1995, MNRAS, 276, 947
- Allen (2000) —. 2000, MNRAS, 315, 269
- Allen et al. (1992) Allen, S. W., Edge, A. C., Fabian, A. C., et al. 1992, MNRAS, 259, 67
- Böhringer et al. (2000) Böhringer, H., Voges, W., Huchra, J. P., et al. 2000, ApJS, 129, 435
- Bacon et al. (2001) Bacon, D., Refregier, A. R., Clowe, D., & Ellis, R. S. 2001, MNRAS, 325, 1065
- Bahcall (1981) Bahcall, N. A. 1981, ApJ, 247, 787
- Bautz & Morgan (1970) Bautz, L. P. & Morgan, W. W. 1970, ApJL, 162, L149
- Bertin & Arnouts (1996) Bertin, E. & Arnouts, S. 1996, A&AS, 117, 393
- Bevington & Robinson (1992) Bevington, P. R. & Robinson, D. K. 1992, Data Reduction and Error Analysis for the Physical Sciences (WCB/McGraw-Hill, Boston)
- Bruzual & Charlot (1993) Bruzual, A. G. & Charlot, S. 1993, ApJ, 405, 538
- Cardelli et al. (1989) Cardelli, J. A., Clayton, G. C., & Mathis, J. S. 1989, ApJ, 345, 245
- Clowe et al. (2000) Clowe, D., Luppino, G. A., Kaiser, N., & Gioia, I. M. 2000, ApJ, 539, 540
- Clowe & Schneider (2001) Clowe, D. & Schneider, P. 2001, A&A, 379, 384
- Clowe & Schneider (2002) Clowe, D. & Schneider, P. 2002, in prep.
- Crawford et al. (1999) Crawford, C. S., Allen, S. W., Ebeling, H., Edge, A. C., & Fabian, A. C. 1999, MNRAS, 306, 857
- Ebeling et al. (1998) Ebeling, H., Edge, A. C., Bohringer, H., et al. 1998, MNRAS, 301, 881
- Ebeling et al. (1996) Ebeling, H., Voges, W., Bohringer, H., et al. 1996, MNRAS, 281, 799
- Edge et al. (1999) Edge, A. C., Ivison, R. J., Smail, I., Blain, A. W., & Kneib, J.-P. 1999, MNRAS, 306, 599
- Edge et al. (1990) Edge, A. C., Stewart, G. C., Fabian, A. C., & Arnaud, K. A. 1990, MNRAS, 245, 559
- Erben et al. (2001) Erben, T., Van Waerbeke, L., Bertin, E., Mellier, Y., & Schneider, P. 2001, A&A, 366, 717
- Fontana et al. (1999) Fontana, A., D’Odorico, S., Fosbury, R., et al. 1999, A&A, 343, L19
- Forman et al. (1978) Forman, W., Jones, C., Cominsky, L., et al. 1978, ApJS, 38, 357
- Hoekstra et al. (1998) Hoekstra, H., Franx, M., Kuijken, K., & Squires, G. 1998, ApJ, 504, 636
- Jing (2000) Jing, Y. P. 2000, ApJ, 535, 30
- Jones & Forman (1999) Jones, C. & Forman, W. 1999, ApJ, 511, 65
- Kaiser & Squires (1993) Kaiser, N. & Squires, G. 1993, ApJ, 404, 441
- Kaiser et al. (1995) Kaiser, N., Squires, G., & Broadhurst, T. 1995, ApJ, 449, 460
- King et al. (2001) King, L., Schneider, P., & Springel, V. 2001, A&A, 378, 748
- Landolt (1992) Landolt, A. U. 1992, AJ, 104, 340
- Luppino & Kaiser (1997) Luppino, G. A. & Kaiser, N. 1997, ApJ, 475, 20
- Luppino et al. (1998) Luppino, G. A., Tonry, J. L., & Stubbs, C. W. 1998, SPIE, 3355, 469
- Monet et al. (2000) Monet, D., Bird, A., Canzian, B., et al. 2000, USNO-A2.0 (U.S. Naval Observatory, Washington DC)
- Moore et al. (1999) Moore, B., Quinn, T., Governato, F., & Stadel, J.and Lake, G. 1999, MNRAS, 310, 1147
- Navarro et al. (1997) Navarro, J. F., Frenk, C. S., & White, S. D. M. 1997, ApJ, 490, 493
- Peterson et al. (2001) Peterson, J. R., Paerels, F. B. S., Kaastra, J. S., et al. 2001, A&A, 365, L104
- Pimbblet (2001) Pimbblet, K. A. 2001, Ph.D. Thesis
- Press et al. (1992) Press, W. H., Teukolsky, S. A., Vetterling, W. T., & Flannery, B. P. 1992, Numerical Recipes in C (Cambridge University Press)
- Schlegel et al. (1998) Schlegel, D. J., Finkbeiner, D. P., & Davis, M. 1998, ApJ, 500, 525
- Schmidt et al. (2001) Schmidt, R. W., Allen, S. W., & Fabian, A. C. 2001, MNRAS, 327, 1057
- Schneider (1996) Schneider, P. 1996, MNRAS, 283, 837
- Schneider et al. (1998) Schneider, P., van Waerbeke, L., Mellier, Y., et al. 1998, A&A, 333, 767
- Seitz & Schneider (1996) Seitz, S. & Schneider, P. 1996, A&A, 305, 383
- Trentham (1998) Trentham, N. 1998, MNRAS, 293, 71
- Ulmer et al. (1981) Ulmer, M. P., Kowalski, M. P., Cruddace, R. G., et al. 1981, ApJ, 243, 681
- van Waerbeke (2000) van Waerbeke, L. 2000, MNRAS, 313, 524