The Nature of Dark Matter in Elliptical Galaxies:Chandra Observations of NGC 4636
Abstract
We determine the total enclosed mass profile from 0.7 to 35 kpc in the elliptical galaxy NGC 4636 based on the hot interstellar medium temperature profile measured using the Chandra X-ray Observatory, and other X-ray and optical data. The total mass increases as to a good approximation over this range in radii, attaining a total of M⊙ (corresponding to ) at 35 kpc. We find that at least half, and as much as 80%, of the mass within the optical half-light radius is non-luminous, implying that NGC 4636 has an exceptionally low baryon fraction. The large inferred dark matter concentration and central dark matter density, consistent with the upper end of the range expected for standard cold dark matter halos, imply that mechanisms proposed to explain low dark matter densities in less massive galaxies (e.g., self-interacting dark matter, warm dark matter, explosive feedback) are not effective in elliptical galaxies (and presumably, by extension, in galaxy clusters). The composite (black hole, stars, and dark matter) mass distribution has a generally steep slope with no core, consistent with gravitational lensing studies.
1 Introduction
1.1 Context
The presence of extended dark matter halos in late-type galaxies inferred from analysis of gas and stellar dynamics is well-established; and, attention is now focussed on comparing the detailed mass distribution with theoretical predictions of galactic dark halo structure. In a universe predominantly composed of non-baryonic matter with specified characteristics, the mass distribution is determined by the cosmological world model, the initial density perturbation spectrum, and – at least on galactic scales – the dynamical response to the reconfiguration of the secondary, baryonic component that occurs during galaxy formation. Models where non-interacting (except for gravity) cold dark matter (CDM) constitutes the primary mass component are highly successful in providing an explanatory framework for a diverse range of phenomena in the cosmological setting, and are now standard. However a critical re-examination of the CDM paradigm is underway, due in large part to its confrontation with measurements of late-type galaxy mass distributions indicating that dark matter is less concentrated than expected.
Dark matter density distributions in the centers of collapsed structures in CDM-dominated model universes increase at least as steeply as (e.g., Navarro, Frenk, & White 1997; Ghigna et al. 2000). However, over a wide range of galaxy luminosity and morphological type – including luminous spiral, dwarf, and low surface brightness galaxies – observational data favor mass models with dark matter cores. Some attempt to explain this discrepancy by proposing an alteration in the nature or perturbation spectrum of dark matter in such a way that the density distribution evolves to develop a core, or is initially more diffuse on galaxy scales. Whether any of these variants offer success over the full range of mass scales from dwarf galaxies to galaxy clusters, without conflicting with other astrophysical and particle physics considerations, is an open question (Silk, 2002). In a separate class of alternative scenarios, the assumption of the cold, non-interacting nature of dark matter is retained; but, dynamical effects from other mass constituents during the galaxy formation epoch reduce the central dark matter concentration. This feedback may take the form of core heating via mergers of two systems with supermassive black holes, or gravitational coupling to powerful outflows in a baryon dominated central proto-galactic region. §5 of the present paper includes details on the observational situation and these proposed explanations.
The form of the dark matter distribution in elliptical galaxies could prove decisive in this debate, since these are the most massive galaxies with the largest supermassive black holes, display strong evidence for undergoing early outflows and, have high central stellar densities. Various alternative explanations for the absence of dark matter cusps in late-type galaxies may very well diverge in their expectations of whether low central dark matter concentrations occur in ellipticals as well.
1.2 Dark Matter in Elliptical Galaxies
A consensus affirming the presence of dark matter in elliptical galaxies is finally emerging from a diversity of observational programs, including optical studies of ionized gas disks (Bertola et al., 1993), dynamical modeling of stellar kinematical data (e.g., Gerhard et al. 2001, Magorrian & Ballantyne 2001, §5.3; but, see Baes & Dejonghe 2002), gravitational lensing statistical studies, (e.g., Keeton 2001, §5.1.2), and analysis of extended X-ray emitting gas distributions (e.g., Loewenstein & White 1999). As is the case for spiral galaxies, dark matter in elliptical galaxies comprises an increasing fraction of the total mass with distance from the galactic nucleus, and does not obviously become the dominant constituent until beyond the optical half-light radius .
Progress on constraining the dark matter distribution in elliptical galaxies was impeded by the absence of fine angular resolution measurements, over a sufficiently broad dynamical range in radii, of mass tracers in individual systems. Data with these qualities are now obtainable, following the launch of the Chandra X-ray Observatory with its capability for imaging and imaging spectroscopy on sub-arcsecond scales over a field-of-view. In this paper we utilize analysis of Chandra observations of NGC 4636 to investigate the dark matter distribution in this elliptical galaxy. Observations and data analysis are described in §2, the mass modeling procedure explained in §3, and the resulting dark matter constraints presented in §4. In §5 we compare these constraints with theoretical expectations in the context of standard CDM, with results of gravitational lensing studies, and with observations of galaxies of other Hubble types – as well as with expectations for elliptical galaxies based on various explanations for the low central dark matter densities in these galaxies. Our conclusions follow in §6. A distance of 15 Mpc to NGC 4636 is adopted (Tonry et al., 2001).
2 Observations and Spectral Analysis Results
NGC 4636 was observed with the Chandra ACIS-S instrument for 50 ksec on 26 January 2000; an earlier 10 ksec ACIS-I observation is not discussed here. Spectra are exclusively extracted from the S3 chip in the four annuli described in Table 1, selected to obtain sufficient photons for spectral parameter uncertainties to be systematics-limited. Response and auxiliary response files are derived using the Chandra X-ray Observatory Science Center, August 2001, C ACIS S3 chip response products, and Chandra Interactive Analysis of Observations software implemented with a script written by K. Arnaud. Background is subtracted, but is unimportant out to the radius of the outermost Chandra spectral extraction annulus (). Since discrete X-ray binaries are not easily detected against the bright central diffuse emission inside , we did not explicitly exclude them from the extracted spectra. Instead each annulus is fit with two-components, including a variable-abundance, thermal plasma modeled with the APEC code (Smith et al., 2001c), plus a hard spectral component to account for the binaries. The composite spectra of X-ray binaries located outside the central can be fit by a keV bremsstrahlung model (see, also, Angelini et al. 2001 for NGC 1399); there is no evidence for an associated soft component. We fix the hard component accordingly; the derived thermal plasma parameters are insensitive to reasonable variations in the assumed hard component temperature.
Our derived temperatures, abundances, and column densities are displayed in Table 1. Also shown are values of reduced- for the best fits; there are no systematic residuals, and most of originates at energies keV. Temperatures and Fe abundances are consistent with those derived from the XMM-Newton Reflection Grating Spectrometer (RGS) for the central (Xu et al. 2002). Statistical errors in the temperature are 0.01–0.02 keV, and dominated by systematic errors originating in modeling assumptions, the plasma code, and the Chandra calibration. Additional uncertainties arise from systematic errors in the S3 response matrix. Prior to the release of the August 2001 response products, these systematic errors precluded reliable detailed fitting and error estimation. In line-rich sources such as elliptical galaxies, temperatures derived using the earlier matrices were very sensitive to the choice of thermal model and unstable to changes in the assumptions. While new response matrices are considerably improved, they remain uncertain at energies below 0.7 keV. This renders the derived column densities and O abundances unreliable, and explains the inconsistency with the Xu et al. (2002) XMM-Newton RGS results for these parameters (for these, and other calibration-related reasons, we do not quote errors on the abundances at this time). However, because temperatures derived from CCD spectra are primarily determined by the ionization balance of Fe and the effective energy and shape of the Fe-L blended line complex above 0.8 keV, we believe that our temperatures are as reliable as the atomic physics used to model them. The Chandra temperatures show good agreement with those derived from the XMM-Newton European Photon Imaging Camera in the regions of angular overlap (J. R. Peterson, private communication). The APEC code has been tested using RGS observations of stars and NGC 4636 itself (Xu et al., 2002), and has proved robust at the level required here. We have not fitted spectra with multi-temperature models because of the dominance of systematic errors resulting from calibration and atomic physics parameter uncertainties, and because the XMM-Newton RGS fits indicate the presence of a narrow range of temperatures in the RGS beam consistent with a single-phase gas with the temperature gradient inferred from the Chandra data.
3 Mass Modeling Method and Assumptions
3.1 Overview
The method for constraining the mass profile in NGC 4636 is explained in Loewenstein & White (1999). The spherically symmetric equation of hydrostatic equilibrium is solved for the temperature distribution for comparison (following emission-weighted averaging) with the observed profile. The Jeans equation is simultaneously solved, since acceptable mass models must be consistent with the observed optical velocity dispersion profile (for some reasonable velocity ellipsoid anisotropy distribution). A parameterized gas density distribution is derived from the Chandra surface brightness profile. The mass model consists of a M⊙ central supermassive black hole (Merritt & Ferrarese, 2001), a constant mass-to-light component following the observed optical light profile, and an additional dark matter component that does not trace the light. The latter is parameterized by asymptotic density slopes at the origin and at infinity, a scale length determining the transition from inner to outer slope, and a normalization.
3.2 The Stellar Density Distribution
Analysis of Hubble Space Telescope (HST) V- and H-band images show that the inner stellar surface brightness distribution can be characterized by a “Nuker” model (Faber et al., 1997), while the lower resolution, but more extensive, ground-based (major-axis) profile can be fit with a “Sersic” model with an exponent that, in this case, is close to the de Vaucouleurs law value (Caon, Capaccioli, & D’Onofrio, 1993). A function that provides an excellent fit to the surface brightness over the entire observed range of projected radii, , is
| (1) |
| (2) |
where we adopt the following (V-band) Nuker parameters from Faber et al. (1997): break radius , and slopes , , and . The H-band surface brightness distribution, as measured with HST/NICMOS confirms the accuracy of these parameters (Quillen, Bower, & Stritzinger, 2000; Ravindranath et al., 2001). The surface brightness at is 17.71 V magnitudes arcsec-2, and produces a smooth transition to the observed Sersic profile. Equation (1) is numerically deprojected and integrated to derive, after multiplication by a constant mass-to-light ratio , the radial stellar mass density and integrated mass distributions. generally is a free parameter in our models and, in effect, subsumes all (dark or luminous) matter distributed as the optical light.
3.3 The Gas Density Distribution
The azimuthally-averaged Chandra diffuse emission surface brightness profile in the 0.5–2.0 keV band (see Loewenstein et al. 2001) is characterized by a flat core, an inflection in the region, and declines both between the core and the inflection and outside of the inflection. Since the inflection is associated with non-azimuthal structure in the image (Jones et al., 2001) likely to be out of hydrostatic equilibrium, we do not try to model the profile in detail but, instead, derive a smooth characterization of its overall shape. Motivated by energy-balance arguments (Loewenstein & Mathews, 1987) and the large-scale correspondence of X-ray and optical surface brightness first noted by Trinchieri, Fabbiano, & Canizares (1986), we adopt the following approximation:
| (3) |
Models using a “double-beta model” fit yield substantially similar results, and fits including and excluding the non-azimuthal structure are consistent at the % level.
3.4 The Dark Matter Density Distribution
The dark matter distribution of virialized objects in numerical simulations of structure formation can be characterized by functions of the “generalized NFW” form,
| (4) |
where the scale-length , for a given cosmological world model and density perturbation spectrum, is primarily determined by the virialized mass, but also may vary with formation redshift and mass accretion history (e.g., Wechsler et al. 2002). Since there is some theoretical uncertainty in the expected value of , and since both and may be altered by coupling of the halo to an evolving baryonic component, is a freely varying parameter in our mass models and we consider , 1, 3/2, and 2. Integrating equation (4) yields the dark matter mass distribution,
| (5) |
where
| (6) |
In addition to and , the dark matter distribution is determined by , the dark-to-luminous mass ratio at an (optical and X-ray) observationally relevant scale we choose to be ( or 46.7 kpc) – a radius encompassing roughly 90% of the optical light. We also consider pseudo-isothermal models with
| (7) |
and
| (8) |
4 Results
4.1 Model Evaluation
We construct mass models with observed emission-averaged temperature profiles in projection that match that observed for NGC 4636. In addition to the Chandra temperature measurements in four annuli within of the galaxy center (Table 1), successful models are required to reproduce the observed nearly isothermal ( keV) profile in the region. This outer temperature profile was derived from analysis of XMM-Newton CCD spectral analysis (Peterson et al., in preparation), and confirmed by us from re-analysis of Advanced Satellite for Cosmology and Astrophysics (ASCA) data with the APEC plasma model used to derive the Chandra temperatures. The statistical errors in the temperatures are essentially negligible and clearly much lower than systematic uncertainties, such as those resulting from remaining inaccuracies in the plasma code and the assumption of spherical symmetry. In this work we discuss mass models that most nearly reproduce the best-fit temperature profile (Figures 1, 2, 8), without consideration of errors, emphasizing the most robust properties of the models. Thus, we make no strong claims as to the exact functional form of the dark matter density distribution, but are secure in our conclusions about the total mass profile: its statistical uncertainty directly reflects those in the temperature profile that are on the few percent level.
4.2 Constant Mass-to-Light Models
It is readily apparent that the Chandra temperature profile cannot be reproduced with constant mass-to-light ratio models. Figure 1 shows the predictions of models with and (in solar units). We confirm that the former value produces the observed line-of-sight velocity dispersion of km s-1 inside (e.g., Bender, Saglia, & Gerhard 1994) assuming isotropic orbits. This failure of constant models indicates that dark matter must become significant beyond a few kpc.
4.3 Single Dark Matter Component Models
For a given central dark matter slope , we find the combination of , , and that provides the best match to the observed temperature profile (for the best-fit model parameters and characteristics of interest, see Tables 2 and 3, respectively). Matches for and 1.5 are of comparable quality, with the latter implying a lower stellar mass-to-light ratio: compared to . The best-fit model (with ) is a marginally worse match. As the assumed value of is increased, lower values of and higher values of are indicated. However, as is the case for the constant models, models with are too centrally concentrated to reproduce the observed temperature profile. The predicted emission-averaged, projected temperature distributions for the best-fit and models are shown in Figure 2.
Also shown in Figure 2 is the best-fit model with stellar mass-to-light ratio fixed at (Kronawitter et al., 2000). This model is not as successful at reproducing the temperature profile as models with freely varying values of (the mean square temperature deviation is about three times as high and the innermost temperature badly discrepant; Table 2, Figure 2), a consequence of the observed combination of relatively steep temperature rise followed by sharp turnover (naturally, models with and fare even worse).
While the best-fit stellar mass-to-light profile depends on the assumed form of the dark matter distribution, the total mass-to-light ratio is determined by the temperature profile itself and is robust, as demonstrated in Figure 3 for the best-fit , and 0 models. Compared on sufficiently large () scales, the inferred masses are in good agreement with previous results (Mushotzky et al., 1994; Brighenti & Mathews, 1997; Matsushita et al., 1998).
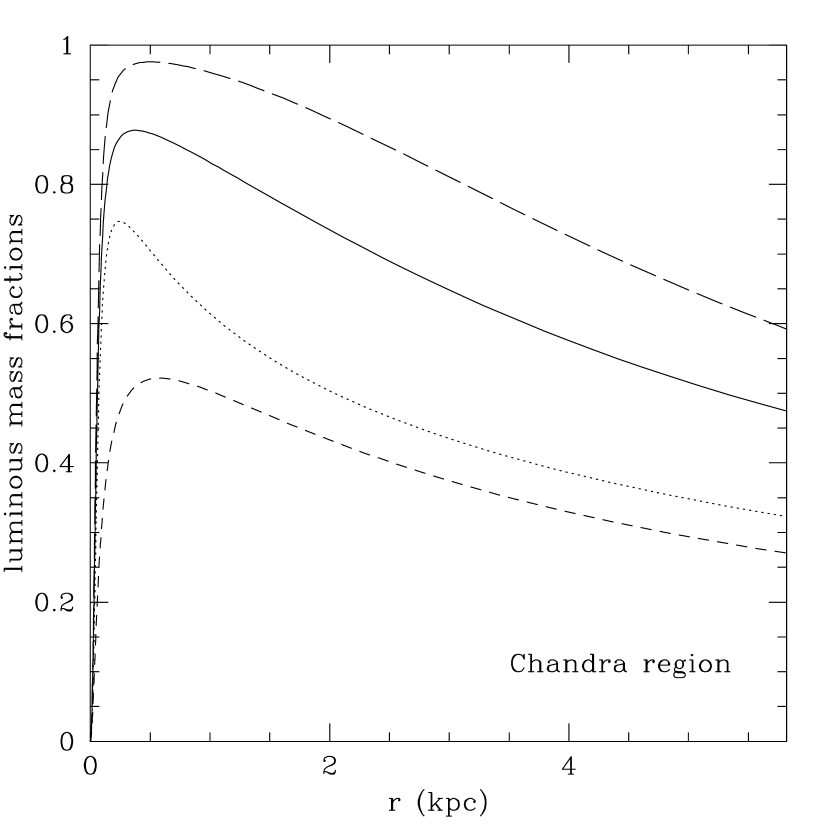
Figures 4a, 4b, and 4c show the dark and luminous mass fraction distributions for these same models, over the radial range covered by the Chandra and XMM-Newton/ASCA temperature profiles. These illustrate that even the high angular resolution Chandra data cannot eliminate ambiguity in the relative contributions of luminous and dark matter inside the half-light radius, kpc (e.g., Kronawitter et al. 2000), and in the radius at which dark matter starts to dominate. However, interesting limits can be derived – even for the models that are (at best) marginally acceptable, % of the mass within is dark and the radius beyond which more than half of the enclosed mass is dark is kpc. These are certainly very conservative lower and upper limits, respectively. For the best-fit model with a dark matter core (), the dark and luminous component mass fractions are approximately equal within .
Figures 5a, 5b, and 5c show the mass decompositions for the best-fit, single-component , , and models, respectively, and further illustrate this tradeoff. Although the total mass distributions are nearly identical, dark matter is significant throughout the galaxy for , but negligible out to a significant fraction of for the other two slopes.
The average enclosed dark matter densities are shown in Figures 6a and 6b for the best-fit , and 0 models as well as the best-fit model with fixed at 8. Again, the tradeoff between allowed dark and luminous matter components is apparent given sufficient flexibility in the assumed distribution of the former. The implications of these constraints for the nature of the dark matter in NGC 4636 is discussed in §5.
4.4 Double Dark Matter Component and Pseudo-Isothermal Models
We also consider two-component dark matter models composed of distributions where one component has steep inner density slope (, 1.5, 2), and the other a flat inner slope (). Secondary scale length and normalizations become additional parameters to be fit for. Best-fit parameters and model characteristics are shown in Tables 2 and 3: naturally, the additional parameters allow for even better formal fits (see Figure 2). As before, models with a component are ruled out (the steep-component normalizations are driven to zero in the fitting process). The range of characteristics (central dark matter density, dark/luminous mass decomposition, etc.) of such models is narrower than for the one-component models, as the additional flexibility afforded by the extra component results in tighter model-to-model convergence to more exact matches of the observed temperatures. The formally best-fit models are composed of relatively minor flat components with small () scale-lengths and dominant steep components with much larger () scale-lengths. However, fits of comparable quality can be obtained in models where both dark matter components have scale lengths of the order of a few or smaller, and where the flat component becomes significant – or even dominant – within . If is fixed at 8, the normalization of the steep component is driven to 0 and the models become indistinguishable from those discussed in §4.3 above. The mass-to-light, dark and luminous mass fraction, and dark matter density distributions are shown in Figures 3, 4a-c, and 6a-b, respectively, for the best-fit two-component model with (the curves for the corresponding model with differ very little from those for the single-component model). Figures 7a and 7b show the mass decompositions for these best-fit two-component models.
The dark matter density profiles discussed above are of the form given by equation (4), declining as at large as determined from numerical simulations. Since reproducing the observed temperature profile, in particular the steep rise to keV and sharp turnover at 10 kpc, requires dark matter to become prominent inside kpc, the total mass begins to decrease more slowly than at a radius of this order. As a result, the equilibrium temperature displays a radial decline initiating just beyond the radius of the final observed temperature – a fine-tuned solution that may conflict with evidence that the gas remains isothermal to much larger radii (Trinchieri et al., 1994; Mushotzky et al., 1994; Matsushita et al., 1998; Matsushita, 2001). For this reason we also consider pseudo-isothermal models (equation 5) both as a single component and in combination with a steeper central density profile dark matter component. The best-fit models have flatter temperature profiles at large radii (Figure 8), but similar properties to the models inside of the observed region under consideration here.
4.5 Summary of Mass Models, Robust Features
To summarize, we have considered mass models (in order of increasing number of parameters) (1) with one dark matter component and , (2) with one dark matter component and freely varying , (3) with two dark matter components and , and (4) with two dark matter components and freely varying . The dark matter models have inner density slopes of 0, 1, 1.5, or 2 and an outer slope of 3; or an inner slope of 0 and an outer slope of 2 (“pseudo-isothermal”). For models with two dark matter components, one is assumed to have inner slope 0 and the other . Of these models, only those with fixed at 8 and (even more strongly) those where the dark matter component has inner slope 2 are clearly ruled out – and ruled out by the Chandra temperature profile alone. The two-component models provide formally better fits to the observed temperature profile; we consider this an indication that a more complex dark matter distribution best explains the data rather than as evidence of a true two-component dark matter configuration (although this is possible). The derived integrated mass distribution on pc scales is nearly model-independent (more so for the two-component models), but the dark/luminous matter breakdown is less robust.
ranges from 2.4–4.0 (2.4–6.6) for acceptable best-fit two-component (all acceptable best-fit) models. is much more narrowly proscribed, ranging from 6.5–6.7 (6.5–7.0), 14.0–14.3 (13.6–14.4), and 45.6–47.0 (44.8–47.5), at , , and , respectively (using kpc). The dark matter fraction is within and within for acceptable best-fit two-component models. The similarity of the radius where dark matter starts to dominate and the stellar scale-length is the elliptical galaxy counterpart to the “disk-halo conspiracy” and may be due to feedback on the dark matter distribution from the luminous matter as it evolves on a dynamical timescale (Lia, Carraro, & Salucci, 2000).
The average dark matter density within (233 pc) is 5.4 M⊙ pc-3 for the best-fit two-component model with inner dark matter exponent , and 16 M⊙ pc-3 for , 0.18 M⊙ pc-3 for the best-fit single-component models with cores, and 0.06–0.09 M⊙ pc-3 for the best-fit cored single-component models with fixed at 8.
5 Discussion
We compare our constraints on the dark matter distribution in NGC 4636 with theoretical expectations, results from gravitational lensing studies, and observational results for other types of galaxies.
5.1 The Dark Matter Distribution in NGC 4636
5.1.1 Comparison with CDM Simulations
As our emphasis is on the luminous region of NGC 4636, we do not constrain the dark matter density slope at very large radii, although we present successful models with dark matter density declining both as and for large . Note that the scale lengths for many of the successful models are comparable to the outermost region that we consider and the dark matter density slopes are, on average, shallower than on the galaxy scale.
Our derived constraints on the dark matter distribution are consistent with the unmodified predictions of CDM numerical simulations. For the purpose of comparison, let us consider our best-fit two-component models (qualitatively, the discussion does not depend on this). The best-fit halos have virial radii and masses (for an overdensity, with respect to the critical density assuming km s-1 Mpc-1, of as appropriate for a , cosmology) of kpc and M⊙, respectively (these values are robust provided the dark matter density declines as at large ; larger values are implied if the slope is flatter). The asymptotic stellar visual luminosity is LV⊙, corresponding to a total stellar mass of M⊙, with values at the lower end of this range favored by the stellar mass-to-light ratios in our best-fit models. In addition, the total mass in hot gas out to kpc is M⊙ (Matsushita et al. 1998, adjusting for our different assumed distance). Thus, the baryon fraction is – about half the value derived from Big Bang cosmology for km s-1 and . This is not surprising – elliptical galaxies are expected to lose much of their initial baryonic content in proto-galactic outflows (e.g., Loewenstein & Mushotzky 1996). The virial temperature corresponding to this dark matter virial mass, 0.3 keV, is well below that measured in NGC 4636.
The dark halo concentration can be characterized by a number of non-parametric quantities. One such measure is , the ratio of the virial radius to the radius enclosing one-fifth the virial mass. We derive values , more concentrated than the average predicted by numerical simulations, but within the considerable scatter theoretically predicted at this mass scale (Avila-Reese et al. 1999, Wechsler et al. 2002).
The non-parametric central dark matter density parameter defined by Alam, Bullock, & Weinberg (2002) – the density, in units of the critical density, evaluated at the radius where the dark matter circular velocity drops to half of its maximum value (400–450 km s-1 in NGC 4636) – can be used to compare the central regions of halos of different mass with each other and with theoretical expectations. The values for our models are displayed in Table 3. For our models with freely varying mass-to-light ratio, – greater than the average predicted in standard -CDM scenarios (Alam, et al., 2002) or estimated in less luminous, dark matter dominated galaxies (hereafter DMDGs). Likewise, ( kpc) is correspondingly smaller.
By comparing to dark-matter-only simulations, we ignore the effects of interaction between the baryonic and non-baryonic components. The evolution of the dissipational, baryonic component may result in contraction of the dark matter caused by infall-induced compression (Ryden, 1991; Kochanek & White, 2001) or, alternatively, to expansion via outflow (Binney, Gerhard, & Silk 2001; but, see Gnedin & Zhao 2002) or energy transfer via dynamical friction (El-Zant, Shlosman, & Hoffman, 2001). In fact both kinds of processes are expected, and could effectively cancel each other out (Lia et al. 2000). The evolution of binary black holes following a merger could also reduce the central dark matter density (Milosavljevic et al., 2002); but only on a scale corresponding to the stellar break radius ( pc for NGC 4636), and would need to be followed by an additional mechanism (starburst-induced outflow following the merger?) to effect the dark matter on scales relevant to our measurements. Further evaluation of the NGC 4636 mass profile in this context awaits more comprehensive theoretical treatment.
5.1.2 Connection with Gravitational Lensing Surveys
There are a number of statistical studies of the observational effects of gravitational lensing by elliptical galaxies. For simplicity, most of these (e.g., Kochanek 1994, McKay et al. 2002) approximate the total galaxy potential as arising from a singular isothermal sphere (SIS), and steep () mass profiles are indicated by the distribution of image separations (Asano, 2000; Porciani & Madau, 2000; Kochanek & White, 2001; Cohn et al., 2001; Li & Ostriker, 2002) and the absence of detectable odd images (Rusin & Ma, 2001), and consistent with galaxy-galaxy lensing statistics (Brainerd, Blandford, & Smail, 1996; Smith et al., 2001a; Wilson et al., 2001) and gravitational time delay measurements (e.g., Kochanek 2002). In NGC 4636, the dark matter density profile is shallower than inside 10 kpc. Figure 9 compares the best-fit two-component – – model with an SIS of identical virial mass ( km s-1). The total mass distribution, while poorly matching the stellar distribution in shape, does not strongly deviate from a comparable isothermal sphere for kpc (in the region at which it is best-constrained, ), but flattens from 1 kpc into 100 pc where the nuclear black hole starts to dominate the total mass. Chiba & Yoshii (1999) assume that the mass profile in elliptical galaxies turns over at about this radius and find good agreement with the numbers and separations of lenses for a low-density universe with a cosmological constant . Since the stellar density profiles in galaxies less luminous than that dominate the lensing signal in statistical studies tend to be considerably steeper than for a galaxy as luminous as NGC 4636 (Faber et al., 1997), an SIS model may be an adequate representation of the mean mass distribution for some purposes; however, more realistic composite models are clearly preferable – e.g., distributions would imply % higher values of the Hubble constant for a given gravitational time delay measurement (Kochanek, 2002). Note that, for NGC 4636, the ratio of equivalent SIS velocity dispersion to central stellar velocity dispersion is greater than derived assuming a pure isothermal sphere, though less than the original assumed value of (Kochanek, 1994).
Keeton (2001) does, in fact, consider composite (starhalo) mass models with adiabatic contraction (see, also, Porciani & Madau 2000; Kochanek & White 2001; Jimenez, Verde, & Oh 2002; Seljak 2002) and, from strong gravitational lens statistics, infers a dark matter fraction within of about one-third for the average elliptical galaxy, compared to 0.7–0.8 in our best-fit two-component models, 0.5 for the best-fit one-component model with dark matter core, and 0.4 for the less-well-fitting fixed mass-to-light () model. Evidently, NGC 4636 is an unusually dark matter dominated galaxy (see below; Wilson et al. 2001), which implies a cosmic variance in the baryonic/non-baryonic ratio (at least within the optically visible part of the galaxy; see, also, Kronawitter et al. 2000) that may be either fundamental, or a result of variations in the magnitude of baryon-driven reshaping of dark matter halos or of baryonic mass loss.
5.2 Implications for Self-Interacting Dark Matter and Other Alternative Models
As discussed above, the dark matter distribution in NGC 4636 is not as concentrated as the stars or as a singular isothermal sphere, but is consistent with the results of CDM halo formation simulations, unaltered by subsequent coupling to the contraction or expansion of the baryonic component. This seems not to be the case for many other types of galaxy.
Possible conflicts between CDM predictions and observations of central dark matter densities were first pointed out by Moore (1994), Flores & Primack (1994), and Burkert (1995) for dwarf spiral galaxies. More recent work revealed further evidence of this discrepancy based on rotation curves of low-surface brightness and dwarf irregular galaxies (Moore et al., 1999; Côté, Carignan, & Freeman, 2000; de Blok, McGaugh, & Rubin, 2001; Marchesini et al., 2002). Claims that inner rotation curves or the zero-point of the Tully-Fisher relation imply that dark matter is less concentrated than predicted were made for spiral galaxies (Blais-Ouellette, Amram, & Carignan, 2001; Borriello & Salucci, 2001), including the Milky Way (Navarro & Steinmetz, 2000a; Binney & Evans, 2001). It is notable, however, that contradictory conclusions were reached, even for low-surface brightness (van den Bosch et al., 2000; Jimenez et al., 2002) and dwarf (van den Bosch & Swaters, 2001) galaxies that are dark matter dominated at all radii, as well as for the Milky Way (Klypin, Zhao, & Somerville, 2002) and other disk galaxies (Jimenez et al., 2002).
Estimates of the central dark matter density in DMDGs (Kravtsov et al. 1998, Côté et al. 2000, Firmani et al. 2001b, de Blok et al. 2001, Marchesini et al. 2002), as well as spiral (Blais-Ouellette et al. 2001, Borriello, & Salucci 2001; but, see Klypin et al. 2002) galaxies cluster around 0.02 M⊙ pc-3, albeit with a large scatter. These are based on fitting models with flat dark matter density cores; fitted core radii are kpc. Similar central densities were inferred for clusters of galaxies (Wu & Xue, 2000; Arabadjis, Bautz, & Garmire, 2002); although, it is less clear whether dark matter distributions that are less concentrated than predicted by CDM are implied (Arabadjis et al. 2002), since dark matter is expected to be more diffusely distributed on cluster, than on galaxy, mass scales. Moreover, density cusps in clusters may be required to explain their lensing properties (Smith et al. 2001b, Molikawa & Hattori 2001; Wyithe, Turner, & Spergel 2001).
A giant elliptical galaxy (virial mass M⊙), NGC 4636 can bridge the gap in mass scale between previously studied galaxies ( M⊙ for DMDGs, M⊙ for spirals) and clusters ( M. Since unlike clusters and DMDGs, ellipticals are dominated by baryons in their nuclei, the inferred dark matter density is model dependent. For the best-fit two-component models presented above, the average dark matter density (that is roughly equal to the local density) within the innermost measured Chandra temperature (corresponding to the effective resolution of our mass determination) is M⊙ pc-3 (Figure 6a) – about two orders of magnitude larger than is typical in the other types of galaxies discussed above. The maximum values in our acceptable models extend a further factor of two higher. For the best-fit models with a dark matter core the central density is about an order of magnitude lower at M⊙ pc-3 (representing % of the total density); the corresponding value if is reduced by a further factor of two. This conflict between the central dark matter density in NGC 4636 and the surprisingly low values previously found for other galaxy types is robust, provided we maintain the reasonable assumptions that the dark matter density profile monotonically decreases outward, and the stellar mass-to-light ratio does not steeply decline with radius.
5.2.1 Self-Interacting Dark Matter
If cold dark matter is self-interacting (SIDM), an initially cuspy density distribution with its positive velocity dispersion gradient may develop a core. Spergel & Steinhardt (2000), and others, proposed SIDM as a possible explanation for previously measured low central dark matter density cores. For a core to form in a Hubble time in a DMDG, the specific cross section, , must be sufficiently high for several collision times to elapse (e.g., Davé et al. 2001). This lower limit is cm2 GeV-1 for the typical density of 0.02 M⊙ pc-3. If the cross section cm2 GeV-1, energy transfer to the outer regions will result in core collapse for an isolated halo (Moore et al., 2000), although dynamical heating from continual infall may forestall this.
The nature of the dark matter particle interactions may be such that either or constant with is possible at the energies of interest, where is the mean dark matter particle velocity (Hui 2001, Hennawi & Ostriker 2002). If clusters of galaxies also have dark matter cores of comparable central density (Wu & Xue 2000, Arabadjis et al. 2002), a dependence is required for a single SIDM particle to account for both (D’Onghia, Firmani, & Chincarini 2002; Yoshida et al. 2001; Miralda-Escudé 2002). For , with km s-1, cm2 GeV-1 is required (D’Onghia et al., 2002; Davé et al., 2001), although Arabadjis et al. (2002) derive an upper limit that is an order of magnitude lower.
Isothermal cores scale such that , where , , and () are the central density, core radius and velocity dispersion, respectively. Thus, clusters are expected to have larger cores than DMDGs, consistent with fitting cored models to X-ray observations (Wu & Xue 2000, Arabadjis et al. 2002). Since our fits for models with cores have the central density of DMDGs at a velocity scale several times higher, core radii are expected to be of the same order. We, indeed, find this to be the case: the core radius is 4.5 kpc for the best-fit pseudo-isothermal model, 12 kpc for the cored model with asymptotic slope. However the higher density and velocity imply that the SIDM particles in ellipticals undergo an order of magnitude (or more if is constant with ) greater number of collisions than in DMDGs of comparable age. Whether this would induce core collapse must be addressed by realistic galaxy formation simulations that account for energy input from mergers and infall (note that the dark matter in NGC 4636 does not have the form characteristic of cores that undergo dynamical collapse; Burkert 2000, Kochanek & White 2000).
Simulations with SIDM performed to date (Davé et al., 2001; D’Onghia et al., 2002) are consistent with the scaling proposed by Miralda-Escudé (2002) that essentially assumes a narrow range in the total number (on the order of a few) of collisions. For, , this implies
| (9) |
and
| (10) |
where is the age of the dark matter halo. Thus (assuming ), is expected to be of the same order or smaller for elliptical galaxies compared to DMDGs and spirals, contrary to our models with dark matter cores.
This leads us to consider interpreting our best-fit models where the inner dark matter density is cuspy, in the context of SIDM models, as dark matter cores that subsequently develop cusps as a result of adiabatic contraction during the collapse of the baryonic component. The central phase space density in NGC 4636 for these models, derived from solving the Jeans equation for the dark matter, is M⊙ pc-3 (km/sec)-3 (and rising) at the innermost (X-ray) observed radius of 700 pc. This is well above the SIDM predictions found by Davé et al. (2001) to be consistent with the scaling expected from a “quiet” non-dissipational merging hierarchy (Dalcanton & Hogan 2001; see, also, Madsen 2001). Since is conserved in adiabatic contraction, this explanation fails.
To summarize, the central density in models of the mass distribution in NGC 4636 with dark matter cores are higher than expected if all galaxies develop cores due to dark matter self-interaction. If the SIDM cross section, and its velocity dependence, are such that it reduces the dark matter concentration only on mass scales well below that of NGC 4636 then galaxy clusters are also unaffected. Moreover, this is inconsistent with expectations of the galaxy formation merging hierarchy unless these cores form rather late. Therefore, the NGC 4636 data do not support SIDM models for any cross section velocity dependence.
5.2.2 Warm Dark Matter
The menagerie of other proposed alternative dark matter candidates includes warm dark matter (Hogan & Dalcanton, 2000; Colín, Avila-Reese, & Valenzuela, 2000; Eke, Navarro, & Steinmetz, 2001; Bode, Ostriker, & Turok, 2001; Avila-Reese et al., 2001; Dalcanton & Hogan, 2001; Alam, et al., 2002), self-interacting scalar fields (Peebles, 2000; Riotto & Tkachev, 2000), annihilating dark matter (Kaplinghat, Knox, & Turner, 2000), decaying dark matter (Cen, 2001), fuzzy cold dark matter (Hu, Barkana, & Gruzinov, 2000), repulsive dark matter (Goodman, 2000), and mirror matter (Mohapatra, Nussinov, & Teplitz, 2002). Our limit on the central dark matter density in NGC 4636, and conclusion that if the dark matter mass distribution does have a core it is of the same order as in the much less massive DMDGs rule out a number of models, e.g. those that predict a universal central density (e.g., annihilating dark matter as in Kaplinghat et al. 2000), a self-similar reduction in concentration (e.g., decaying dark matter as in Cen 2001), or a dark matter core radius that decreases with mass (annihilating dark matter as in Craig and Davis 2001, fuzzy cold dark matter as in Hu et al. 2000).
The most fully developed of these other alternatives is warm dark matter (WDM); however, phase-space constraints must be considered. As summarized above, the central dark matter phase space density , for a merging hierarchy of equilibrium systems, should scale as (Dalcanton & Hogan, 2001). The warm dark matter particle mass, (if fermionic) sets a maximum attainable value M⊙ pc-3 (km/sec)-3. Since a mass keV is consistent with the value of inferred for dwarf spheroidal galaxies (Hogan & Dalcanton, 2000; Lokas, 2002), these may be identified with the initial seeds in the merging hierarchy and provide the normalization for the phase space scaling. Once again, NGC 4636 is in conflict with the expected scaling.
For our models with dark matter cores, the phase space density is acceptable but the core density (radius) too high (low): as with SIDM, constant (or decreasing) central dark matter density with mass is expected. For our models with dark matter cusps, the central dark matter phase space density is too high. However, while Dalcanton & Hogan (2001) argue that the phase space scaling holds even if the smallest galaxies are not themselves part of the merging hierarchy, there may be a fundamental difference in the cosmogony of galaxies above and below the WDM filtering mass M⊙ (Avila-Reese et al. 2001; Bode et al. 2001) that might lead one to expect that the decrease in concentration compared to CDM models should apply only to these low mass systems. Thus WDM remains a viable alternative from an astrophysical perspective.
5.2.3 The Initial Perturbation Spectrum
While WDM introduces an effective change in the proto-galactic fluctuation spectrum, other more fundamental departures from standard CDM are possible. A tilted cold dark matter spectrum with shape determined by Lyman forest data leads to reduced central dark matter densities on all mass scales (Alam, et al., 2002). The predictions of this model that at elliptical galaxy scales is not consistent with our constraints on NGC 4636. Other models that propose reducing the amount of small-scale power (e.g., Kamionkowski & Liddle 2000) may similarly suffer.
5.2.4 Explosive Feedback
Dark matter cusps in dwarf spiral and low surface galaxies can be erased by coupled expansion to a sufficiently powerful starburst-driven baryonic outflow (Navarro, Eke, & Frenk, 1996; Gelato & Sommer-Larson, 1999; van den Bosch et al., 2000; Binney, Gerhard, & Silk, 2001). For a constant energy input per stellar mass, this introduces a natural mass scale delineating systems where this mechanism reduces the dark matter concentration from those where it is ineffective in doing so. If the feedback efficiency is tuned to reproduce the Tully-Fisher relation for disk galaxies, dwarf galaxies are expected to have dark matter cores. Cores in disk galaxies are more problematic (Navarro & Steinmetz, 2000b; van den Bosch et al., 2000); while giant elliptical galaxy dark matter distributions would be relatively unaffected as indicated by the constraints presented here. These calculations implicitly assume that the feedback occurs after assembly of the dark halo; the conclusions may differ if the same feedback operating in dwarf galaxies also occurs in proto-galactic fragments that eventually merge to form ellipticals.
5.3 Stellar Kinematics, the Stellar Mass-to-Light Ratio, and the Dark Matter Fraction
Published measurements of the central stellar line-of-sight velocity dispersion in NGC 4636 mostly range from km s-1 (McElroy, 1995; Caon, Macchetto, & Pastoriza, 2000), values we find consistent with solutions of the Jeans equation for the stars that include the mass models discussed above. The velocity dispersion profile is measured only as far out as (; Bender et al. 1994, Caon et al. 2000) and is roughly constant, except perhaps for a rise inside a kinematically decoupled core (; Caon et al. 2000). Evidence for dark matter within based on stellar kinematics was presented by Katz & Richstone (1985) (using data in Davies 1985) and, more recently, by Saglia, Bertin, & Stiavelli (1992) and Kronawitter et al. (2000). Kronawitter et al. (2000) infer (after adjustment for bandpass and distance) at , compared to in our best-fit models (where ).
Gerhard et al. (2001) restrict their consideration to the properties of minimal dark halo models, as their central mass-to-light ratios are generally consistent with those inferred from the stellar population, assuming a local Galaxy initial mass function as described by Kroupa (2001). Their mass models, that assume a logarithmic dark matter potential with a core, more closely resemble the one component models described above (especially that with fixed at 8) than the models that best describe the X-ray data. NGC 4636 may be exceptionally dark matter dominated inside (or, alternatively, have an exceptionally high magnetic pressure; Brighenti & Mathews 1997); however, a comparison of elliptical galaxy central dynamical mass-to-light ratios with the recent estimates of Kauffmann et al. (2002) suggest that dark matter may generally be more significant at all radii than usually presumed (see, also, Seljak 2002). The value of estimated by Gerhard et al. (2001) based on the stellar population is significantly less than the dynamically inferred total ratio. Since a two-component dark matter model with and fixed at 5.4 is only marginally less acceptable than the best-fit two-component model (Table 2), the mass distribution is consistent with the stellar population. NGC 4636 is an outlier from the average relationships presented in Loewenstein & White (1999) – the ratio of central stellar to global gas temperatures () of 0.34 is indicative of an exceptionally dominant (within ) dark halo (see, also, Brighenti & Mathews 1997); and, the upper limit on the baryon fraction (§5.1.1) is lower than may be typical (Guzik & Seljak, 2002). Interestingly, NGC 4636 also lies in the mass loss part of structural parameter () space (Bender, Burstein, & Faber, 1992), which also may indicate a low baryon fraction. A more integrated joint analysis of the X-ray and optical data that considers dark matter distributions with and without cores, and relaxes the assumption that stars dominate the total mass at small radii, could prove illuminating, perhaps shedding light on the apparently kinematically decoupled core (Caon et al. 2000) and eliminating the need for an anomalously tangential velocity dispersion ellipsoid (Kronawitter et al., 2000). More extended optical spectroscopy is clearly desirable, as well. Finally, we note that if some of the dark matter is baryonic, then it must be distributed in a less concentrated manner than the starlight – unlike what might be expected for stellar remnants.
6 Summary and Concluding Remarks
We have constructed mass models of the elliptical galaxy NGC 4636 based primarily on the density and temperature distributions of the hot gas measured with the Chandra X-ray Observatory and the stellar light density distribution measured in the optical. Secondary, observational inputs are the XMM-Newton/ASCA X-ray temperature profile and the stellar velocity dispersion profile. We derive accurate constraints on the total mass distribution from 0.7–35 kpc. The total mass increases as to a good approximation over this range in radii, attaining a total of M⊙ (corresponding to , Figure 3) at the outermost point we consider.
Of the models we investigate, the temperature profile is most accurately fit using a dark matter distribution that consists of two-components – one with a flat core and one of the generalized NFW form with a cusp (equation 4). We consider this an indication that the dark matter distribution may be more complex than a single component following equation (4). There is no unique mass decomposition into luminous and dark matter components (see Figures 5 and 7); steeper assumed values of the central dark matter density slope () imply lower stellar mass-to-light ratios (such a degeneracy exists even for dark matter dominated dwarf galaxies; van den Bosch & Swaters 2001). However, constant mass-to-light models and models with are too steep, and are ruled out by the Chandra data. is indicated from fitting models with dark matter cores, and models with – consistent with the stellar population in NGC 4636 – are favored. While a wide range of central dark matter densities and dark-to-luminous mass ratios are allowed (Figure 4 and 6), all of these are sufficiently restrictive so as to have important implications. The mass profile significantly departs from that of the light inside a few kpc (i.e. the half-light radius ). The dark matter fraction is within , and therefore on the high concentration end of expectations for CDM halo formation models. Moreover, the central dark matter density is at least an order of magnitude – and possibly more than two orders of magnitude (at M⊙ pc-3, based on the best-fit two-component models) – greater than reported as typical for a variety of spiral and less luminous, dark matter dominated galaxies.
Non-parametric measures of the dark matter central density also indicate that dark matter in NGC 4636 is more concentrated than average for a standard CDM halo, though within the scatter. Thus, the effects of adiabatic contraction and expansion via explosive feedback are negligible, effectively cancel each other out, or operate on a halo that initially differs from those computed for CDM halos.
The dark matter distribution in NGC 4636 is at odds with many alternative models designed to explain low central densities in galaxies of other Hubble type. It is instructive to consider two classes of models from this perspective – those with flat dark matter cores, and those with cuspy dark matter cores (that provide better fits to the X-ray data) interpreted as contracting from initially flat cores due to baryonic infall. For the flat-core models, the high central dark matter mass density and large cores are contrary to the expected scaling relations for self-interacting dark matter and other models where dark matter structure is driven by dark matter particle interaction. For the cuspy-core models, the central phase-space density, conserved during adiabatic contraction, is too high. Models where the flattening of dark matter cores occurs only at relatively low mass scales (perhaps, at the low surface brightness galaxy scale; van den Bosch et al. 2000) – including some involving explosive feedback and warm dark matter – remain most viable. If this transitional mass is indeed on the giant elliptical galaxy scale (or below), cuspy dark matter distributions in galaxy clusters are implied. If the results for dark matter dominated, low mass galaxies are correct, there is a reversal from the trend naively expected from a standard bottom-up hierarchy where less massive objects collapse earlier in a more dense universe and retain that higher density.
Perhaps some modification to the standard CDM scenario is required. It should be noted, however, that considerable scatter in dark matter concentration is predicted for a given mass range – particularly on galaxy scales. Moreover, this scatter is not purely random, but represents the effects of variations in age and assembly history (Wechsler et al., 2002). This introduces a bias such that galaxies of the types where low central dark matter densities are derived may represent relatively recently formed systems, and/or particularly fragile galaxies that have experienced relatively tranquil assembly histories. Conversely, giant elliptical galaxies such as, or perhaps particularly, NGC 4636 may have the highest formation redshifts and the most prominent merger histories.
Gravitational lensing probabilities are sensitive to the inner total mass density slope (Wright & Brainerd, 2000; Bartelmann, King, & Schneider, 2001; Takahashi & Chiba, 2002; Wyithe et al., 2001; Oguri, Taruya, & Suto, 2001; Li & Ostriker, 2002), and explainable if the total mass in clusters follows an NFW profile and that in elliptical galaxies a singular isothermal sphere profile (Li & Ostriker, 2002). This is consistent with our results, once one takes into account the stellar contribution. If one is to use lensing statistics to constrain cosmological parameters, the correct composite mass model – derived empirically as we do here – should be used. Moreover, these studies assume a constant dark matter distribution for galaxies of a given optical luminosity, while our results indicate the likelihood of a significant cosmic variance.
In fact, we suggest that NGC 4636 is an exceptionally dark matter dominated elliptical galaxy, a consequence of a low global baryon fraction or a high concentration of dark, relative to luminous, matter. Although one must therefore exercise caution in generalizing from our results, the most stringent constraints on alternative models for dark halo structure, that presumably universally apply, emerge. Results, in progress, of similar investigations for other galaxies (e.g., NGC 1399, NGC 4472) are anticipated with great interest.
References
- Alam, et al. (2002) Alam, S. M. K., Bullock, J. S., & Weinberg, D. H. 2002, ApJ, submitted
- Angelini, Loewenstein, & Mushotzky (2001) Angelini, L., Loewenstein, M. & Mushotzky, R. F. 2001, ApJ, 557, L35
- Arabadjis, Bautz, & Garmire (2002) Arabadjis, J. S., Bautz, M. W., & Garmire, G. P. 2002, ApJ, in press
- Asano (2000) Asano, K. 2000, PASJ, 52, 99
- Avila-Reese et al. (2001) Avila-Reese, V., Coliín, P., Valenzuela O., D’Onghia, E., & Firmani, C. 2001, ApJ, 559, 516
- Avila-Reese et al. (1999) Avila-Reese, V., Firmani, C., Klypin, A., & Kravtsov, A. V. 1999, MNRAS, 310, 527
- Baes & Dejonghe (2002) Baes, M., & Dejonghe, H. 2002, ApJ, in press
- Bartelmann, King, & Schneider (2001) Bartelmann, M., King, L. J., & Schneider, P. 2001, A&A, 378, 361
- Bender, Burstein, & Faber (1992) Bender, R., Burstein, D., & Faber, S. M. 1992, ApJ, 399, 462
- Bender, Saglia, & Gerhard (1994) Bender, R., Saglia, R. P., & Gerhard, O. E. 1994, MNRAS, 269,785
- Bertola et al. (1993) Bertola, F., Pizzella, A., Persic, M., & Salucci, P. 1993, ApJ, 416, L45
- Binney & Evans (2001) Binney, J. J., & Evans, N. W. 2001, MNRAS, 327, L27
- Binney, Gerhard, & Silk (2001) Binney, J., Gerhard, O., & Silk, J. 2001, MNRAS, 321, 471
- Blais-Ouellette, Amram, & Carignan (2001) Blais-Ouellette, S., Amram, P., & Carignan, C. 2001, AJ, 121, 1952
- Bode, Ostriker, & Turok (2001) Bode, P., Ostriker, J. P., & Turok, N. 2001, ApJ, 556, 93
- Borriello & Salucci (2001) Borriello, A., & Salucci, P. 2001, MNRAS, 323, 285
- Brainerd, Blandford, & Smail (1996) Brainerd, T. G., Blandford, R. D., & Smail, I. 1996, ApJ, 466, 623
- Brighenti & Mathews (1997) Brighenti, F., & Mathews, W. G. 1997, ApJ, 486, L83
- Burkert (1995) Burkert, A. 1995, ApJ, 447, L25
- Burkert (2000) Burkert, A. 2000, ApJ, 534, L143
- Burkert & Silk (1997) Burkert, A., & Silk, J. 1997, ApJ, 488, L55
- Caon, Capaccioli, & D’Onofrio (1993) Caon, N., Capaccioli, M., & D’Onofrio, M. 1993, MNRAS, 265, 1013
- Caon, Macchetto, & Pastoriza (2000) Caon, N., Macchetto, D. & Pastoriza, M. 2000, ApJS, 127, 39
- Cen (2001) Cen, R. 2001, ApJ, 546, L77
- Chiba & Yoshii (1999) Chiba, M., & Yoshii, M. 1999, ApJ, 510, 42
- Cohn et al. (2001) Cohn, J. D., Kochanek, C. S., McLeod, B. A., & Keeton, C. R. 2001, ApJ, 554, 1216
- Colín, Avila-Reese, & Valenzuela (2000) Colín, P., Avila-Reese, V., & Valenzuela O. 2000, ApJ, 542, 622
- Côté, Carignan, & Freeman (2000) Côté, S., Carignan, C., & Freeman K. C. 2000, AJ, 120, 3027
- Craig & Davis (2001) Craig, M. W., & Davis, M. 2001, New Astronomy, 6, 425
- de Blok, McGaugh, & Rubin (2001) de Blok, W. J. G., McGaugh, S. S., & Rubin, V. C. 2001, AJ, 122, 2396
- D’Onghia et al. (2002) D’Onghia, E., Firmani, C., & Chincarini, G. 2002, MNRAS, submitted
- Dalcanton & Hogan (2001) Dalcanton, J., & Hogan, C. 2001, ApJ, 561, 35
- Davé et al. (2001) Davé, R., Spergel, D. N., Steinhardt, P. J., & Wandelt, B. D. 2001, ApJ, 547, 574
- Davies (1985) Davies, R. L. 1985, MNRAS, 194, 879
- Eke, Navarro, & Steinmetz (2001) Eke, V. R., Navarro, J. F., & Steinmetz, M. 2001, ApJ, 554, 114
- El-Zant, Shlosman, & Hoffman (2001) El-Zant, A., Shlosman, I., & Hoffman, Y. 2001, ApJ, 560, 636
- Faber et al. (1997) Faber, S. M., Tremaine, S., Ajhar, E. A., Byun, Y, Dressler, A., Gebhardt, K., Grillmair, C., Kormendy, J., Lauer, T. R., & Richstone, D. 1997, AJ, 114, 1771
- Firmani et al. (2000) Firmani, C., D’Onghia, E., Avila-Reese, V., Chincarini, G., & Hernández, X. 2000, MNRAS, 315, L29
- Firmani et al. (2001b) Firmani, C., D’Onghia, E., Chincarini, G., Hernández, X., & Avila-Reese, V. 2001b, MNRAS, 321, 713
- Flores & Primack (1994) Flores, R. A., & Primack, J. R. 1994, ApJ, 427, L1
- Fox & Pen (2001) Fox, D. C., & Pen, U.-L. 2001, ApJ, 546, 35
- Gelato & Sommer-Larson (1999) Gelato, S., & Sommer-Larson, J. 1999, MNRAS, 303, 321
- Gerhard et al. (2001) Gerhard, O., Kronawitter, A., Saglia, R. P., & Bender, R. 2001, AJ, 121, 1936
- Ghigna et al. (2000) Ghigna, S.; Moore, B., Governato, F., Lake, G., Quinn, T., & Stadel, J. 2000, ApJ, 544, 616
- Gnedin & Zhao (2002) Gnedin O., & Zhao, H. 2002, MNRAS, in press
- Goodman (2000) Goodman, J. 2000, New Astronomy, 5, 103
- Guzik & Seljak (2002) Guzik, J., & Seljak, U. 2002, MNRAS, submitted
- Hennawi & Ostriker (2002) Hennawi, J. F., & Ostriker, J. P. 2002, ApJ, submitted
- Hogan & Dalcanton (2000) Hogan, C., & Dalcanton, J. 2000, Phys. Rev. D, D62, 817
- Hu, Barkana, & Gruzinov (2000) Hu, W., Barkana, R., & Gruzinov, A. 2000, Phys. Rev. Lett., 85, 1158
- Hui (2001) Hui, L. 2001, Phys. Rev. Lett., 86, 3467
- Jimenez et al. (2002) Jimenez, R., Verde, L., & Oh, S. P. 2002, MNRAS, submitted
- Jones et al. (2001) Jones, C., Forman, W., Vikhlinin, A., Markevitch, M., David, L., Warmflash, A., Murray, S., Nulsen, P. E. J. 2002, ApJ, 567, L115
- Kamionkowski & Liddle (2000) Kamionkowski. M., & Liddle, A. R. 2000, Phys. Rev. Lett., 84, 4525
- Kaplinghat, Knox, & Turner (2000) Kaplinghat, M., Knox, L., & Turner, M. 2000, Phys. Rev. Lett., 85, 3335
- Katz & Richstone (1985) Katz, N., & Richstone, D. O. 1985, ApJ, 296, 331
- Kauffmann et al. (2002) Kauffmann, G., et al. 2002, MNRAS, submitted
- Keeton (2001) Keeton, C. R. 2001, ApJ, 561, 46
- Klypin, Zhao, & Somerville (2002) Klypin, A., Zhao, H., & Somerville, R. S. 2002, ApJ, submitted
- Kochanek (1994) Kochanek, C. 1994, ApJ, 436, 56
- Kochanek (2002) Kochanek, C. 2002, ApJ, submitted
- Kochanek & White (2000) Kochanek, C. S., & White, M. 2000, ApJ, 543, 514
- Kochanek & White (2001) Kochanek, C. S., & White, M. 2001, ApJ, 559, 531
- Kravtsov et al. (1998) Kravtsov, A. V., Klypin, A. A., Bullock, J. S., Primack, J. R. 1998, ApJ, 502, 48
- Kronawitter et al. (2000) Kronawitter, A., Saglia, R. P., Gerhard, O., & Bender, R. 2000, A&AS, 144, 53
- Kroupa (2001) Kroupa, P. 2001, MNRAS, 322, 231
- Li & Ostriker (2002) Li, L.-X., & Ostriker. J. 2001, ApJ, 566, 652
- Lia, Carraro, & Salucci (2000) Lia, C., Carraro, G., & Salucci, P. 2000, A&A, 360, 76
- Loewenstein (2000) Loewenstein, M. 2000, ApJ, 532, 17
- Loewenstein & Mathews (1987) Loewenstein, M., & Mathews, W. G. 1987, ApJ, 319, 614
- Loewenstein & Mushotzky (1996) Loewenstein, M., & Mushotzky, R. F. 1996, ApJ, 466, 695
- Loewenstein et al. (2001) Loewenstein, M., Mushotzky, R. F., Angelini, L., Arnaud, K. A., Quataert, E. 2001, ApJ, 555, L21
- Loewenstein & White (1999) Loewenstein, M., & White, R. E., III 1999, ApJ, 518, 50
- Lokas (2002) Lokas, E. L. 2002, MNRAS, in press
- Madsen (2001) Madsen, J. 2001, Phys. Rev. D, 64, 027301
- Magorrian & Ballantyne (2001) Magorrian, J., & Ballantyne, D. 2001, MNRAS, 322, 702
- Marchesini et al. (2002) Marchesini, D., D’Onghia, E., Chincarini, G., Firmani, C., Conconi, P., Molinari, E., & Zacchei, A. 2002, ApJ, submitted
- Matsushita (2001) Matsushita, K. 2001, ApJ, 547, 693
- Matsushita et al. (1998) Matsushita, K., Makishima, K., Ikebe, Y., Rokutanda, E., Yamasaki, N., Ohashi, T. 1998, ApJ, 499, L13
- McElroy (1995) McElroy, D. B. 1995, ApJS, 100, 105
- McKay et al. (2002) McKay, T. A., et al. 2002, ApJ, submitted
- McLaughlin (1999) McLaughlin, D. E. 1999, ApJ, 512, L9
- Merritt & Ferrarese (2001) Merritt, D., & Ferrarese, L. 2001, MNRAS, 320, L30
- Milosavljevic et al. (2002) Milosavljevic, M., Merritt, D., Rest, A., & van den Bosch, F. 2002, MNRAS, in press
- Miralda-Escudé (2002) Miralda-Escudé, J. 2002, ApJ, 564, 60
- Mohapatra, Nussinov, & Teplitz (2002) Mohapatra, R. N., Nussinov, S., & Teplitz, V. L. 2002, preprint
- Molikawa & Hattori (2001) Molikawa, K., & Hattori, M. 2001, ApJ, 559, 544
- Moore (1994) Moore, B. 1994, Nature, 370, 620
- Moore et al. (2000) Moore, B., Gelato, S., Jenkins, A., Pearce, F. R., & Quilis, V. 2000, ApJ, 532, L21
- Moore et al. (1999) Moore, B., Quinn, T., Governato, F., Stadel, J., & Lake, G. 1999, MNRAS, 310, 1147
- Mushotzky et al. (1994) Mushotzky, R. F., Loewenstein, M., Awaki, H., Makishima, K., Matsushita, K., & Matsumoto, H. 1994, ApJ, 436, L79
- Navarro, Eke, & Frenk (1996) Navarro, J. F., Eke, V. R., & Frenk, C. S. 1996, MNRAS, 283, L72
- Navarro, Frenk, & White (1997) Navarro, J. F., Frenk, C. S., & White, S. D. M. 1997, ApJ, 490, 493
- Navarro & Steinmetz (2000a) Navarro, J. F., & Steinmetz, M. 2000a, ApJ, 528, 607
- Navarro & Steinmetz (2000b) Navarro, J. F., & Steinmetz, M. 2000b, ApJ, 538, 477
- Oguri, Taruya, & Suto (2001) Oguri, M., Taruya, A., & Suto, Y. 2001, ApJ, 559, 572
- Peebles (2000) Peebles, P. J. E. 2000, ApJ, 534, L127
- Porciani & Madau (2000) Porciani, C., & Madau, P. 2000, ApJ, 532, 679
- Quillen, Bower, & Stritzinger (2000) Quillen, A. C., Bower, G. A., & Stritzinger, M. 2000, ApJS, 128, 85
- Ravindranath et al. (2001) Ravindranath, S., Ho, L. C., Peng, C. Y., Filippenko, A. V., Sargent, W. L. W. 2001, AJ, 122, 653
- Riotto & Tkachev (2000) Riotto, A., & Tkachev, I. 2000, Phys. Lett., B485, 177
- Rusin & Ma (2001) Rusin, D., & Ma, C.-P. 2001, ApJ, 549, L33
- Ryden (1991) Ryden, B. S. 1991, ApJ, 370, 15
- Saglia, Bertin, & Stiavelli (1992) Saglia, R. P., Bertin, G., & Stiavelli, M. 1992, ApJ, 384, 433
- Seljak (2002) Seljak, U. 2002, MNRAS, in press
- Silk (2002) Silk, J. 2002, preprint
- Smith et al. (2001a) Smith, D. R., Bernstein, G. M., Fischer, P., & Jarvis, M. 2001, ApJ, 551, 643
- Smith et al. (2001b) Smith, G. P., Kneib, J.-P., Ebeling, H., Czoske, O., & Smail, I. 2001, ApJ, 552, 493
- Smith et al. (2001c) Smith, R. K., Brickhouse, N. S., Liedahl, D. A., & Raymond, J. C. 2001, ApJ, 556, L91
- Spergel & Steinhardt (2000) Spergel, D. N., & Steinhardt, P. J. 2000, Phys. Rev. Lett., 84, 3760
- Takahashi & Chiba (2002) Takahashi, R., & Chiba, T. 2002, ApJ, in press
- Tonry et al. (2001) Tonry, J. L., Dressler, A., Blakeslee, J. P., Ajhar, E. A., Fletcher, A. B., Luppino, G. A., Metzger, M. R., & Moore, C. B. 2001, ApJ, 546, 681
- Trinchieri, Fabbiano, & Canizares (1986) Trinchieri, G., Fabbiano, G., & Canizares, C. R. 1986, ApJ, 310, 637
- Trinchieri et al. (1994) Trinchieri, G., Kim, D.-W., Fabbiano, G., & Canizares, C. R. 1994, ApJ, 428, 555
- van den Bosch et al. (2000) van den Bosch, F. C., Robertson, B. E., Dalcanton, J. J., & de Blok, W. J. G. 2000, AJ, 119, 1579
- van den Bosch & Swaters (2001) van den Bosch, F. C., & Swaters, R. A. 2001, MNRAS, 325, 1017
- Wechsler et al. (2002) Wechsler, R. H., Bullock, J. S., Primack, J. R., Kravtsov, A., & Dekel, A. 2002, ApJ, 568, 52
- Wilson et al. (2001) Wilson, G., Kaiser, N., Luppino, G. A., & Cowie, L. L. 2001, ApJ, 555, 572
- Wu & Xue (2000) Wu, X.-P., & Xue, Y.-J. 2000, ApJ, 542, 21
- Wright & Brainerd (2000) Wright, C. O., & Brainerd, T. G. 2000, ApJ, 534, 34
- Wyithe et al. (2001) Wyithe, J. S. B., Turner, E. L., & Spergel, D. N. 2001, ApJ, 555, 504
- Xu et al. (2002) Xu, H., Kahn, S. M., Peterson, J. R., Behar, E., Paerels, F. B. S., Mushotzky, R. F., Jernigan, J. G., & Makishima, K. 2002, ApJ, in press
- Yoshida et al. (2001) Yoshida, N., Springel, V., White, S. D. M., & Tormen, G. 2001, ApJ, 544, L87
- Zepf & Silk (1996) Zepf, S. E., & Silk, J. 1996, ApJ, 466, 114
| annulus | O | Fe | Si | |||
|---|---|---|---|---|---|---|
| 0.509 | 0.078 | 0.413 | 0.664 | 0.048 | 299/189 | |
| 0.578 | 0.173 | 0.64 | 0.76 | 0.033 | 229/178 | |
| 0.616 | 0.113 | 0.776 | 0.862 | 0.033 | 308/178 | |
| 0.68 | 0.02 | 0.84 | 1.127 | 0.056 | 359/171bbresiduals at 1.022 keV |
| aain kpc | bbevaluated at kpc | aain kpc | bbevaluated at kpc | ccrms deviation in eV | |||
|---|---|---|---|---|---|---|---|
| 1.0 | 32 | 7.6 | … | … | … | 5.5 | 10.6 |
| 1.5 | 55 | 13.7 | … | … | … | 3.2 | 9.2 |
| 2.0 | 780 | 18.8 | … | … | … | 1.5 | 201 |
| 0.0 | 12 | 6.2 | … | … | … | 6.6 | 17.2 |
| 0.0ddpseudo-isothermal model | 4.5 | 6.1 | … | … | … | 6.3 | 13.0 |
| 1.0 | 68 | 4.8 | … | … | … | 8.0eefixed | 48.6 |
| 0.0 | 17 | 5.1 | … | … | … | 8.0eefixed | 32.9 |
| 0.0ddpseudo-isothermal model | 7.5 | 4.7 | … | … | … | 8.0eefixed | 32.2 |
| 1.0 | 41 | 10.3 | 0.0 | 0.99 | 0.83 | 3.9 | 6.1 |
| 1.0 | 54 | 6.3 | 0.0 | 3.6 | 1.4 | 5.4eefixed | 8.3 |
| 1.5 | 74 | 12.8 | 0.0 | 2.2 | 0.77 | 3.2 | 8.2 |
| 2.0 | 6.6 | 0.01 | 0.0 | 12 | 6.2 | 6.6 | 17.4 |
| 1.0 | 44 | 10.3 | 0.0ddpseudo-isothermal model | 0.44 | 6.2 | 2.7 | 6.2 |
| 1.5 | 67 | 12.4 | 0.0ddpseudo-isothermal model | 0.85 | 2.3 | 3.0 | 7.5 |
| 2.0 | 29 | 0.01 | 0.0ddpseudo-isothermal model | 4.7 | 6.0 | 6.4 | 12.9 |
| 1.0 | … | 34 | 0.091 | 0.11 | 0.60 | 47 | |
| 1.5 | … | 36 | 0.49 | 0.12 | 0.77 | 47 | |
| 0.0 | … | 37 | 0.005 | 0.11 | 0.51 | 47 | |
| 0.0bbpseudo-isothermal model | … | 35 | 0.005 | 0.12 | 0.56 | 45 | |
| 1.0cc fixed at 8 | … | 45 | 0.037 | 0.11 | 0.40 | 47 | |
| 0.0cc fixed at 8 | … | 44 | 0.002 | 0.11 | 0.38 | 49 | |
| 0.0b,cb,cfootnotemark: | … | 44 | 0.002 | 0.11 | 0.39 | 46 | |
| 1.0 | 0.0 | 27 | 0.20 | 0.12 | 0.72 | 43 | |
| 1.0dd fixed at 5.4 | 0.0 | 32 | 0.064 | 0.11 | 0.62 | 41 | |
| 1.5 | 0.0 | 34 | 0.46 | 0.12 | 0.78 | 44 | |
| 1.0 | 0.0bbpseudo-isothermal model | 23 | 0.32 | 0.12 | 0.81 | 44 | |
| 1.5 | 0.0bbpseudo-isothermal model | 32 | 0.46 | 0.12 | 0.79 | 44 |