RELATIVE TIMING OF SOLAR FLARES OBSERVED AT DIFFERENT WAVELENGTHS
Abstract
The timing of 503 solar flares observed simultaneously in hard X-rays, soft X-rays and H is analyzed. We investigated the start and the peak time differences in different wavelengths, as well as the differences between the end of the hard X-ray emission and the maximum of the soft X-ray and H emission. In more than 90% of the analyzed events, a thermal preheating seen in soft X-rays is present prior to the impulsive flare phase. On average, the soft X-ray emission starts 3 min before the hard X-ray and the H emission. No correlation between the duration of the preheating phase and the importance of the subsequent flare is found. Furthermore, the duration of the preheating phase does not differ for impulsive and gradual flares. For at least half of the events, the end of the nonthermal emission coincides well with the maximum of the thermal emission, consistent with the beam-driven evaporation model. On the other hand, for 25% of the events there is strong evidence for prolonged evaporation beyond the end of the hard X-rays. For these events, the presence of an additional energy transport mechanism, most probably thermal conduction, seems to play an important role.
1 Introduction
In this paper we investigate the timing behavior of solar flares, observed simultaneously in hard X-ray (HXR), soft X-ray (SXR) and H emission. The main items we address are: a) the flare onset in different wavelengths, b) the timing of different flare emissions with respect to the electron-heated chromospheric evaporation model. Based on a sample of 503 solar flares observed simultaneously in HXR, SXR and H, we aim to determine how common is the preheating prior to the impulsive phase and is it different in different types of events. Furthermore, we will investigate whether the electron beam-driven evaporation model is consistent with the majority of solar flares, considering the predicted coincidence between the end of the nonthermal (HXR) and the maximum of the thermal (SXR and H) flare emission.
Electron beam-driven evaporation is usually supposed to be a dominant energy transport mechanism during solar flares. According to the thick-target model (Brown, 1971), the HXR emission is electron-ion bremsstrahlung produced by electron beams encountering the dense layers of the lower corona, the transition region, and the chromosphere. The model assumes that only a small fraction of the energy of the nonthermal electrons is lost through radiation; most of the energy is transferred to heating of the ambient plasma. Due to the rapid deposition of energy by the electron beams, the energy cannot be radiated away sufficiently fast. Thus, a strong pressure imbalance develops, and the heated plasma explosively expands up into the corona in a process known as chromospheric evaporation (Antonucci, Gabriel and Dennis, 1984; Fisher, Canfield and McClymont, 1985; Antonucci et al., 1999). The hot dense plasma that has been convected into the corona gives rise to enhanced soft SXR emission via thermal bremsstrahlung. Thus, the model predicts that the hard X-ray emission is directly related to the flux of the accelerated electrons, whereas the soft X-ray emission is related to the accumulated energy deposited by the same nonthermal electron population up to a given time.
However, the model is questioned by several authors. E.g., Simnett (1986) and Plunkett and Simnett (1994) proposed that protons accelerated at the energy release site, not electrons, are the primary energy carrier in solar flares (see also the review by Simnett, 1995). Another controversial issue is the role of thermal conduction versus electron beams (e.g., Doschek et al., 1989). Furthermore, it has been questioned (e.g., Feldman, 1990) whether chromospheric evaporation is a “real” phenomenon at all (see the reviews by Doschek et al., 1989; Antonucci et al., 1999).
From high time resolution observations it is known that during the impulsive phase, the fast time structures seen in H are correlated with the hard X-rays and microwaves (e.g., Kämpfer and Magun, 1983; Kurokawa, Takakura and Ohki, 1988; Wülser and Marti, 1989; Trottet et al., 2000). This suggests that nonthermal particle beams directly heat the chromospheric plasma, giving rise to the impulsive H emission. Numerical simulations of the chromospheric response to pulse beam heating on time scales of less than 1 s have been performed by Heinzel (1991). On the other hand, the H emission during the main phase of a flare is likely due to heating of the chromosphere by thermal conduction from the hot SXR emitting plasma in the flare loop (e.g., Phillips, 1991). Veronig et al. (2001) have shown that there is a distinct correlation between the SXR flux, , and the H area, , at the time of the flare maximum, close to the relation: . This means that the measured H area can be understood as an intersection at chromospheric level of the volume of evaporated plasma responsible for the enhanced SXR emission.
Under the assumption that exclusively accelerated electrons contribute to the evaporation and that the cooling time of the plasma is significantly longer than the impulsive HXR emission (see also Dennis, 1991), it is expected that the SXR as well as the H emission do not further increase after the HXR emission, i.e. the electron input, has stopped. In a previous paper (Veronig et al., 2002a), the timing of the SXR peak emission relative to the end of the HXR emission, has been investigated. In this study we additionally include H measurements as a further indicator of thermal flare emission. Considering H observations complementary to soft X-rays is of particular interest, since, as shown by McTiernan, Fisher and Li (1999), the temporal behavior of the SXR emission depends on the temperature response of the SXR detector used.
There are several papers that investigate the start of soft X-rays relative to hard X-rays. Kahler (1979) did not find systematic brightenings in soft X-rays before the impulsive flare phase. On the other hand, Machado, Orwig and Antonucci (1986) and Schmahl et al. (1989) reported frequent strong SXR emission before the impulsive phase. These authors have shown that, on average, the SXR emission precedes the onset of the HXR emission by 2 min. The fact that a gradual rise of SXR emission is present before the onset of the hard X-rays suggests a thermal origin of the first phase of a flare (e.g., Švestka, 1976; Schmahl et al., 1989). Such a gradual heating before the impulsive particle acceleration is supposed to be related to the re-arrangement of the magnetic fields preceding a flare. Furthermore, this initial phase may also determine the subsequent impulsive phase of the flare. For example, Emslie, Li and Mariska (1992) have shown that preheating of the flare atmosphere influences the subsequent evaporation process. We stress that this initial phase of the flare observed in soft X-rays has to be discriminated from SXR precursors, which occur several tens of minutes before the actual flare and not necessarily at the flare site. Furthermore, there is a distinct fall of intensity between the precursor event and the flare itself (e.g., Tappin 1991). In this paper we do not concentrate on SXR precursors, whose existence is still a controversial issue, but refer to the papers by Webb (1983), Tappin (1991), Fárník, Hudson and Watanabe (1996), and Fárník and Savy (1998).
Statistical studies of the timing behavior of solar flares observed at different wavelengths have been presented in several papers. However, in general only the emissions at two wavelengths are compared. Investigations on the timing of the SXR and H emission during a flare have been carried out by Thomas and Teske (1971), Datlowe, Hudson and Peterson (1974), Falciani et al. (1977), Zirin et al. (1981), Verma and Pande (1985a) and Veronig et al. (2002b). The reported results are quite contradictory. There is neither a consensus whether the SXR emission starts before the H emission or vice versa, nor in which succession the peaks occur. These conflicting results are presumably related to the fact that apart from the studies by Thomas and Teske (1971), Datlowe, Hudson and Peterson (1974) and Veronig et al. (2002b), rather small data sets have been used for the analysis, which may cause large statistical errors. A statistical study of the timing of the HXR emission relative to the H emission has been performed by Verma and Pande (1985b), finding that most impulsive flares produce HXR emission up to 1 min before and up to 2 min after the start of the H emission. For previous studies of the relative timing of the SXR and HXR flare emission we refer to Machado, Orwig and Antonucci (1986) and Schmahl et al. (1989), and references therein.
2 Data Selection
We utilize the SXR data from the Geostationary Operational Environmental Satellites (GOES), the HXR data observed by the Burst and Transient Source Experiment (BATSE) aboard the Compton Gamma-Ray Observatory (CGRO) and the H flare data collected by the Solar Geophysical Data (SGD). The X-ray sensor aboard GOES consists of two ion chamber detectors, which provide whole-sun X-ray flux measurements in the 0.5–4 and 1–8 Å wavelength bands. The GOES X-ray sensor is described in Donelly and Unzicker (1974) and Garcia (1994). BATSE is a whole-sky HXR flux monitor made up of eight large-area wide-field detectors. From each detector there are hard X-ray measurements in four energy channels, 25–50, 50–100, 100–300 and 300 keV. A characteristics of the BATSE instrument and its capabilities for solar flare studies can be found in Fishman et al. (1989, 1992) and Schwartz et al. (1992).
For the analysis, the 1-min averaged GOES SXR data measured in the 1–8 Å channel, the HXR data collected in the BATSE Solar Flare Catalog, archived in the Solar Data Analysis Center at NASA/Goddard Space Flight Center, and the H flare reports from the SGD for the period January 1997 to June 2000 are used. In the BATSE Flare Catalog, the start, maximum and end times of an HXR event are reported with an accuracy of 1 s, whereas the GOES SXR and the H flare reports in the SGD have a 1 min precision. Thus, we cannot expect to obtain any reliable time difference with an accuracy 1 min. For the comparison of the HXR start/peak/end times with the characteristic times of the SXR and H emission we also round off the HXR times to minutes.
Some points regarding the used data should be stressed. Various observatories around the world contribute to the H flare data collected by the SGD. In recent years, most (or all) of the observatories perform regular observations on a time cadence of 1 min or better (Helen Coffey, private communication). However, there may be still a spread in the reported H flare times among the different observatories (due to different instruments, seeing conditions, etc.) In the selection of the H flares from the SGD data collection, we excluded all events in which the start or maximum time was annotated as uncertain or in which the times reported by different observatories differed for more than two minutes. For the X-ray emissions, it has to be noted that the peak times in both soft and hard X-rays are precisely known. However, the situation is less clear for the start times. Since the soft X-rays are stronger than the hard X-rays by a few magnitudes, the sensitivity thresholds play an important role. Due to the lower relative sensitivity in hard X-rays, the start of the HXR flare is detected later than it actually occurs. In particular, in short and weak HXR events, the start time may be subject to substantial uncertainties.
The identification of corresponding HXR/SXR/H events is based on temporal coincidence. To be attributed as corresponding events, we demand that at all three wavelengths the emission starts within a time window of 10 min. Furthermore, in order to avoid any incidental assignment, we applied the following refinements. Events that overlap in time with any other event observed at the same wavelength are excluded from the analysis. Also events for which a multiple assignment to flares observed at any of the other two wavelengths is possible, e.g. one SXR event can be assigned to two HXR events, are excluded. Applying these selection criteria, for the considered period we obtained 503 flares that are observed simultaneously in soft X-rays, hard X-rays and H.
3 Results
For each event we determined the difference of the start times as well as peak times in HXR, SXR and H emission. Moreover, we derived the difference between the HXR end time and the SXR and H peak time. The differences are determined in absolute values (given in minutes), denoted here as , as well as normalized to the duration of the respective HXR event, i.e.
| (1) |
The normalized time differences, , are of particular interest when the timing behavior of long-duration flares is considered. Such events may show distinct time differences in absolute values; however, the time difference may be rather small compared to the overall endurance of the event. Moreover, since the importance of a flare and its duration are correlated (e.g., Crosby et al., 1998; Veronig et al., 2002a,c) considering only absolute time differences may introduce a bias towards intense events (for further discussion see Veronig et al., 2002a). From the present data set we derive a median duration of 2.0 min for the BATSE HXR bursts.
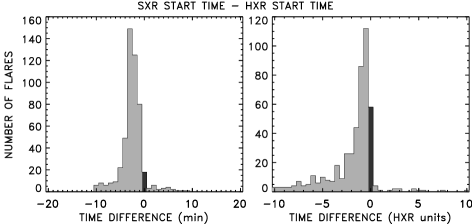
Figure 1 shows the histogram of the start time differences of the SXR and the HXR emission derived from the total set of 503 events, in absolute values (left panel) and normalized to the HXR event duration (right panel). For the absolute time differences a bin size of 1 min, and for the normalized time differences a bin size of 0.5 units of the HXR duration is applied. (Note that Figures 2–8 are constructed analogously to Figure 1.) From the histograms it is clearly evident that in most events the SXR emission starts before the HXR emission. Only in 5% of the considered flares, the SXR emission starts after the HXR emission. The distribution of the absolute time differences, , has its mode at min. For the normalized time differences, , the overall situation is quite similar. However, due to the weighting with the HXR event duration there are more events that belong to the bin , indicative for a time difference less than 0.25 times the HXR event duration. The mode of the distribution is located at HXR units.
In Figure 2, the respective distributions of the SXR–H start time differences are plotted. The general behavior is quite similar to those of the SXR–HXR start times. For the bulk of flares, the SXR event starts before the H event; only in 12% of the cases the SXR emission starts after the H emission. The mode of the distribution of absolute time differences is located min; for the normalized time differences it lies at HXR units.
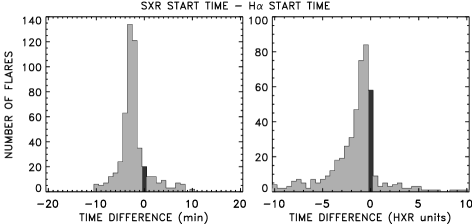
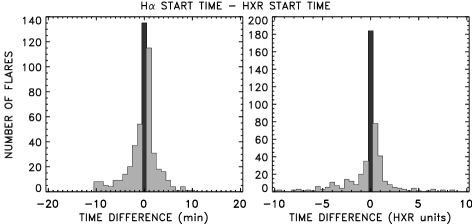
Figure 3 shows the histograms of the H–HXR start time differences. The distributions of the absolute as well as normalized time differences have a distinct peak at zero, indicating that within the given precision, the H and HXR emissions preferentially start simultaneously. of the events start within the same minute, and start within min. The normalized time differences are even more concentrated around zero: 37% of the events are covered by the bin . Furthermore, we note that the total number of events with negative time differences is similar to those with positive time differences (see also Table I).
Comparing the distributions of the absolute time differences of the SXR, HXR and H start times (Figures 1–3, left panels), it can be seen that by the used criterion we certainly have missed flares, in which the SXR emission starts more than 10 min prior to the HXR or H emission. On the other hand, there might be only a negligible number of events, in which the SXR emission starts more than 10 min later than the HXR or H emission. In general, the distributions in Figures 1–3 confirm the reasonableness of the used 10 min start time window for the identification of corresponding events, since the shape of the histograms indicates that relatively few events lie outside this range.
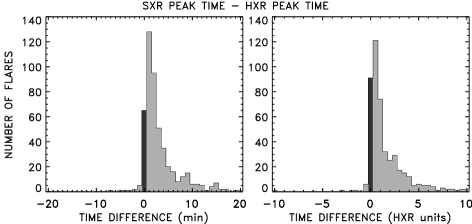
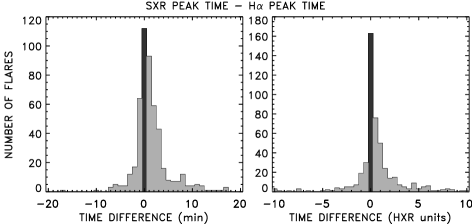
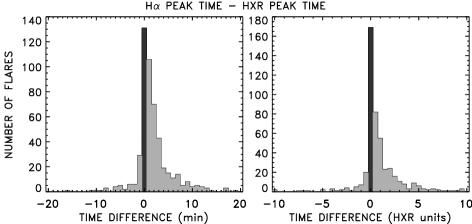
In Figures 4, 5 and 6 the distributions of the peak time differences between the SXR and HXR, the SXR and H, and the H and HXR emission are represented, respectively. Figure 4 shows that the soft X-rays predominantly peak after the hard X-rays, with the mode at min and HXR units, respectively. Only in 2% of the events, the SXR maximum takes place before the HXR maximum. In contrast to that, the SXR and the H emission peak preferentially simultaneously. The absolute as well as the normalized distributions have its mode at zero. Yet, the distribution is asymmetric: there are more events, for which the SXR emission peaks after the H emission than vice versa (cf. Figure 5). From Figure 6 it can be inferred that also the histograms of the time differences of the H and HXR peak emission have its mode at zero, but there exists a clear tendency that the H emission peaks after the HXR emission. Only in 12% of the events, the H maximum takes place before the HXR peak.
In Figure 7, the distributions of the differences of the SXR peak time and the HXR end time are plotted. The absolute and the normalized time differences have its maximum at zero. For 22% of the events the SXR peak and the HXR end take place within the same minute, 53% lie within min. Yet, there are more events, for which the SXR maximum occurs after the HXR end than vice versa. This behavior is in particular evident from the distribution of the normalized time differences. Almost all events with negative time differences belong to the bin , whereas the events with positive time difference distribute over a broad range of . This indicates that many of the flares located on the left hand side of the distribution, embracing events in which the SXR emission is already decreasing while there is still HXR emission detectable, are of long duration. For the events with negative time difference, we obtain a median HXR duration of min, whereas for the events with positive time difference we find min.
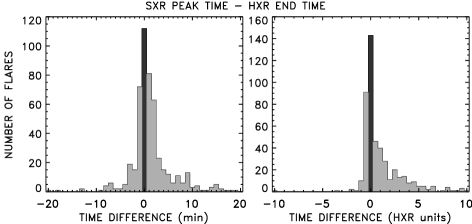
In principle, it is expected that there are no events with HXR unit, since this range indicates that the maximum of the SXR emission occurs before the start of the HXR emission. However, as can be seen from Figure 7, a few such events exist. There are two possible explanations for that: a) the respective HXR and SXR events are not causally related (e.g., take place at different sites), b) the determined HXR burst duration is too short due to the sensitivity limits of the HXR detectors. In particular, in weak and short HXR events, a considerable part of the HXR burst duration will be missed, if the emission is not distinctly higher than the noise level.
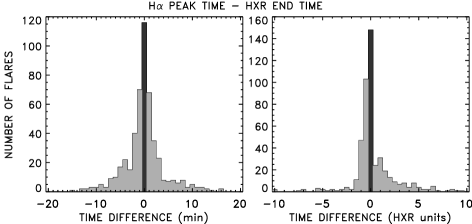
Figure 8 shows the distributions of the differences of the H peak time and the HXR end time. The histogram of the absolute time differences is strongly peaked at = 0 min. 23% of the events are covered by = 0 min, 51% lie within min. A similar behavior shows up for the normalized time differences. Similar to Figure 7, but less pronounced, the range with negative time differences reveals a tendency to cover long-duration flares. For the events with negative time difference we obtain min, for those with positive time differences min.
In Table I and II, a summary of the histograms represented in Figures 1–8 is given. Table I specifies the percentage of events, for which the absolute time differences, , are negative, positive or zero (i.e. the respective emissions take place within the same minute). In Table II, we list the mode and the median of the absolute and the normalized time differences, characterizing the maximum and the center of the distributions, respectively.
| Fig. | Time difference | Number of events (%) | ||
|---|---|---|---|---|
| 1 | SXR start – HXR start | 91.8 | 4.6 | 3.6 |
| 2 | SXR start – H start | 83.9 | 12.1 | 4.0 |
| 3 | H start – HXR start | 33.4 | 39.8 | 26.8 |
| 4 | SXR peak – HXR peak | 2.2 | 84.9 | 12.9 |
| 5 | SXR peak – H peak | 22.2 | 55.5 | 22.3 |
| 6 | H peak – HXR peak | 11.7 | 62.2 | 26.1 |
| 7 | SXR peak – HXR end | 25.8 | 51.9 | 22.3 |
| 8 | H peak – HXR end | 40.5 | 36.4 | 23.1 |
| Fig. | Time difference | (min) | (unit) | ||
|---|---|---|---|---|---|
| Median | Mode | Median | Mode | ||
| 1 | SXR start – HXR start | ||||
| 2 | SXR start – H start | ||||
| 3 | H start – HXR start | ||||
| 4 | SXR peak – HXR peak | ||||
| 5 | SXR peak – H peak | ||||
| 6 | H peak – HXR peak | ||||
| 7 | SXR peak – HXR end | ||||
| 8 | H peak – HXR end | ||||
4 Discussion
4.1 Flare onset
We find that in more than 90% of the analyzed events the SXR emission starts before the HXR emission for at least 1 min. About 80% of the analyzed events lie within the range: . It has to be noted that the cut-off on the left hand side of the histogram of the SXR–HXR start time differences (Figure 1, left panel) strongly suggests that there are also events, for which the SXR emission starts even more than 10 min before the HXR emission, not covered by our analysis. Moreover, we obtain that in 84% the SXR emission starts before the H emission. Only in 5% (12%) of the sample, the SXR emission starts later than the HXR (H) emission (cf. Table 1). On the other hand, the H and the HXR emission start preferentially simultaneously. The distribution shows a very sharp peak at zero, which is in particular evident for the normalized time differences, and a quite symmetric behavior for positive and negative time differences (cf. Figure 3). This provides evidence that the onset of the H emission is related to the impulsive phase of particle acceleration, in which the chromosphere is directly heated by electron bombardment. This finding coincides well with high time resolution observations, from which strong temporal correlations between the hard X-ray and H fine structures during the impulsive flare phase are reported (e.g., Kurokawa, Takakura and Ohki, 1988; Wülser and Marti, 1989; Trottet et al., 2000).
In principle, an enhanced thermal emission preceding the onset of the hard X-rays may be indicative of a thermal preheating phase prior to the impulsive electron acceleration, or it can be caused by the sensitivity threshold of the hard X-ray detectors (e.g., Dennis, 1988). We find that, on average, the SXR emission precedes the hard X-rays by 3 min. This corresponds to more than 1 unit of the HXR event duration for the normalized time differences (cf. Table 2). For about one third of the events, it is even more than 2 times the HXR duration, which can hardly be explained by the sensitivity limits of the HXR detectors. On average, we find slightly longer preceding SXR emissions than Machado, Orwig and Antonucci (1986) and Schmahl et al. (1989), who reported an average value of 2 min, although the BATSE HXR detectors are far more sensitive than previously used instruments (Schwartz et al., 1992). So, relating the preceding soft X-ray emission to the sensitivity threshold of the HXR detectors, we would expect to obtain a shorter duration for this phase than previous authors. Furthermore, we find that in most of the events the soft X-ray emission precedes not only the HXR but also the H emission. All these findings suggest that the preceding SXR emission can be interpreted in terms of a thermal preheating of the flare atmosphere prior to the impulsive particle acceleration, and that such preheating occurs in almost all flares.
No correlation between the duration of the preheating phase and the importance of the subsequent flare is found. The cross-correlation coefficients, , determined between the duration of the preheating phase, , and the HXR peak emission, the SXR peak emission and the H area yield . This means that preheating occurs in the same manner in weak as well as intense events. Moreover, there is neither a significant correlation between and the duration of the HXR event nor between and the HXR peak flux divided by the HXR rise time. This outcome suggests that there is no distinct difference in impulsive and gradual flares.
Current sheet models (e.g., Heyvaerts, Priest and Rust, 1977) of solar flares predict the existence of a preheating phase (see also the review by Gaizauskas, 1989). Li, Pallavicini and Cheng (1987) have discussed the preheating of the flare atmosphere caused by emerging magnetic flux, and the formation of a current sheet at the interface between the newly emerging flux tube and the overlying magnetic region. The authors obtain a spectrum of solutions depending on the rate of flux emergence. This can explain gradual enhancements of the SXR emission without any impulsive electron acceleration111It has to be noted that this case, SXR burst without accompanying electron acceleration, i.e. without HXR emission, is a priori excluded in our analysis, studying corresponding SXR/HXR/H events., as well as the gradual preheating stage seen in soft X-rays before an impulsive flare phase. Vršnak (1989) has shown that in fact a hot turbulent current sheet characterized by an increasing merging velocity can very well explain the SXR emission during the early phases of solar flares regardless on the details of the magnetic field configuration.
Emslie, Li and Mariska (1992) have shown that preheating influences the subsequent chromospheric evaporation process, insofar as it causes smaller flow speeds of the evaporated material. The main argument is the following: If the flare plasma is preheated, the initial coronal density is enhanced. This leads to an increase of the column depth of the corona, and the accelerated electrons loose their energy predominantly in coronal layers. Thus, chromospheric evaporation will not be provoked. Moreover, the large inertia of the corona will suppress any upward velocity. Taking into account these effects of preheating, the simulations of the electron-heated flare model reproduced the evaporation flow speeds known from spectroscopic observations (Emslie, Li and Mariska, 1992), whereas not taking into account a preheated flare atmosphere, the derived flow speeds were too high compared to observations (Li, Emslie and Mariska, 1989).
4.2 Relation between the peak and the end of the thermal and nonthermal flare emissions
For the timing of the emission peaks (cf. Figures 4–6), we obtain that in most flares the SXR and H emission reach their maximum after the HXR emission. Only in 2% (12%) of the considered events, the SXR (H) emission peaks prior to the hard X-rays. The fact that the SXR and H emission predominantly peak after the HXR emission, can be considered as a necessary condition for the electron beam-driven evaporation model (e.g. Benz, 1995), as the model assumes that the thermal flare emission is caused by thermalization of the same nonthermal electrons that are emitting in hard X-rays. The SXR and the H emission peak preferentially simultaneously. Yet, the distribution is not symmetric but reveals a tendency for the soft X-ray peak taking place after the H maximum (cf. Table 1). This difference may be interpreted as an indication that the chromospheric plasma is cooling faster than the coronal plasma.
The most direct test for the electron beam-driven chromospheric evaporation model is provided by Figures 7 and 8, representing the distributions of the differences of the SXR (H) peak time and the HXR end time. If the electron-heated evaporation model holds, then the thermal emissions should not further increase after the HXR emission, i.e. the energy supply by nonthermal electrons, has stopped. Indeed, both distributions have its mode at zero, and more than half of the events lie within min. However, there is also a significant fraction that violates the predicted timing behavior. In the following, we discuss separately the two different cases of deviation from , i.e. negative and positive time differences.
12% (27%) of the events have min, i.e. the SXR (H) emission already decreases although the HXR emission is still present for more than 1 min. As it is shown above, these events are preferentially flares with long HXR duration, i.e. gradual flares. Thus, the assumption that the cooling time of the plasma is distinctly longer than the impulsive HXR emission is not valid any longer. The outcome that in gradual events the thermal emission peaks before the end of the nonthermal HXR emission is compatible with the electron beam-driven evaporation model. Li, Emslie and Mariska (1993) simulated HXR and SXR light curves from a thick-target electron-heated model, finding that in gradual flares the maximum of the SXR emission occurs before the end of the HXR event, caused by the fact that during the decay phase of the HXR flare, the energy supply by the evaporation-driven density enhancements cannot overcome the instantaneous cooling of the hot plasma.
36% (23%) of the events have min, i.e. the SXR (H) emission is still increasing although the HXR emission, i.e. the energy input by the nonthermal electrons, already stopped more than 1 min earlier. Such outcome, in principle, suggests that the hot plasma giving rise to the thermal emission is not heated exclusively by thermalization of the accelerated electrons, which are responsible for the HXR emission. However, as argued by McTiernan, Fisher and Li (1999), an extended heating beyond that due to nonthermal electron beams is not the only possible explanation for flares, in which the SXR emission is still increasing although the HXR emission already stopped, but it might be related to the temperature response of the SXR detector. If the used SXR detector has also a substantial response to low-temperature plasma, and the GOES 1–8 Å detector has (James McTiernan, private communication), then the extended increase of the SXR emission might be due to cooling of high-temperature flare plasma (for further discussion see McTiernan, Fisher and Li, 1999).
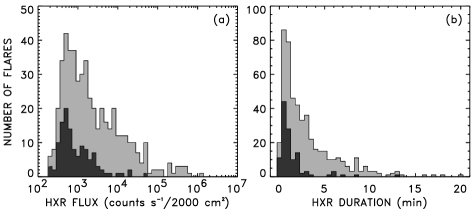
This may provide an explanation, why we find more events with a prolonged increase of SXR emission than events with a prolonged increase of H emission beyond the end of the hard X-rays (cf. Table 1). However, also in the case of the H emission, which is not affected by the above argument, there is a significant fraction of events (about one third), in which the emission is still increasing after the hard X-rays have stopped. For 24% of the events, the H as well as the SXR emission of an event is increasing for longer than 1 min or longer than 1 unit of the HXR event duration after the HXR emission already stopped. This subset is indicative of a strong violation of the timing behavior predicted from the electron beam-driven evaporation model. Thus, for a significant fraction there is strong evidence for an additional agent other than the HXR emitting electrons, contributing to the energy input and prolonging the evaporation. It is important to note that these events have shorter duration and smaller HXR fluxes than the average. From the subset with distinct prolonged thermal emissions we find min and counts s-1 / 2000 cm2, whereas from the complete sample we obtain min and counts s-1 / 2000 cm2. In Figure 9, we show the distribution of the HXR peak fluxes (panel a) and the HXR event duration (panel b). The distributions of the complete sample are shaded in light grey, the distributions of the subset characterized by a distinct prolongation of the thermal emissions in dark grey. From the figure it is evident that this subset contains almost no events with high HXR fluxes or long HXR duration.
4.3 Interpretation with regard to different energy transport mechanisms
Simnett (1986) and Plunkett and Simnett (1994) have proposed that accelerated protons drive the evaporation process, whereas accelerated electrons play an unimportant role in terms of the energy transport in solar flares. In the frame of proton dominated models, the hard X-rays are either produced directly by protons via inverse bremsstrahlung (e.g., Emslie and Brown, 1985; Heristchi, 1986), or by electrons, secondary accelerated in the chromosphere by proton or neutral beams (Simnett and Haines, 1990). Recently, Karlický et al. (2000) have proposed a model, in which hard X-rays may be emitted by a neutral beam due to heating of the electrostatically dragged beam electrons in collision with a neutral background plasma. As argued in the review by Simnett (1995), models invoking proton beams can account for several observational features, which are difficult to be explained in the frame of electron beam models, as, e.g., preceding soft X-rays, delay of the microwaves with regard to the hard X-rays, plasma flows prior to the HXR emission (but see also the criticism, e.g., in Aschwanden, 1996; Emslie et al., 1996; Newton, 1997).
In principle, from the present analysis, finding that for at least half of the events there is a good agreement between the end of the HXR emission and the maximum of the thermal SXR and H emission, we cannot exclude that proton beams rather than electron beams play the dominant role in the energy transport. Such temporal coincidence is expected from the proton beam model in the same way as from the electron beam model (at least within the given accuracy of 1 min). Thus, the electron versus proton debate is beyond the capabilities of this study. However, from energy-dependent timing delays inferred from high time resolution hard X-ray observations, Aschwanden (1996) concluded that protons can be ruled out as the primary energy carrier in solar flares. New insight into the site and the nature of the energy deposition in solar flares, and the contribution of high-energy particles to the flare energetics is anticipated by the recently launched Reuven Ramaty High Energy Solar Spectroscopic Imager (RHESSI) mission.
On the other hand, for 25% of the analyzed events there is strong evidence that the thermal emission is significantly prolonged beyond the end of the HXR emission. This finding is in contradiction to both the electron and the proton beam-driven evaporation model, and implies that for a considerable fraction of the analyzed flare sample, there is evidence for an additional energy transport mechanism other than electron (or proton) beams. A promising candidate is thermal conduction, simply due to the fact that the energy release site is strongly heated (for discussion see Vršnak, 1989; Somov, 1992; McDonald, Harra-Murnion and Culhane, 1999; and references therein). Furthermore, in several papers observational evidence for thermal conduction driving the evaporation process is reported. From high time resolution HXR and H observations, Kämpfer and Magun (1983) and Wülser and Marti (1989) found indications for the occurrence of energy transport by electron beams at one flare kernel and for conductive energy transport at another kernel. Similar, using spatially resolved H measurements combined with HXR and SXR observations, Kitahara and Kurokawa (1990) inferred the presence of at least two different energy transport mechanisms, most probably electron precipitation and thermal conduction. Rust, Simnett and Smith (1985) report observational evidence for thermal conduction fronts seen in SXR images. These authors report that the inferred heat flux accounts for most of energy released in the studied flares. Furthermore, various observations lend support for a prolonged chromospheric evaporation driven by thermal conduction fronts during the decay phase of solar flares (e.g., Zarro and Lemen 1988; Schmieder et al. 1990; Czaykowska, Alexander, and de Pontieu, 2001).
5 Conclusions
We found in almost all of 503 studied flares (90%) a thermal preheating of the flare atmosphere, seen in soft X-rays prior to the impulsive particle acceleration. On average, the SXR emission starts 3 min before the HXR and the H emission. The duration of the preheating phase is not related to the importance of the subsequent flare. Moreover, there is no evidence that the duration of the preheating phase differs for impulsive and gradual flares. The H and the HXR emission start preferentially simultaneously, indicating that the onset of the H emission is related to the impulsive phase of particle acceleration.
The thermal (SXR and H) emissions predominantly peak after the nonthermal (HXR) emission. This outcome provides a necessary condition for the electron-heated chromospheric evaporation model, in which the thermal flare emission is caused by thermalization of the same nonthermal electrons that are emitting in hard X-rays. For more than half of the events, the end of the nonthermal emission coincides well with the maximum of the thermal emission ( min), as predicted from the beam-driven evaporation model. However, for 25% of the events, there is strong evidence for a prolonged evaporation beyond the end of the nonthermal emission. On average, these events are characterized by a weak and short HXR emission. The extended thermal emission beyond the hard X-rays suggests the presence of an additional energy transport mechanism from the energy release site other than particle beams, most probably thermal conduction. Events, in which the thermal emission is found to peak prior to the end of the hard X-rays, are preferentially of long duration. This effect can be explained, within the electron-heated evaporation model, by instantaneous cooling of the plasma that dominates over the energy supply by evaporated material during the decay phase of long-duration events.
Acknowledgements.
The authors thank Brian Dennis, Richard A. Schwartz and A. Kimberley Tolbert from the BATSE team for making available the solar flare data, as well as Helen Coffey from NGDC to provide the SXR data. We thank also the referee František Fárník for clarifying comments, which made the paper more precise. A.V., M.T. and A.H. gratefully acknowledge the Austrian Fonds zur Förderung der wissenschaftlichen Forschung (FWF grants P13653-PHY and P15344-PHY) for supporting this project. B.V. acknowledges the University of Graz for financial support and is grateful to the colleagues from the Institute for Geophysics, Astrophysics and Meteorology for their hospitality.References
- [1] Antonucci, E., Gabriel, A.H., Dennis, B.R.: 1984, Astrophys. J. 287, 917.
- [2] Antonucci, E., Alexander, D., Culhane, J.L., de Jager, C., MacNeice, P., Somov, B.V., and Zarro, D.: 1999, in K.T. Strong, J.L.R. Saba, B.M. Haisch and J.T. Schmelz (eds.), The Many Faces of the Sun: A Summary of the Results from NASA’s Solar Maximum Mission, Springer-Verlag, chapt. 10.
- [3] Aschwanden, M.J.: 1996, Astrophys. J. 470, L69.
- [4] Benz, A.O.: 1995, in A.O. Benz and A. Krüger (eds.), Coronal Magnetic Energy Release, Springer-Verlag, Heidelberg, Lecture Notes in Physics Vol. 444, p. 1.
- [5] Brown, J.C.: 1971, Solar Phys. 18, 489.
- [6] Crosby, N.B., Vilmer, N., Lund, N., and Sunyaev, R.: 1998, Astron. Astrophys. 334, 299.
- [2001] Czaykowska, A., Alexander, D., and de Pontieu, B.: 2001, Astrophys. J. 552, 849.
- [7] Datlowe, D.W., Hudson, H.S., and Peterson, L.: 1974, Solar Phys. 35, 193.
- [8] Dennis, B.R.: 1988, Solar Phys. 118, 49.
- [1991] Dennis, B.R.: 1991, in Y. Uchida, R.C. Canfield, T. Watanabe, and E. Hiei (eds.), Flare Physics in Solar Activity Maximum 22, Lecture Notes in Physics Vol. 387, Springer-Verlag, p. 89.
- [1974] Donelly, R.F. and Unzicker, A.: 1974, NOAA Tech. Memo ELR SEL-72.
- [9] Doschek, G.A., Antiochos, S.K., Antonucci, E., Cheng, C.-C., Culhane, J.L., Fisher, G.H., et al.: 1989, in M.R. Kundu, B. Woodgate and E. J. Schmahl (eds.), Energetic Phenomena on the Sun, Kluwer Academic Publishers, Astrophysics and Space Science Library Vol. 153, chapt. 4.
- [10] Emslie, A.G. and Brown, J. C.: 1985, Astrophys. J. 395, 648.
- [11] Emslie, A.G., Li, P., and Mariska, J.T.: 1992, Astrophys. J. 339, 714.
- [12] Emslie, A.G., Henoux, J.-C., Mariska, J.T., and Newton, E.K.: 1996, Astrophys. J. 470, L131.
- [13] Falciani, R., Giordano, M., Rigutti, M., and Roberti, G.: 1977, Solar Phys. 54, 169.
- [14] Fárník, F., Hudson, H., and Watanabe, T.: 1996, Solar Phys. 165, 169.
- [15] Fárník, F. and Savy, S.K.: 1998, Solar Phys. 183, 339.
- [16] Feldman, U.: 1990, Astrophys. J. 364, 322.
- [1985] Fisher, G.H., Canfield, R.C., and McClymont, A.N.: 1985, Astrophys. J. 289, 425.
- [17] Fishman, G.J., Meegan, C.A., Wilson, R.B., Parnell, T.A., Paciesas, W.S., Pendleton, G.N., et al.: 1989, in Max ’91 Workshop 2: Developments in Observations and Theory for Solar Cycle 22, p. 96.
- [18] Fishman, G.J., Meegan, C.A., Wilson, R.B., Paciesas, W.S., and Pendleton, G.N.: 1992, in The Compton Observatory Science Workshop, NASA CP-3137, p. 26.
- [19] Gaizauskas, V.: 1989, in B.M. Haisch and M. Rodonò (eds.), Solar and Stellar Flares, Kluwer Academic Publishers, IAU Coll. no. 104, p. 135.
- [20] Garcia, H.A.: 1994, Solar Phys. 154, 275.
- [21] Heinzel, P.: 1991, Solar Phys. 135, 65.
- [22] Heristchi, D.: 1986, Astrophys. J. 311, 474.
- [23] Heyvaerts, J., Priest, E.R., and Rust, D.M.: 1977, Astrophys. J. 216, 123.
- [24] Kahler, S.W.: 1979, Solar Phys. 62, 347.
- [25] Kämpfer, N. and Magun, A.: 1983, Astrophys. J. 274, 910.
- [26] Karlický, M., Brown, J.C., Conway, A.J., and Penny, G.: 2000, Astron. Astrophys. 353, 729.
- [27] Kitahara, T. and Kurokawa, H.: 1990, Solar Phys. 125, 321.
- [28] Kurokawa, H., Takakura, T., and Ohki, K.: 1988, Astron. Soc. Japan Publ. 40(3), 357.
- [29] Li, H.-W., Pallavicini, R., and Cheng, C.: 1987, Solar Phys. 107, 271.
- [30] Li, P., Emslie, A.G., and Mariska, J.T.: 1989, Astrophys. J. 341, 1075.
- [31] Li, P., Emslie, A.G., and Mariska, J.T.: 1993, Astrophys. J. 417, 313.
- [32] Machado, M.E., Orwig, L.E., and Antonucci, E.: 1986, Adv. Space Res. 6(6), 101.
- [1999] McDonald, L., Harra-Murnion, L.K., and Culhane, J.L.: 1999, Solar Phys. 185, 323.
- [33] McTiernan, J.M., Fisher, G.H., and Li, P. 1999, Astrophys. J. 514, 472.
- [34] Newton, E.: 1997, Astrophys. J. 484, 455.
- [35] Phillips, K.J.H.: 1991, Vistas Astron. 34, 353.
- [36] Plunkett, S.P. and Simnett, G.M.: 1994, Solar Phys. 155, 351.
- [37] Rust, D.M., Simnett, G.M., and Smith, D.F.: 1985, Astrophys. J. 288, 401.
- [38] Schmahl, E.J., Webb, D.F., Woodgate, B., Waggett, P., Bentley, R., Hurford, A., et al.: 1989, in M.R. Kundu, B. Woodgate and E.J. Schmahl (eds.), Energetic Phenomena on the Sun, Kluwer Academic Publishers, Astrophysics and Space Science Library Vol. 153, chapt. 1.4.
- [39] Schmieder, B., Malherbe, J.M., Simnett, G.M., Forbes, T.G., and Tandberg-Hanssen, E.: 1990, Astrophys. J. 356, 720.
- [40] Schwartz, R.A., Dennis, B.R., Fishman, G.J., Meegan, C.A., Wilson, R.B., and Paciesas, W.S.: 1992, in The Compton Observatory Science Workshop, NASA CP-3137, p. 457.
- [41] Simnett, G.M.: 1986, Solar Phys. 106, 165.
- [42] Simnett, G.M.: 1995, Space Sci. Rev. 73, 387.
- [43] Simnett, G.M. and Haines, M.G.: 1990, Solar Phys. 130, 253.
- [1992] Somov, B.V.: 1992, Physical Processes in Solar Flares, Kluwer Academic Publishers, Astrophysics and Space Science Library Vol. 172.
- [44] Švestka, Z.: 1976, Solar Flares, Reidel, Dordrecht, Geophysics and Astrophysics Monograph Vol. 8.
- [45] Tappin S.J.: 1991, Astron. Astrophys. Suppl. 87, 277.
- [46] Thomas, R.J. and Teske, R.G.: 1971, Solar Phys. 16, 431.
- [47] Trottet, G., Rolli, E., Magun, A., Barat, C., Kuznetsov, A., Sunyaev, R., and Terekhov, O.: 2000, Astron. Astrophys. 356, 1067.
- [48] Verma, V.K. and Pande, M.C.: 1985a, Bull. Astr. Soc. India 13, 148.
- [49] Verma, V.K. and Pande, M.C.: 1985b, Solar Phys. 97, 107.
- [50] Veronig, A., Vršnak, B., Temmer, M., Magdalenić, J., and Hanslmeier, A.: 2001, Hvar Obs. Bull. 25, 39.
- [51] Veronig, A., Vršnak, B., Dennis, B.R., Temmer, M., Hanslmeier, A., and Magdalenić, J.: 2002a, Astron. Astrophys., submitted.
- [52] Veronig, A., Temmer, M., Hanslmeier, A., Otruba, W., and Messerotti, M.: 2002b, in H. Sawaya-Lacoste (ed.), Proceedings of the 2nd SOLSPA Euroconference: Solar Cycle and Space Weather, ESA SP-477, in press.
- [53] Veronig, A., Temmer, M., Hanslmeier, A., Otruba, W., and Messerotti, M.: 2002c, Astron. Astrophys., 382, 1070.
- [54] Vršnak, B.: 1989, Solar Phys. 20, 79.
- [55] Webb, D.F.: 1983, American Science and Engineering Technical Report, AFGL-TR-83-0126.
- [56] Wülser, J.P. and Marti, H.: 1989, Astrophys. J. 341, 1088.
- [1988] Zarro, D. and Lemen, J.: 1988, Astrophys. J. 329, 456.
- [57] Zirin, H., Feldman, U., Doschek, G.A., and Kane, S.: 1981, Astrophys. J. 246, 321.