Warm-hot intergalactic baryons revealed
Several popular cosmological models predict that most of the baryonic mass in the local universe is located in filamentary and sheet-like structures associated with galaxy overdensities. This gas is expected to be gravitationally heated to and therefore emitting in the soft X-rays. We have detected diffuse soft X-ray structures in a high Galactic latitude ROSAT field after point source subtraction and correction for Galactic absorption. These diffuse structures have an X-ray energy distribution that is much softer than expected from clusters, groups or unresolved emission from AGNs, but are consistent with that expected from a diffuse warm intergalactic medium. To discriminate between a Galactic or extragalactic nature of the diffuse gas we have correlated the soft X–map with multiband optical images in this field. We have found a significant overdensity of galaxies in correspondence with the strongest diffuse X-ray structure. The photometric redshift distribution of the galaxies over the X-ray peak has an excess over field galaxies at . This result strongly suggests that the diffuse X-ray flux is due to extragalactic emission by warm gas associated with an overdense galaxy region at .
Key Words.:
Large-scale structure of Universe – X-rays: diffuse background1 Introduction
The mismatch between the density of baryons observed in the local Universe
and the baryon density observed and predicted at high redshift is currently
one of the most puzzling issues in cosmology. While the
density of baryons, , observed in stars and gas () in the local
Universe does not exceed 0.01 (Fukugita et al., 1998), observations of the
Ly forest at (Rauch et al., 1997) and Big Bang nucleosynthesis
constraints (Burles & Tytler, 1998) both
give or larger (Pettini & Bowen, 2001).
One possibility is that at the baryonic gas falls onto the cosmic
web pattern and is heated by shock mechanisms forming filamentary and
sheet-like structures
(Cen & Ostriker, 1999; Davé et al., 2001).
Such diffuse gas, called Warm–Hot Intergalactic Medium (WHIM),
should be detectable in the soft X-rays as a consequence of having a
temperature in the range .
A tight connection with the filamentary distribution of galaxies is expected
from N-body simulations (see Bond et al. (1996) for a
theoretical discussion).
Various models of diffuse X-ray emission have been
proposed by several authors during the past year (Phillips et al., 2001; Kuntz et al., 2001; Bryan & Voit, 2001);
nonetheless, observational
evidence for diffuse/filamentary X-ray emission is still sparse.
Wang & McCray (1993) found an excess of emission
in some ROSAT fields which they ascribed to a diffuse component of the
X-ray background due to WHIM.
Soltan et al. (1996) detected a correlation signature between
the soft X-ray background and galaxies.
Filamentary soft X-ray structures were identified
by
Warwick et al. (1998) in
various overlapping ROSAT pointings near the Lockman Hole.
Structures laid among clusters were found by Kull & Böhringer (1999) in the core
of the Shapley Supercluster
and Tittley & Henriksen (2001) along the line of sight connecting two Abell clusters.
Scharf et al. (2000) presented tentative evidence of a soft X-ray
filamentary structure which
seems to correlate with the density of galaxies measured in the I-band.
Recently, Bagchi et al. (2002) pointed out the discovery of a presumably
filamentary structure both in radio and soft X-ray traced by a galaxy arc.
We have re-analyzed several ROSAT pointings toward a region close to the Lockman Hole with exposure times and, after removal of the point sources and correction for Galactic absorption, we have detected diffuse X-ray emission. We have started a program of optical multiband wide field imaging of the regions showing diffuse X-ray emission with the goal of detecting associated galaxy overdensities, which would support the extragalactic nature of the large scale soft X-ray structures.
In this paper we report preliminary results on one of the ROSAT fields
for which we have obtained HI radio data and which has been partially
mapped in five optical bands. We present the discovery of a galaxy
overdensity at a photometric redshift 0.45 spatially
coincident with the most prominent diffuse X-ray structure in the
ROSAT field.
The plan of the paper is as follows: in
Sect.2 we discuss the analysis of the X-ray ROSAT maps, in
Sect.3 the reduction of the radio data and the HI absorption
correction for X-ray maps are presented, in Sect.4 we
discuss the optical images analysis. Sect.5 contains the
photometric redshift estimate and, finally, in Sect.6
a summary of the results is presented.
2 X-ray maps
We have retrieved from the ROSAT archive the images of fields contiguous to the Lockman Hole used by Warwick et al. (1998) to create a large scale soft X-ray map. These authors noted, after subtraction of the point sources, large scale diffuse structures in the band. We have focused on one of the ROSAT fields used by Warwick et al. and, more specifically, on ”Field 4”, centered at R.A.(J2000) and DEC.(J2000) , obtained with a PSPC integration of 20 ksec. We extracted the images in the various ROSAT bands111In the following we will refer to such broad bands energy using the conventional definitions reported in Snowden et al. (1994) by means of the software described in Snowden et al. (1994), which is optimized for the analysis of extended structures in the ROSAT maps. In this way accurate maps of the background and of the effective exposure over the whole field of view can be obtained. We mostly focused on the soft image obtained in the R2 band (PI channels 21 to 40), which samples the energy range . However, we also use the harder bands (R4+5, ; R6+7, ), both for the point sources removal and to constrain the nature of the diffuse emission. On the R2 image obtained with Snowden’s code the detection of extended structures has been performed with two different methods:
-
1.
We have constructed a map of the extended structures with an algorithm based on SExtractor (Bertin & Arnouts, 1996). Our aim is to identify and subtract the point like sources which resolve most of the 0.5-2.0 keV background. This algorithm identifies the point sources by increasing the size of the detection filter with the distance from the center to match the broadening of the ROSAT PSF with the off–axis angle. The detected point sources in R2 and R6+7 bands are subtracted from the soft image and replaced with the surrounding background.
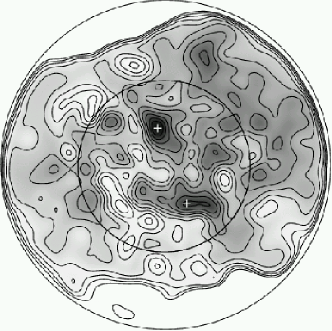
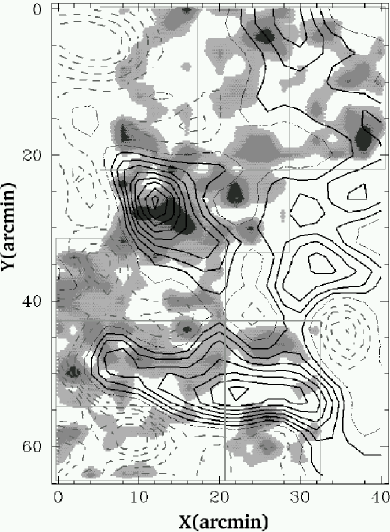
Fig. 1 shows the images, before the point sources removal and preliminarily smoothed with a gaussian kernel of 15 arcsec (i.e. one PSPC pixel), in the soft (R2; Fig 1a) and the hard (R6+7; Fig 1b) bands. The soft image was then smoothed with a gaussian kernel of 5.9 arcmin FWHM222This specific smoothing width was chosen because this is the minimum size of structures found with the second method. A FWHM of 5.9 arcmin corresponds to gaussian with a of 10 pixels. and is shown in Fig. 2a. The two main structures around the center of the field are statistically significant to a level of (assuming Poisson statistics).
-
2.
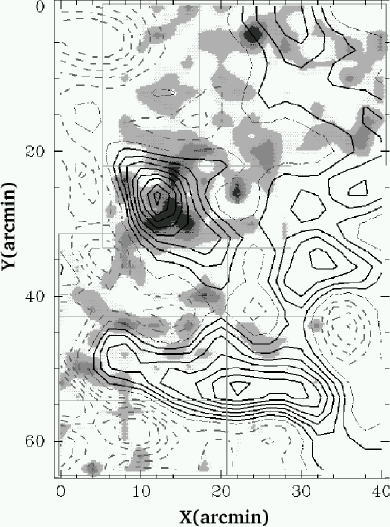
To assess the significance of the structures found with the previous method we have also used a wavelet algorithm developed by Vikhlinin et al. (1998). The aim of the wavelet transform in this context is the complete background subtraction to emphasize structures of certain angular size. The idea is to convolve an astronomical image with a kernel that is the difference of two gaussians, the first with sigma a, the second subtracted from the previous with sigma . In the following the kernel sizes will be reported as a. We require the extended emission to be detected at a level of 4, with respect to the background fluctuations, and each detection followed down to the 1 level. Given the strong radial variation of the ROSAT PSF, not implemented into the wavelet algorithm, the structures detected with wavelet kernel size less than were considered as point sources, while those detected by wavelet filters larger than are considered as extended. Features detected by wavelet filter sizes between and are to be considered point sources in the outer parts of the ROSAT field (and therefore subtracted), whereas they were considered to be potentially extended in the inner parts. In Fig. 2b we show the map of structures detected with wavelet kernel sizes in the range for the soft ROSAT band R2. The advantage of the wavelet detection algorithm is that it provides a quantitative measure of the statistical reliability of detected extended structures with respect to background fluctuations. The size measured for the smallest diffuse structure is .
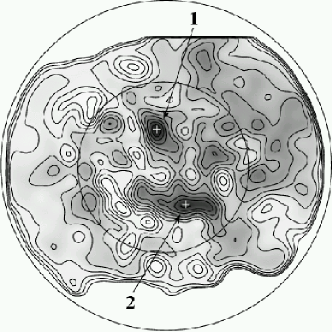
The most prominent diffuse/extended structures are in common to both methods at least in the central part, where the detection of point sources is more secure, indicating that they are not artifacts of the specific algorithm. We mark as “1” and “2” in Fig. 2d the two most prominent structures in the central region. In the outer parts, where the ROSAT PSF is much wider, the identification of the extended structures is less reliable; however, even in these outer parts there is reasonable agreement between the maps obtained with the two methods. Finally, as already commented on by Warwick et al 1998, we note that the same diffuse structures are found by using other offset ROSAT pointings which partly overlap this field, lending further weight to the argument that they are not instrumental artifacts.
In Fig. 3 we show the map of the
diffuse emission detected in the hard band (R6+7) obtained by removing
the point sources detected with SExtractor and by smoothing to a
resolution of 5.9 arcmin (this is the hard-band
analogous of Fig. 2a).
With the exception of structure “1”, which shows some faint
hard emission as discussed below,
the diffuse/extended
emission observed in the hard band (R6+7)
is not correlated with the diffuse
emission structures observed in the soft R2 band.
This indicates that the
diffuse features observed in the soft map are related to structures
with a much softer emission than that due to clusters or AGNs and, in
particular, cannot be ascribed to unresolved discrete sources which
make the 0.5-2 keV background.
A comparison between soft and medium (R4+5)
maps shows a weak correlation as expected from the hard tail of the
diffuse WHIM emission.
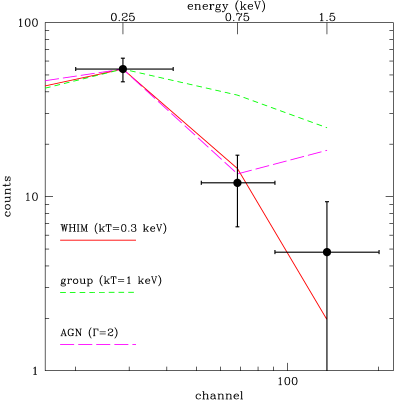
In Fig. 4 we plot the fluxes333The uniform contribution from the Local Bubble (Snowden et al., 1998) was subtracted from all images and the soft X-ray emission was corrected for Galactic absorption as discussed in Sect.3. in three bands (R2, R4+5, R6+7) of the brightest diffuse structure (marked as “1” in Fig. 2d), and the expected spectra of various classes of sources: type 1 AGNs making the 0.5–2 keV background, groups of galaxies at (clusters would be even hotter), and thermal emission by the WHIM at . For both the groups and the WHIM we adopted a 0.3 solar abundance and (see Sect. 5 for the specific choice of this redshift). For AGNs we assumed a power-law with . The choice of is lower than the canonical obtained from shallow ROSAT surveys (Walter & Fink, 1993; Brinkmann et al., 2000), but is typical of deeper surveys (Mittaz et al., 1999) like ours. Furthermore it is similar to the mean spectrum of the point sources in our maps ( for point sources selected in R2 map and for those selected in R6+7 map). Fig. 4 shows that the detected emission is inconsistent with emission by clusters or unresolved AGNs, but is fully consistent with thermal emission from the WHIM. It also indicates that the diffuse emission cannot be ascribed to possible residual wings of the PSF of point sources (AGNs) after their subtraction.
The one reported here is one of the first detections of WHIM at intermediate redshift. The diffuse X-ray emission observed in our ROSAT maps can be compared with the (projected) emission expected by the cosmological simulations of a WHIM in the soft X-ray (e.g. Croft et al. 2001). We used simulated images in the band, kindly provided to us by R. Croft (private communication), and smoothed them to the angular resolution of our ROSAT maps (Sect. 2). The average emission in the simulations is with 1 fluctuations of about . The average diffuse emission in the central region of our ROSAT map is (extrapolated in the band), which is in good agreement with the simulations. Taken in conjunction the results of the analysis described above strongly imply that the diffuse structures described here represent one of the first potential detections of a WHIM at intermediate redshift.
At a redshift of 0.45 (sect.5) the linear extension of the brightest diffuse structure (1) corresponds to a physical size of about 7 Mpc444Assuming , , ..
3 Galactic HI maps
The very soft R2 band (), where the diffuse structures are more prominent, is strongly affected by even a low amount of absorbing gas along the line of sight. As a consequence, even though our field is close to the Lockman Hole (Lockman et al., 1986) where the Galactic absorption has a minimum (), a major concern is that the observed structures might result from inhomogeneous distribution of Galactic HI clouds along the line of sight. To exclude this possibility we observed “Field 4” at 21cm with the Effelsberg 100 meter radio telescope during October 2001.
This telescope has a HPBW (half power beam width) of at 21 cm, which is close to the resolution of our ROSAT maps. We used the 18-21 cm HEMT 2 channel receiver (T K) and the 1024 channel autocorrelator555 The newer 8192 channel autocorrelator was not used due to interference problems at 21 cm.. The frequency resolution was set to per channel giving a complete velocity coverage of to . This should cover the HI emission from all Galactic and most HVC sources. The target fields were observed in a raster pattern with spacing to Nyquist sample the beam. Frequency switching was used with a 60 sec integration at each raster position (i.e. an effective integration time of 30 sec per raster position). The weather was exceptionally clear for most of the run.
The raw data were initially calibrated using the CLASS and SPEC2 software, converted to Tsys, and then corrected for stray radiation using the standard Effelsberg data reduction procedure (Kalberla et al., 1982, 1980). Observations of the Galactic reference field S7 (taken every 2 to 2.5 hrs) were then used to set the flux scale. Each raster spectrum was first Hanning smoothed to half its resolution and then the ‘baseline’, i.e. the shape of the continuum in each spectrum, was subtracted by using a fourth order polynomial fit. The HI emission between and were summed to produce the total HI emission in K km/s at each raster point. This value was multiplied by 1.8 1018 in order to obtain the total HI column in cm-2 towards each raster point (i.e. we assumed the HI emission is optically-thin).
In Fig. 2c we show the resulting NH map. There is no correlation between the soft X-ray emission and the distribution of NHI on the scales of arcmin, indicating that the diffuse structures observed in the former are not due to patchy HI absorption. Some weak anticorrelation is present on the large scales between the smooth North-South gradient of NH and the very extended X-ray emission (correlation coefficient r ); this anticorrelation is dominated by the southern of the field, i.e. outside the central region which we are investigating, where a significant HI absorption is present. If this southern part is removed the anticorrelation disappears (r ). The HI map was used to correct the R2 X-ray map for absorption; the absorption-corrected map is shown in Fig. 2d.
4 The spatial distribution of galaxies in the field
To map the galaxy distribution we have imaged a subsection of the ROSAT field in the optical. Indeed, if the diffuse emission in the ROSAT maps is due to WHIM, then a spatial correlation with galaxy overdensities is expected.
The optical data were obtained with the Wide Field Camera (WFC) at the Isaac Newton Telescope in service mode on 23 May 2000 and on 15 March 2001. This camera has 4 CCDs covering a field of arcmin (with a gap of arcmin due to the distribution of the CCDs), in five broad band filters: U (RGO), B (Kitt Peak), V (Harris), (Sloan) and (Sloan). Two fields in the central region of the ROSAT map were observed; the location of the two WFC pointings is shown in Fig. 5:
the northern field (field A hereafter) was observed on March-2001, while the southern field (field B hereafter) was observed on May-2000. The seeing was about 1.3′′ and 1.6′′ during observations of field A and field B, respectively.
For each field we have performed standard procedures of de-biasing,
flat fielding, correction of non linearity
and, in the case of , correction for fringes.
We used SExtractor to build a preliminary
galaxy catalog. The
algorithm was run on the
images as they are the most sensitive, at least for galaxies in the redshift
range of interest. We have detected 10877 objects in field A and
8650 in field B.
The zero points were determined by the observation of the standard
Landolt fields sa104 and sa101 (Landolt, 1992).
However, to achieve the maximum accuracy in the photometric
calibration we refined the zero points with color–color diagrams. This
method consists of plotting the brightest non-saturated stars (in
our fields those with and stellarity
class666See Bertin & Arnouts (1996) )
in color–color diagrams to obtain the best agreement with the
theoretical stellar main sequence. As reference we used the
digital stellar spectra compiled by Pickles (1998).
The required corrections were below 5%.
With the zero points refined in this way we re-ran SExtractor on the
images in all bands, for the objects detected in the band,
to derive the colors of all galaxies.
The limiting magnitude for point sources is about 23.6 in . Even though counts are consistent with those of SDSS (Yasuda et al., 2001) and with Metcalfe et al. (2001) up to , analysis of the differential counts within the two fields shows that the completeness in field A is different to that in field B. Field A is up to 80% complete at while field B reaches this completeness only at . The number of objects are comparable only at magnitude 22.8. This difference most probably arises from different seeing conditions prevailing during the observations.
We have quantified any possible galaxy overdensity associated with the diffuse X-ray filaments by using two complementary methods: 1) mapping the projected density of objects and 2) searching for clumps of galaxies.
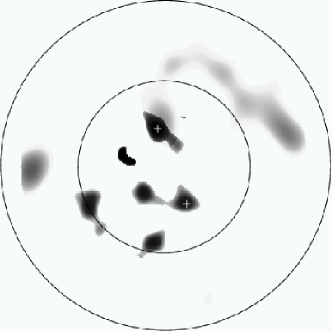
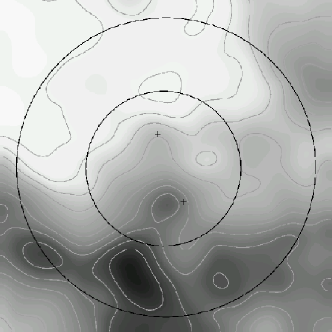
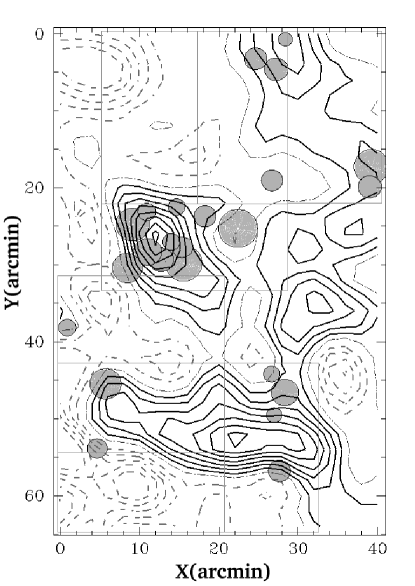
A map of the projected density of objects was constructed by grouping all the objects in sub-sections of . To avoid stellar contamination and to take into account the completeness of the galaxy catalog we have considered only those objects in magnitude range . The resulting galaxy density map is shown in grayscale in Fig. 6(a), where the contours give the distribution of the diffuse soft X-ray emission (from Fig. 2f). Interestingly, the maximum galaxy density, about (to be compared with the average of ), coincides with the maximum of the soft X-ray emission. The probability of random coincidence of the two maxima is (inferred through simulation). The second brightest filament (structure 2 in Fig. 2f) does not show an obvious associated overdensity of galaxies.
As an alternative method we have used the Voronoi tessellation (Ramella et al., 2001) to detect overdensities of galaxies or clumps. By using a significance for the detection threshold of 75% and choosing a confidence level for background fluctuations of 90%, we found 24 clumps in the whole field (i.e. AB). The distribution and extension of these groups is shown in Fig. 7. There is a clear excess of clumps in the region of maximum X-ray emission (structure 1) that confirms the result of the projected density map. Some galaxy clumps are also detected around the southern filament (structure 2) and around the NW (fainter) diffuse emission, but the significance is obviously much lower.
Finally, we should mention that we have checked that the galaxies overdensities obtained in our optical maps are not due to instrumental effects or to statistical fluctuations. The former issue was tested by deriving a map of projected density of stars, and establishing that they showed no clustering or correlation with the X-ray emission, nor with the Galactic HI maps, implying that the association with the soft X-ray emission is an intrinsic characteristic of the extragalactic objects. Secondly, we run 1000 simulations of random distributions of galaxies with the goal of identifying the degree of clustering due to statistical fluctuations. Within the artificial data we found that ”pixels” () with galaxy densities in excess of 7 galaxy arcmin-2 (the dark regions in Fig. 6(a)) are less than 0.44% of the total distribution (upper limit at 1), while in the observation the fraction of ”pixels” with densities in excess of 7 galaxy arcmin-2 is 8.4% of the total. Moreover, the ”high density pixels” from the simulations are distributed randomly and not clustered as observed in our fields. The results of these simulations clearly indicate that the overdensities observed by us are not due to statistical fluctuations.
5 The 3-D distribution of galaxies in the field
In this section we focus on the overdensity of galaxies corresponding to structure “1”. We have derived galaxy photometric redshifts with the final goal of determining whether the overdensity of galaxies observed in the projected distribution is also observed in redshift space. The photometric redshifts were obtained by means of the Hyperz code (Bolzonella et al., 2000) and by exploiting the photometry from all five available filters. Within the code we used all available templates (namely ellipticals, spirals and irregulars), and we allowed for a moderate degree of extinction, up to . We checked that the redshift distribution is not very sensitive to these parameters. As previously stated, we limit our considerations to galaxies with magnitudes between 19 and 22.8, which contribute up to 54% of the entire catalog. Of these selected objects 59% have redshift fitted with , while 73% are fitted with a ; in our analisys we have rejected objects with a photometric redshift fitted with a . In some cases the photometric redshift implies an absolute magnitude brighter than ; these are mostly objects whose photometric redshifts are fitted with and the high luminosity is most likely a consequence of an incorrect redshift determination. We have therefore discarded all objects with . By imposing these constraints we are left with 63% of the objects of the sample for the analysis of the photometric redshifts.
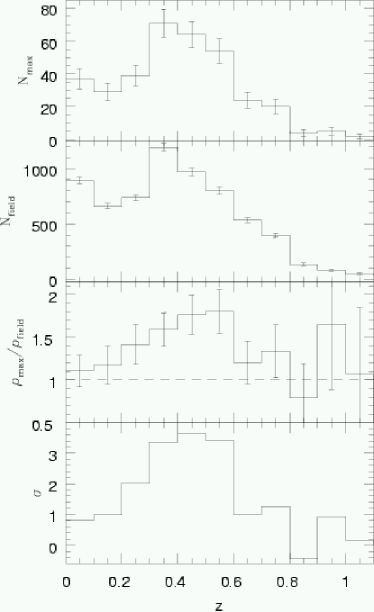
In the first two panels of Fig. 8 we show the distribution of the photometric redshifts for galaxies within the isophote at 30% from the X-ray maximum in structure ”1” (Fig.2), and the average redshift distribution in the field. The ratio between these two distributions is shown in the third panel. A clear excess of objects in the redshift range 0.30.6 is seen. The excess has a high significance as shown in the fourth panel, where the excess of galaxies in each redshift bin is reported in terms of (the latter inferred assuming Poisson statistics). Given the expected errors in the photometric redshifts () the observed overdensity is consistent with a real structure at 0.45. By combining the three redshift bins where the overdensity is observed, the significance of the redshift overdensity is .
In Fig. 6(b) we show the map of galaxy density, similar to Fig. 6(a), restricted to objects with measured photometric redshift () and in the redshift range 0.30.6. The contrast between density of galaxies on the X-ray maximum relative to the field is clearly higher than in the total projected density map of Fig. 6(a).
The association of the diffuse soft X-ray structure “1” with a 3-D overdensity of galaxies, as inferred in the last two sections, strongly imply that the former is associated to an extragalactic medium and, more specifically, at a redshift of about 0.45.
6 Summary and final remarks
We have analyzed a deep ROSAT field in a region of high Galactic latitude and low Galactic HI absorption. After removal of the point sources and after correction for absorption, the softest map show evidence for diffuse/extended structures. These diffuse structures have an X-ray energy distribution that is much softer than expected from clusters, groups or unresolved emission from AGNs, but it is consistent with emission from the diffuse warm intergalactic medium expected by the cosmological models, both in terms of shape (plasma at kT0.3 keV) and of flux ().
To discriminate between a Galactic or extragalactic nature of the diffuse gas we have correlated the soft X–map with multiband optical images in this field. The most prominent diffuse X-ray structure in the ROSAT map appears associated with an overdensity of galaxies at a photometric redshift of . This association, along with the X-ray properties of the former (sect.2), strongly suggest that we are observing an extragalactic structure most likely tracing the warm intergalactic medium predicted by cosmological theories, in this case at redshift , which is expected to be the main reservoir of baryonic matter at low redshifts.
The second most prominent diffuse X-ray structure “2” is not associated, in our optical maps, with a pronounced galaxy overdensity, although there are some clumps of galaxies surrounding it (Fig. 7). Either this structure is not extragalactic (e.g. associated to our Galactic halo) or it is associated with galaxies at redshift higher than 0.8, where most galaxies escape detection in our optical images. Finally, this may be a case of warm baryonic gas at relatively low redshift, not enclosing galaxy overdensities, but possibly bridging those few galaxy clumps detected in its surrounding.
Multi-object spectroscopy should provide a critical test on the nature of these diffuse structures. Indeed the specroscopic information would both confirm the galaxy redshift distribution and give an estimate of the involved virial masses to be compared with the temperature inferred for the barionic gas.
Acknowledgements.
We are grateful to R. Croft for providing us with the unpublished maps of his simulations and to M. Bolzonella for making available her Hyperz code and for providing additional information and suggestions. We thank G. Hasinger for helpful comments during the early stages of this work. We are also grateful to the staff of the Isaac Newton Telescope and of the Effelsberg 100 meter telescope for their support during the observations. We are grateful to Peter Kalberla for giving us access to Effelsberg calibration software and Alison Peck for help with the observations.References
- Bagchi et al. (2002) Bagchi, J., Ensslin, T. A., Miniati, F., Stalin, C., Singh, M., Raychaudhury, S., & Humeshkar, N. 2002, astro-ph/0204389
- Bertin & Arnouts (1996) Bertin, E. & Arnouts, S. 1996, A&AS, 117, 393
- Bolzonella et al. (2000) Bolzonella, M., Miralles, J.-M., & Pelló, R. 2000, A&A, 363, 476
- Bond et al. (1996) Bond, J. R., Kofman, L., & Pogosyan, D. 1996, Nature, 380, 603
- Brinkmann et al. (2000) Brinkmann, W., Laurent-Muehleisen, S. A., Voges, W., Siebert, J., Becker, R. H., Brotherton, M. S., White, R. L., & Gregg, M. D. 2000, A&A, 356, 445
- Bryan & Voit (2001) Bryan, G. L. & Voit, G. M. 2001, ApJ, 556, 590
- Burles & Tytler (1998) Burles, S. & Tytler, D. 1998, ApJ, 499, 699
- Cen & Ostriker (1999) Cen, R. & Ostriker, J. P. 1999, ApJ, 514, 1
- Davé et al. (2001) Davé, R., Cen, R., Ostriker, J. P., Bryan, G. L., Hernquist, L., Katz, N., Weinberg, D. H., Norman, M. L., & O’Shea, B. 2001, ApJ, 552, 473
- Fukugita et al. (1998) Fukugita, M., Hogan, C. J., & Peebles, P. J. E. 1998, ApJ, 503, 518
- Kalberla et al. (1980) Kalberla, P. M. W., Mebold, U., & Reich, W. 1980, A&A, 82, 275
- Kalberla et al. (1982) Kalberla, P. M. W., Mebold, U., & Reif, K. 1982, A&A, 106, 190
- Kull & Böhringer (1999) Kull, A. & Böhringer, H. 1999, A&A, 341, 23
- Kuntz et al. (2001) Kuntz, K. D., Snowden, S. L., & Mushotzky, R. F. 2001, ApJ, 548, L119
- Landolt (1992) Landolt, A. U. 1992, AJ, 104, 340
- Lockman et al. (1986) Lockman, F. J., Jahoda, K., & McCammon, D. 1986, ApJ, 302, 432
- Metcalfe et al. (2001) Metcalfe, N., Shanks, T., Campos, A., McCracken, H. J., & Fong, R. 2001, MNRAS, 323, 795
- Mittaz et al. (1999) Mittaz, J. P. D., Carrera, F. J., Romero-Colmenero, E., Mason, K. O., Hasinger, G., McMahon, R., Andernach, H., Bower, R., Burgos-Martin, J., González-Serrano, J. I., & Wonnacott, D. 1999, MNRAS, 308, 233
- Pettini & Bowen (2001) Pettini, M. & Bowen, D. V. 2001, ApJ, 560, 41
- Phillips et al. (2001) Phillips, L. A., Ostriker, J. P., & Cen, R. 2001, ApJ, 554, L9
- Pickles (1998) Pickles, A. J. 1998, VizieR Online Data Catalog, 611, 00863
- Ramella et al. (2001) Ramella, M., Boschin, W., Fadda, D., & Nonino, M. 2001, A&A, 368, 776
- Rauch et al. (1997) Rauch, M., Miralda-Escude, J., Sargent, W. L. W., Barlow, T. A., Weinberg, D. H., Hernquist, L., Katz, N., Cen, R., & Ostriker, J. P. 1997, ApJ, 489, 7
- Scharf et al. (2000) Scharf, C., Donahue, M., Voit, G. M., Rosati, P., & Postman, M. 2000, ApJ, 528, L73
- Snowden et al. (1998) Snowden, S. L., Egger, R., Finkbeiner, D. P., Freyberg, M. J., & Plucinsky, P. P. 1998, ApJ, 493, 715
- Snowden et al. (1994) Snowden, S. L., McCammon, D., Burrows, D. N., & Mendenhall, J. A. 1994, ApJ, 424, 714
- Soltan et al. (1996) Soltan, A. M., Hasinger, G., Egger, R., Snowden, S., & Truemper, J. 1996, A&A, 305, 17
- Tittley & Henriksen (2001) Tittley, E. R. & Henriksen, M. 2001, ApJ, 563, 673
- Vikhlinin et al. (1998) Vikhlinin, A., McNamara, B. R., Forman, W., Jones, C., Quintana, H., & Hornstrup, A. 1998, ApJ, 502, 558
- Walter & Fink (1993) Walter, R. & Fink, H. H. 1993, A&A, 274, 105+
- Wang & McCray (1993) Wang, Q. D. & McCray, R. 1993, ApJ, 409, L37
- Warwick et al. (1998) Warwick, R., Hutchinson, I., Willingale, R., Kuntz, K., & Snowden, S. L. 1998, in Lecture Notes in Physics, Vol. 506, 321–324
- Yasuda et al. (2001) Yasuda, N., Fukugita, M., Narayanan, et al. 2001, ApJ, 122, 1104