submitted to The Astrophysical Journal Letters
What Can We Learn from the Infrared Spectral Energy Distributions of
Dust Disks?
Abstract
The spectral energy distributions (SEDs) of dust disks are widely used to infer dust properties (compositions and sizes) and disk structures (dust spatial distributions) which might be indicative of the presence or absence of planets or smaller bodies like asteroids and comets in the disk. Based on modelling of the SED of , a young main-sequence star with the largest fractional infrared (IR) emission, we show that the SED alone is not a good discriminator of dust size, spatial distribution (and composition if no spectroscopic data are available). A combination of SED, mid-IR spectroscopy, and coronagraphic near-IR imaging of scattered starlight and mid-IR imaging of dust thermal emission provides a better understanding of these properties.
1 Introduction
Over the past 2 decades, impressive evidence has been assembled for the existence of circumstellar dust disks around main-sequence (MS) stars as well as pre-MS stars (T Tauri stars and Herbig Ae/Be stars), post-MS stars (red giants), and a white dwarf (see Zuckerman 2001 for a review). A wide variety of observational techniques have been employed to study the formation/evolution and physical/chemical properties of dust disks: optical and near-infrared (IR) imaging of scattered stellar light, photometric measurements of dust thermal emission from near-IR to submillimeter, spectroscopic observations of mid-IR dust emission features and gas emission lines and ultraviolet (UV) and visible gas absorption lines. The spectral energy distribution (SED) is of particular interest in inferring the size and composition of dust grains and the disk structure (dust spatial distribution). However, the limitations of this method have not been adequately explored; for example, in modelling the SED, Li & Greenberg (1998) found that the dust spatial distribution is coupled with the distribution of dust sizes, i.e., the distribution of dust in the disk and dust sizes cannot be uniquely determined simultaneously by the SED alone.
It is the aim of this Letter to quantify the limitations on the information derived from the SED modelling concerning the dust properties (composition and size) and disk structure. We take the SED of , a nearby (distance to Earth ) young MS star (age ) of spectral type A0 V (effective temperature ) for comparison with model results. has the largest fractional IR luminosity relative to the total stellar luminosity () among the A-type MS stars in the Yale Bright Star Catalogue (Jura 1991). The dust disk in orbit around has been extensively studied, both observationally and theoretically (see Zuckerman 2001 and references therein). With its relatively well determined dust and disk properties, serves as a good comparison basis for the SED modelling efforts described in this Letter. We stress that the main purpose of this Letter is not to carry out a detailed study of the dust disk which we defer to a subsequent paper (A. Li & J.I. Lunine 2002, in preparation). We will first outline our approach in §2. We then discuss in §3 the degeneracy between the dust spatial distribution and dust sizes under the assumption of pure silicate dust. In §4 we show that the dust composition is not well constrained by the observed SED unless mid-IR spectroscopic dust emission features are available. We discuss in §5 the possible dust composition and morphology from the evolutionary point of view that circumstellar dust disks around (pre-)MS stars are formed through the coagulation of interstellar solids. We also summarize our major conclusions in §5.
2 Modelling the Dust IR Emission
Grains in the optically thin dust disk of absorb the stellar UV/optical photons and then re-radiate them in the IR. Very small grains or large molecules (with spherical radius smaller than 100) which are subject to single-photon heating (Draine & Li 2001) will not be considered here although their presence in the disk can not be ruled out (e.g., polycyclic aromatic hydrocarbon molecules are seen in the disk of HD 100546 through their 3.3, 6.2, 7.7, 8.6, and 11.3 emission features [Malfait et al. 1998]). For grains we first use Mie theory to calculate absorption cross sections assuming a spherical shape. We then calculate grain equilibrium temperatures (and corresponding IR emission) by balancing absorption and emission. For a given dust size distribution and a given disk structure (dust spatial density distribution), the emergent IR emission spectrum can be obtained by integrating over the dust size range, and over the entire disk.
We have the following parameters to be specified or constrained: (1) dust composition – we will consider amorphous silicate, amorphous carbon, and cometary grains (porous aggregates of small silicate and carbon dust; Greenberg 1982); (2) dust sizes – we will consider a power law dust size distribution characterized by the lower-cutoff , upper-cutoff and power-law index (where is the spherical radius); (3) dust spatial density distribution – we will consider two dramatically different distribution functions: a power law distribution and a Gaussian distribution , the former is characterized by the disk’s inner boundary , outer boundary , and power-law index ; the latter is characterized by the radial position where peaks and the full width half maximum (FWHM) .
Jura et al. (1995, 1998) and Augereau et al. (1999) estimated that grains with radius exceeding a few micron are stable against radiation pressure. Telesco et al. (2000) estimated the “characteristic” radius for the 10–20 mid-IR-emitting grains to be . We therefore adopt . We take (this is a noncritical parameter since grains larger than are like blackbodies and their IR emission spectra are size-insensitive).
To be conservative, we first set the inner boundary at inside of which micron-sized silicate and carbonaceous grains would be heated to and evaporate. The outer boundary is taken to be which is expected from the disk truncation caused by the tidal effects of , a companion star of (Jayawardhana et al. 1998). Other values for and estimated from the near- and mid-IR imaging observations will also be discussed (see §3). For the Gaussian-type dust spatial distribution, we take the peak distance (from the central star) of the distribution to be as reflected from the near-IR imaging of scattered starlight (Schneider et al. 1999) and mid-IR imaging of dust thermal emission (Jayawardhana et al. 1998; Koerner et al. 1998; Telesco et al. 2000). Therefore, we are only left with two free parameters: the dust size distribution power index and the dust spatial distribution power index or the FWHM of the Gaussian-type spatial distribution.
3 Dust Spatial Distributions and Dust Sizes
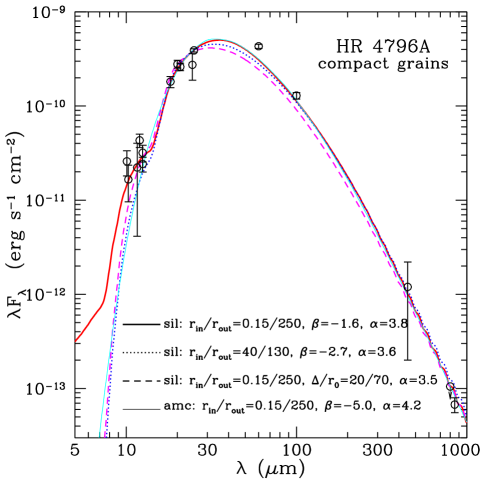
We first consider compact silicate grains. We adopt the indices of refraction of the Draine & Lee (1984) “astronomical” silicate. We approximate the radiation field by the Kurucz model atmosphere spectrum for A0 V stars (Kurucz 1979). We will compare our model results with the available photometric data compiled by Augereau et al. (1999) for the disk.
Assuming a power-law dust spatial distribution for and , the best fit to the observed SED is provided by and (see Figure 1) – the density of dust increases outward from the star through the whole disk. Since various studies suggest that the disk has an inner hole at and an outer edge sharply truncated at (Jura et al. 1993; Jura et al. 1995; Jayawardhana et al. 1998; Koerner et al. 1998; Schneider et al. 1999; Wyatt et al. 1999; Telesco et al. 2000), we also consider models with and . To obtain a satisfactory fit to the observed SED, an even steeper outward increase of dust distribution is needed (for enhancing the amount of warm dust). In Figure 1 we also present the best-fit model spectrum for and obtained from and . We have also modelled the SED in terms of broken power-laws for both the dust spatial distribution and dust sizes: , for and , for . These 2-power-law models also require and we do not see significant improvements compared with single-power-law models.
Motivated by the NICMOS (Near-IR Camera and Multi-Object Spectrometer) discovery that the surface brightness of the disk’s scattered light sharply peaks at (Schneider et al. 1999), we adopt a Gaussian function peaking at for the dust spatial distribution. As long as the FWHM , the bulk of the dust lies at and we expect little difference between the model and the model. Therefore, for the Gaussian-type distribution, we only consider and . Figure 1 plots the best-fit spectrum calculated from , , , , and . This appears to be consistent with the NICMOS detection of a sharply bounded and narrow () ring-like disk (Schneider et al. 1999).
It is seen in Figure 1 that, although the dust spatial distributions are strikingly different, all three models are able to provide similarly good fits to the observed SED except the IRAS [Infrared Astronomical Satellite] 60 data (we note that the IRAS photometric uncertainty given by Augereau et al. (1999) might have been underestimated [Beichman et al. 1989]), provided that the dust sizes are different.
4 Dust Composition
We have seen in §3 that pure solid silicate grains with various sizes and spatial distributions are successful in reproducing the SED of . Similarly, the SED can also be fitted by pure solid amorphous carbon grains using the index of refraction of Rouleau & Martin (1991). For illustration, we present in Figure 1 the best-fit single-power-law model spectrum calculated from , , , and . Although it is unlikely that (proto)planetary disk dust is mainly made of carbonaceous material, the observed SED alone is unable to rule out the pure carbon dust model unless the 9.7 Si-O and 18 O-Si-O features are detected.111The 8–13 spectroscopic observations of the disk show that the thermal emission in the silicate feature is very weak (Sitko, Lynch, & Russell 2000). We will discuss this further in §5.
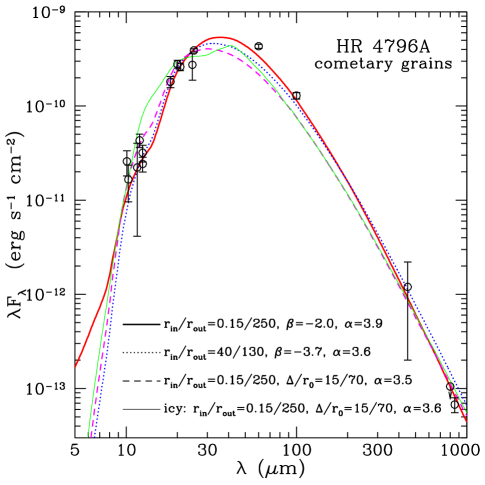
Jura et al. (1998) argued that the disk are composed of cometary icy grains. The SED was closely reproduced by Augereau et al. (1999) in terms of a cold interstellar dust component and a hot cometary dust component. In this Section we also model the SED by cometary grains. Following Greenberg (1982), we model cometary dust as fluffy aggregates of interstellar silicate and carbonaceous grains.222In the framework of the Greenberg comet model (Greenberg 1982, 1998; Greenberg & Li 1999), the silicate dust and carbon dust are physically related through a core-mantle structure. In this work the physical relationship between the silicate dust and carbon dust does not matter since the Bruggeman effective medium theory employed to calculate dust optical properties does not distinguish inclusions from matrix (Bohren & Huffman 1983). Therefore, the Greenberg comet model is not just limited to the core-mantle interstellar dust model (Li & Greenberg 1997), but also applicable to other popular dust models such as the separate silicate/graphite model (Mathis, Rumpl, & Nordsieck 1997, Draine & Lee 1984, Weingartner & Draine 2001, Li & Draine 2001) and the composite dust model (Mathis 1996). However, in the dense protostellar environment, it is possible that graphite grains may be destroyed by chemical attacks of O, H2O (Draine 1985). We take the grain porosity (the volume fraction of vacuum) to be 0.6 (Augereau et al. 1999). The volume ratio of the silicate component to the carbonaceous component is taken to be 1.0 as derived from the in situ measurement of the coma dust of comet Halley (Kissel & Krueger 1987). We use Mie theory and the Bruggeman effective medium theory (Bohren & Huffman 1983) to calculate the absorption cross sections for porous cometary grains. Similar to the pure solid silicate dust model (see §3), the cometary dust model is also able to provide reasonably good fits to the SED with various dust sizes and dust spatial distributions. In Figure 2 we show the model spectra calculated from cometary grains with a power-law size distribution and a power-law or Gaussian spatial distribution: (1) , and ; (2) , and ; (3) , , and .
5 Discussions
It is shown in §3 and §4 that models with various compositions, sizes, and spatial distributions are able to reproduce the observed SED of the disk reasonably well. It was also shown by Jura et al. (1998) that icy grains with a typical radius near 100 are able to explain the SED. Dust thermal emission depends on its absorption and emission properties which are determined by its size and optical properties. It would not be surprising for a wide range of dust materials with properly chosen sizes to be able to fit the SED. However, we should not be too pessimistic: such spectrum will be useful when combined with other constraints on the composition of the dust in circumstellar disks around (pre-)MS stars. The coagulation of interstellar grains that results in fluffy and inhomogeneous aggregates occurs in cold, dense molecular clouds and protostellar and protoplanetary dust disks and plays an important role in the formation of planetary systems (Weidenschilling & Cuzzi 1993). We can therefore approximately derive the proportional composition of the dust in circumstellar disks from the abundances of the condensable elements (C, N, O, Si, Fe, and Mg),333Some H will be present, mostly in combination with O, C, and N. assuming protostellar activities impose little modification on protostellar grain compositions (see Beckwith, Henning, & Nakagawa 2000).
Let be the cosmic abundance of X relative to H (we assume the cosmic elemental abundances are those of the solar values: parts per million (ppm), , , , , and [Sofia & Meyer 2001]); be the amount of X in gas phase (, , ; Fe, Mg and Si are highly depleted in dust; see Li & Greenberg 1997 and references therein); be the amount of X relative H locked up in dust (, , , , , ). Assuming a stoichiometric composition of MgFeSiO4 for interstellar silicates, the total mass of silicate dust per H atom is where is the atomic weight of X in unit of , and is the amount of O in silicate dust per H atom (i.e., we assign 4 O atoms for the average of the Fe, Mg, and Si abundances). The carbonaceous dust component is dominated by C, with little H, N, and O (we assume H/C=0.5, O/C=0.1). The total mass of carbon dust per H atom is . The C, O, and N atoms left over after accounting for the silicate and carbon dust components are assumed to condense in icy grains in the form of H2O, NH3, CO, CO2, CH3OH and CH4 (following Greenberg [1998], we assume CO:CO2:CH3OH:CH4:H2CO=10:4:3:1:1). The total mass of icy grains per H atom is , where the mass of C-containing ice ; the mass of NH3 ice ; the mass of water ice ; is the amount of O locked up in H2O ice (we assume H2O contains all the remaining available O).
Therefore, as a first approximation, we may assume a mixing ratio of and for cold regions (for hot regions where ices sublimate the dust can be simply modelled as porous aggregates of silicate and carbon particles with ). This does not deviate much from the in situ measurements of cometary dust (, ; see Greenberg & Li 1999 and references therein) which is often suggested as porous aggregates of unaltered interstellar dust (Greenberg 1982; Greenberg & Li 1999). The porosity is a free parameter ranging from that of diffuse cloud interstellar dust (, Mathis 1996) to that of very fluffy cometary dust (, Greenberg & Li 1999). For illustration, we plot in Figure 2 the model spectrum calculated from a Gaussian distribution (, , , ) of grains with (1) a power law size distribution (, , ), (2) and a porosity of for ; and (3) compact icy grains with and (porous grains of become compact after filled with ices of an amount of ) for . This will be discussed in detail in a subsequent paper (A. Li & J.I. Lunine 2002, in preparation).
The fact that pure amorphous carbon grains are also able to account for the observed SED (see §4) reinforces the importance of combining observations with theoretical calculations of dust composition in the context of the formation and evolution of dust disks. We note that the non-detection of the silicate emission features in the disk (Sitko et al. 2000) does not necessarily imply the predominance of non-silicate dust in the disk. It may just imply the lack of small and hot silicate grains. On the other hand, the contradistinction between the various dust spatial distributions, which all provide a reasonably good fit to the observed SED (see §3 and §4), indicates the importance of direct disk imaging.
In summary, the spectral energy distributions of dust disks alone are not necessarily able to constrain the dust compositions, sizes, and spatial distributions. The dust spatial and size distributions are coupled. Caution should be taken in discussing the presence/absence of planets, comets, and asteroids in the disk solely based on the observed SED. We argue that grains in circumstellar disk around (pre-)MS stars are composed of silicate, carbonaceous dust (and ices in cold regions) and vacuum with a mixing ratio of and . A combination of compositional considerations, SED, mid-IR spectroscopy, coronagraphic near-IR imaging of scattered starlight and mid-IR imaging of dust thermal emission will allow us to better understand the properties of circumstellar dust disks.
References
- (1) Augereau, J.C., Lagrange, A.M., Mouillet, D., Papaloizou, J.C.B., & Gorod, P.A. 1999, A&A, 348, 557
- (2) Backman, D.E., & Paresce, F. 1993, in Protostars and Planets III, ed. E.H. Levy & J.I. Lunine (Tucson: Univ. Arizona Press), 1253
- (3) Beckwith, S.V.W., Henning, Th., & Nakagawa, Y. 2000, in Protostars and Planets IV, ed. V. Mannings, A.P. Boss, & S.S. Russell (Tucson: Univ. Arizona Press), 533
- (4) Beichman, C.A., et al. 1988, IRAS Catalogs and Atlases, Explanatory Supplement (Washington, DC: GPO)
- (5) Bohren, C.F., & Huffman, D.R. 1983, Absorption and Scattering of Light by Small Particles (New York: Wiley)
- (6) Draine, B.T. 1985, in Protostars and Planets II, ed. D.C. Black & M.S. Matthews (Tucson: Univ. Arizona Press), 621
- (7) Draine, B.T., & Lee, H.M. 1984, ApJ, 285, 89
- (8) Draine, B.T., & Li, A. 2001, ApJ, 551, 807
- (9) Greenberg, J.M. 1982, in Comets, ed. L.L. Wilkening (Tucson: Univ. Arizona Press), 131
- (10) Greenberg, J.M. 1998, A&A, 330, 375
- (11) Greenberg, J.M., & Li, A. 1999, Space Sci. Rev., 90, 149
- (12) Jayawardhana, R., Fisher, R.S., Hartmann, L., Telesco, C.M., Piña, R.K., & Fazio, G. 1998, ApJ, 503, L79
- (13) Jura, M. 1991, ApJ, 383, L79
- (14) Jura, M., Zuckerman, B., Becklin, E.E., & Smith, R.C. 1993, ApJ, 418, L37
- (15) Jura, M., Ghez, A.M., White, R.J., McCarthy, D.W., Smith, R.C., & Martin, P.G. 1995, ApJ, 445, 451
- (16) Jura, M., Malkan, M., White, R., Telesco, C.M., Piña, R.K., & Fisher, R.S. 1998, ApJ, 505, 897
- (17) Kissel, J., & Krueger, H.R. 1987, Nature, 326, 755
- (18) Koerner, D.W., Ressler, M.E., Werner, M.W., & Backman, D.E. 1998, ApJ, 503, L83
- (19) Kurucz, R.L. 1979, ApJS, 40, 1
- (20) Li, A., & Draine, B.T. 2001, ApJ, 554, 778
- (21) Li, A., & Greenberg, J.M. 1997, A&A, 323, 566
- (22) Li, A., & Greenberg, J.M. 1998, A&A, 331, 291
- (23) Malfait, K., Waelkens, C., Waters, L.B.F.M., Vandenbussche, B., Huygen, E., & de Graauw, M.S. 1998, A&A, 332, L25
- (24) Mathis, J.S. 1996, ApJ, 472, 643
- (25) Mathis, J.S., Rumpl, W., & Nordsieck, K.H. 1977, ApJ, 217, 425
- (26) Rouleau, F., & Martin, P.G. 1991, ApJ, 377, 526
- (27) Schneider, G., et al. 1999, ApJ, 513, L127
- (28) Sitko, M.L., Lynch, D.K., & Russell, R.W. 2000, AJ, 120, 2609
- (29) Sofia, U.J., & Meyer, D.M. 2001, ApJ, 554, L221
- (30) Telesco, C.M., et al. 2000, ApJ, 530, 329
- (31) Weidenschilling, S.J., & Cuzzi, J.N. 1993, in Protostars and Planets III, ed. E.H. Levy & J.I. Lunine (Tucson: Univ. Arizona Press), 1031
- (32) Weingartner, J.C., & Draine, B.T. 2001, ApJ, 548, 296
- (33) Wyatt, M.C., Dermott, S.F., Telesco, C.M., Fisher, R.S., Grogan, K., Holmes, E.K., & Piña, R.K. 1999, ApJ, 527, 918
- (34) Zuckerman, B. 2001, ARA&A, 39, 549