Cosmic Ray Diffusion from the Galactic Spiral Arms,
Iron
Meteorites, and a possible climatic connection?
Abstract
We construct a Galactic cosmic ray (CR) diffusion model while considering that CR sources reside predominantly in the Galactic spiral arms. We find that the CR flux (CRF) reaching the solar system should periodically increase each crossing of a Galactic spiral arm. We search for this signal in the CR exposure age record of Iron meteorites and confirm this prediction. We then check the hypothesis that climate, and in particular the temperature, is affected by the CRF to the extent that glaciations can be induced or completely hindered by possible climatic variations. We find that although the geological evidence for the occurrence of IAEs in the past Eon is not unequivocal, it appears to have a nontrivial correlation with the spiral arm crossings—agreeing in period and phase. Thus, a better timing study of glaciations could either confirm this result as an explanation to the occurrence of IAEs or refute a CRF climatic connection.
pacs:
98.35.Hj, 92.40.Cy, 92.70.Gt, 98.70.SaWith the possible exception of extremely high energies, cosmic rays (CRs) are believed to originate from supernova (SN) remnants [1, 2]. Moreover, most SNe in spiral galaxies like our own are those which originate from massive stars, thus, they predominantly reside in the spiral arms, where most massive stars are born and shortly thereafter explode as SNe [3]. Indeed, high contrasts in the non-thermal radio emission are observed between the spiral arms and disks of external galaxies. Assuming equipartition between the CR energy density and the magnetic field, a CR density contrast can be inferred. It can have a lower limit of 5 in some cases [4].
Thus, while the Sun is crossing the Galactic spiral arms, the CRF is expected to be higher. To estimate the CRF variation, we construct a simple diffusion model which considers that the CR sources reside in the Galactic spiral arms. We expand the basic CR diffusion models (e.g., ref. [2]) to include a source distribution located in the Galactic spiral arms. Namely, we replace a homogeneous disk with an arm geometry as given by Taylor & Cordes [5], and solve the time dependent diffusion problem. To take into account the “Orion spur” [6], in which the Sun currently resides, we add an arm “segment” at our present location. Since the density of HII regions in this spur is roughly half of the density in the real nearby arms [6], we assume it to have half the typical CR sources as the main arms. We integrate the CR sources assuming a diffusion coefficient of cmsec, which is a typical value obtained in diffusion models for the CRs [2, 7, 8]. We also assume a halo half-width of 2kpc, which again is a typical value obtained in diffusion models [2], but more importantly, we reproduce with it the 10Be survival fraction [9]. Thus, the only free parameter in the model is the angular velocity around the Galaxy of the solar system relative to the Spiral arm pattern speed, which is later adopted using observations. Results of the model are depicted in fig. 1. For the nominal values chosen in our diffusion model and the particular pattern speed which will soon be shown to fit various data, the expected CRF changes from about 25% of the current day CRF to about 135%. Moreover, the average CRF obtained in units of today’s CRF is 76%. This is consistent with measurements showing that the average CRF over the period 150-700 Myr before present (BP), was about 28% lower than the current day CRF [10].
Interestingly, the temporal behavior is both skewed and lagging after the spiral arm passages. The lag arises because the spiral arms are defined through the free electron distribution. However the CRs are emitted from SNe which on average occur roughly 15 Myr after the average ionizing photons are emitted. The skewness arises because it takes time for the CRs to diffuse after they are emitted. As a result, before the region of a given star reaches an arm, the CR density is low since no CRs were recently injected in that region and the sole flux is of CRs that succeed to diffuse to the region from large distances. After the region crosses the spiral arm, the CR density is larger since locally there was a recent injection of new CRs which only slowly disperse. This typically introduces a 10 Myr lag in the flux, totaling about 25 Myr with the SN delay. This lag is actually observed in the synchrotron emission from M51, which shows a peaked emission trailing the spiral arms [1].
The spiral pattern speed of the Milky Way has not yet been reasonably determined through astronomical observations. Nevertheless, a survey of the literature reveals that almost all observational determinations cluster either around to 13 (km s-1)/kpc[11] or around to 5 (km s-1)/kpc[12]. In fact, one analysis [13] revealed that both = 5 or 11.5 (km s-1)/kpc fit the data. However, if the spiral arms are a density wave [14], as is commonly believed [15], then the observations of the 4-arm spiral structure in HI outside the Galactic solar orbit [16] severely constrain the pattern speed to (km s-1)/kpc, since the four arm density wave spiral cannot extend beyond the outer 4 to 1 Lindblad resonance [17]. We therefore expect the spiral pattern speed obtained to coincide with one of the two aforementioned ranges, with a strong theoretical argumentation favoring the first range.
To validate the above prediction, that the CRF varied periodically, we require a direct “historic” record from which the actual time dependence of the CRF can be extracted. To find this record, we take a compilation of 74 Iron meteorites which were 41K/40K exposure dated [18]. CRF exposure dating (which measures the duration a given meteorite was exposed to CRs) assumes that the CRF history was constant, such that a linear change in the integrated flux corresponds to a linear change in age. However, if the CRF is variable, the apparent exposure age will be distorted. Long periods during which the CRF is low would correspond to slow increases in the exposure age. Consequently, Fe meteorites with real ages within this low CRF period would cluster together since they will not have significantly different integrated exposures. Periods with higher CRFs will have the opposite effect and spread apart the exposure ages of meteorites. To avoid real clustering in the data (due to one parent body generating many meteorites), we remove all occurrences of Fe meteorites of the same classification that are separated by less than 100 Myr and replace them by the average. This leaves us with 42 meteorites.
From inspection of fig. 1, it appears that the meteorites cluster with a period of Myr, or equivalently, (km s-1)/kpc, which falls within the preferred range for the spiral arm pattern speed. If we fold the CR exposure ages over this period, we obtain the histogram in fig. 2. A K-S test yields a probability of 1.2% for generating this non-uniform signal from a uniform distribution. Moreover, fig. 2 also describes the prediction from the CR diffusion model. We see that the clustering is not in phase with the spiral arm crossing, but is with the correct phase and shape predicted by the CR model using the above pattern speed. A K-S test yields a 90% probability for generating it from the CR model distribution. Thus, we safely conclude that spiral arm passages modulate the CRF with a Myr period.
In 1959, Ney [19] suggested that the Galactic CR flux (CRF) reaching Earth could be affecting the climate since the CRF governs the ionization of the lower atmosphere, to which the climate may in principle be sensitive to. If this hypothesis is correct, we may be able to see a correlation between the observed long term CRF variability and the climate record on Earth.
Interestingly, the CRF reaching Earth is also variable because of its interaction with the variable solar wind. Thus, solar activity variations will too have climatic effects if the CRF affects the climate (e.g., [20]). Under the assumption that it does affect climate, we can estimate how large an effect can a possible CRF-temperature relation be. This can be derived from the fact that the best fit to the global warming in the past 120 years is obtained if somewhat less then half is attributed to anthropogenic greenhouse gases and somewhat more than half to the increased activity of the sun [21, 22]. Thus, between about 1940 and 1970, the global temperature, which decreased by K, is best explained as K attributed to the reduced solar activity and K to greenhouse gases [21, 22]. A global CRF climate effect is presumably more likey to arise from CRs that can reach the troposphere and equatorial latitudes. Thus, it is reasonable to assume that a possible effect would arise from CRs that have high rigidities (10-15 GeV/nucleon). We therefore normalize the low geomagnetic data from Haleakala, Hawaii and Huancayo, Peru to the higher geomagnetic data of Cli max, Colorado [23] that was measured over a longer period (e.g., [24]). We find that the K cooling correlated with a 1.5% increase in the high rigidity CRF. Thus, changing the CRF by would correspond to a global change of K, on condition that CRs are indeed the link relating solar activity to the climate.
For the nominal values chosen in our diffusion model, the expected CRF changes from about 25% of the current day CRF to about 135%. This corresponds to a temperature change of about K to K, relative to today’s temperature. This range is sufficient to markably help or hinder Earth from entering an IAE.
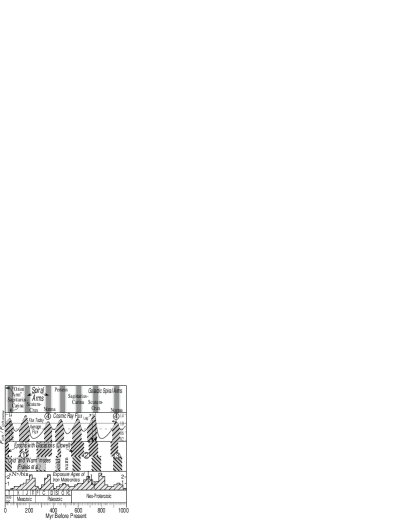

Extensive summaries of IAEs on Earth can be found in Crowell [25] and Frakes et al. [26]. Those of the past Eon are summarized in fig. 1. The nature of some of the IAEs is well understood while others are sketchy in detail. The main uncertainties are noted in fig. 1. For example, it is unclear to what extent can the milder mid-Mesozoic glaciations be placed on the same footing as other IAEs, nor is it clear to what extent can the period around 700 Myr BP be called a warm period since glaciations were present, though probably not to the same extent as the periods before or after. Thus, Crowell [25] concludes that the evidence is insufficient to claim a periodicity. On the other hand, Williams [27] claimed that a periodicity may be present. This was significantly elaborated upon by Frakes et al. [26].
Comparison between the CRF and the glaciations in the past 1 Gyr shows a compelling correlation (fig. 1). To quantify this correlation, we perform a analysis. To be conservative, we do so with the Crowell data which is less regular. Also, we do not consider the possible IAE around 900 Myr, though it does correlate with a spiral arm crossing. For a given pattern speed, we predict the location of the spiral arms using the model. We find that a minimum is obtained for (km s-1)/kpc, with per degree of freedom (of which there are 5=6-1). We also repeat the analysis when we neglect the lag and again when we assume that the spiral arms are separated by (as opposed to the somewhat asymmetric location obtained by Taylor and Cordes [5]). Both assumptions degrade the fit ( with no lag, and with a symmetric arm location). Thus, the latter analysis assures that IAEs are more likely to be related to the spiral arms and not a more periodic phenomena, while the former helps assure that the CRs are more likely to be the cause, since they are predicted (and observed) to be lagged.
The previous analysis shows that to within the limitation of the uncertainties in the IAEs, the predictions of the CR diffusion model and the actual occurrences of IAE are consistent. To understand the significance of the result, we should also ask the question what is the probability that a random distribution of IAEs could generate a result which is as small as previously obtained. To do so, glaciation epochs where randomly chosen. To mimic the effect that nearby glaciations might appear as one epoch, we bunch together glaciations that are separated by less than 60 Myrs (which is roughly the smallest separation between observed glaciations epochs). The fraction of random configurations that surpass the obtained for the best fit found before is of order 0.1% for any pattern speed. (If glaciations are not bunched, the fraction is about 100 times smaller, while it is about 5 times larger if the criterion for bunching is a separation of 100 Myrs or less). The fraction becomes roughly (or a 4- fluctuation), to coincidentally fit the actual period seen in the Iron meteorites.
Last, before 1 Gyr BP, there are no indications for any IAEs, except for periods around 2 - 2.5 Gyr BP (Huronian) and 3 Gyr BP (late Archean)[25]. This too has a good explanation within the picture presented. Different estimates to the Star formation rate (SFR) in the Milky Way (and therefore also to the CR production) point to a peak around 300 Myr BP, a significant dip between 1 and 2 Gyr BP (about a third of today’s SFR) and a most significant peak at 2-3 Gyr BP (about twice as today’s SFR)[28, 29]. This would imply that at 300 Myr BP, a more prominent IAE should have occurred—explaining the large extent of the Carboniferous-Permian IAE. Between 1 and 2 Gyr BP, there should have been no glaciations and indeed none were seen. Last, IAEs should have also occurred 2 to 3 Gyr BP, which explains the Huronian and late-Archean IAEs.
To conclude, by considering that most CR sources reside in the Galactic spiral arms, we predict a variable CRF. A record of this signal was indeed found in Iron meteorites, and it nicely agrees with the observations of the Galactic spiral arm pattern speed. Next, if the apparent solar activity climate correlation is real and arises from modulation of the galactic CRF reaching Earth, then typical variations of up to could be expected from the variable CRF. Each spiral arm crossing, the average global temperature should reduce enough to trigger an IAE. The record of IAEs on Earth is fully consistent with the predicted and observed CRF variation—both in period and in phase. Moreover, the fit improves when the predicted lag in the IAEs after each crossing is included and when the actual asymmetric location of the arms is considered. Moreover, a random mechanism to generate the IAEs is excluded. Nevertheless, one should bear in mind that the weakest link still remains the glaciological record with its uncertainties. That is, more research on the timing and extent of glaciations is required.
The last agreement is between the Eon time scale star formation activity of the Milky Way and presence or complete absence of IAEs. Here, a more detailed research on the SFR activity would be useful to strengthen (or perhaps refute) the long term correlation.
If the apparent correlation between observed CRF variations and climate on Earth is not simply a remakable coincidence, an unavoidable question is what is the physical mechanism behind the CRF/temperature relation? Currently, there is no single undisputed mechanism through which cosmic rays can affect the climate. There are however several observational indications that such a relation could exist. For example, Forbush events during which the CRF suddenly drops on a time scale of days were found to correlate with the amount of “storminess” as encapsulated by the vorticity area index [30], or a concurrent drop in the cloud cover [31]. There were also claims that the galactic CRF, which his modulated by the solar cycle and slightly lags behind it, correlates with the low altitude cloud cover variations [24, 32]. Clearly, an in depth study on the possible climatic effects of cosmic-rays is imperative.
The author is particularly grateful to Peter Ulmschneider for the stimulating discussions which led to the development of this idea. The author also wishes to thank Norm Murray, Chris Thompson, and Joe Weingartner for their very helpful comments and suggestions.
References
- [1] M. S. Longair, High Energy Astrophysics, 2nd ed., vol. 2 (Cambridge Univ. Press, Cambridge, 1994) .
- [2] V. S. Berezinskiĭ, S. V. Bulanov, V. A. Dogiel, V. L. Ginzburg, V. S. Ptuskin, Astrophysics of Cosmic Rays, (North-Holland, Amsterdam, 1990) .
- [3] P. M. Dragicevich, D. G. Blair, R. R. Burman, Mon. Not. Roy. Astr. Soc. 302, 693 (1999).
- [4] N. Duric, Astrophys. J. 304, 96 (1986).
- [5] J. H. Taylor, J. M. Cordes, Astrophys. J. 411, 674 (1993).
- [6] Y. M. Georgelin, Y. P. Georgelin, Astron. Astrophy. 49, 57 (1976).
- [7] W. Webber, A. Soutoul, Astrophys. J. 506, 335 (1998).
- [8] U. Lisenfeld, P. Alexander, G. G. Pooley, T. Wilding, Mon. Not. Roy. Astr. Soc. 281, 301 (1996).
- [9] A. Lukasiak, P. Ferrando, F. B. McDonald, W. R. Webber, Astrophys. J. 423, 426 (1994).
- [10] B. Lavielle, K. Marti, J. Jeannot, K. Nishiizumi, M. Caffee, Earth Planet. Sci. Lett. 170, 93 (1999).
- [11] The first range of results for includes (km s-1)/kpc, C. C. Lin, C. Yuan, F. H. Shu, Astrophys. J. 155, 721 (1969); , C. Yuan, Astrophys. J. 158, 871, (1969); , C. Yuan, Astrophys. J. 158, 889, (1969); , M. A. Gordon, Astrophys. J. 222, 100 (1978); [13]; , E. M. Grivnev, Sov. Astron. Lett. 9, 287 (1983); and , G. R. Ivanov, Pis ma Astron. Zhurnal 9, 200 (1983).
- [12] The second range of results for includes (km s-1)/kpc, M. Creze, M. O. Mennessier, Astron. Astrophy. 27, 281, (1973); , [13]; , A. H. Nelson, T. Matsuda, Mon. Not. Roy. Astr. Soc. 179, 663 (1977); , I. N. Mishurov, E. D. Pavlovskaia, A. A. Suchkov, Astron. Zhurnal 56, 268 (1979); , E. M. Grivnev, Sov. Astron. Lett. 7, 303 (1981); and , L. H. Amaral, J. R. D. Lepine, Mon. Not. Roy. Astr. Soc. 286, 885 (1997).
- [13] J. Palous, J. Ruprecht, O. Dluzhnevskaia, T. Piskunov, Astron. Astrophy. 61, 27 (1977).
- [14] Lin C. C., Shu F. H., Astrophys. J. 140, 646 (1964).
- [15] J. Binney, S. Tremaine, Galactic Dynamics, (Princeton Univ. Press, Princeton, 1988) .
- [16] L. Blitz, M. Fich, S. Kulkarni, Science 220, 1233 (1983).
- [17] N. J. Shaviv submitted to New Astronomy.
- [18] H. Voshage, H. Feldmann, Earth Planet. Sci. Lett 45, 293 (1979).
- [19] E. P. Ney, Nature 183, 451 (1959).
- Soon et al., [2000] Soon, W. H., Posmentier, E. S., Baliunas, S. L., 2000, Annales Geophysicae, 18 (583).
- Soon et al., [1996] Soon, W. H., Posmentier, E. S., Baliunas, S. L., 1996, Astrophys. J. , 472 (891).
- Beer et al., [2000] Beer, J., Mende, W., Stellmacher, R., 2000, Quat. Sci. Rev., 19 (403).
- [23] G. A. Bazilevskaya, Space Sci. Rev. 94, 25 (2000).
- [24] H. Svensmark, Phys. Rev. Lett. 81, 5027 (1998).
- [25] J. C. Crowell, Pre-Mesozoic Ice Ages: Their Bearing on Understanding the Climate System, volume 192, Memoir Geological Society of America (1999).
- [26] L. A. Frakes, J. E. Francis, J. I. Syktus, Climate Modes of the Phanerozoic (Cambridge Univ. Press 1992).
- [27] G. E. Williams, Earth Planet. Sci. Lett. 26, 361 (1975).
- [28] J. M. Scalo, In Starbursts and Galaxy Evolution, p. 445 (1987).
- [29] H. J. Rocha-Pinto, J. Scalo, W. J. Maciel, C. Flynn, Astron. Astrophy. 358, 869 (2000).
- [30] B. A. Tinsley, G. W. Deen, J. Geophys. Res. D12, 22283 (1991).
- Pudovkin & Veretenenko, [1995] Pudovkin, M. I., & Veretenenko, S. V., 1995, J. Atmos. Terr. Phys., 57 (1349).
- [32] N. Marsh, H. Svensmark, Space Sci. Rev. 94, 215 (2000).