A Chandra Spectroscopic Survey of Persistent Black Hole Candidates
Abstract
We present results from observations of persistent black hole candidates with the High Energy Transmission Gratings aboard the Chandra X-ray Observatory. The sources include LMC X-1, LMC X-3, GRS 1758-258, and Cyg X-1. Along with the published results on 1E1740.7-2942, we have completed a high-resolution spectroscopic survey of such systems. The observed X-ray spectra of LMC X-1 and LMC X-3 show no prominent discrete features, while absorption edges (Mg K and Si K) are detected in the spectrum of GRS 1758-258. The edges are likely to be of interstellar origin. In most cases, the X-ray continuum can be described well by models that are often adopted in low-resolution studies of black hole candidates: a multi-temperature disk spectrum plus a Comptonization component. However, the relative contribution of the two components varies greatly among different sources. For instance, only the disk component is present for LMC X-1 and GRS 1758-258, while the Comptonized component is required for other sources. We discuss general issues related to obtaining disk parameters from modeling X-ray continuum.
1 Introduction
Prior to the launch of Chandra X-ray Observatory (Chandra), emission lines and absorption lines or edges had already been detected in the X-ray spectrum of a few black hole candidates (BHCs), with X-ray spectrometers of low to moderate resolution (e.g., Barr et al. 1985; Kitamoto et al. 1990; Done et al. 1992; Ebisawa et al. 1996; Cui et al. 1998; Ueda et al. 1998; Cui et al. 2000; Feng et al. 2001). The features often appear in the energy range 6–8 keV and are, therefore, attributed to emission or absorption processes involving iron K-shell electrons. Although the exact location of the emitting or absorbing material is often debatable, there is evidence that, at least for some black hole candidates, the observed iron line appears to originate in the innermost region of the accretion disk, very close to the central black hole. If this proves to be the case, the profile of the line would be distorted by the strong gravitational field of the hole (Fabian et al. 1989; Tanaka et al. 1995) and could be carefully modeled to constrain the intrinsic properties of the hole, such as its mass and spin (Laor 1991; Bromley et al. 1997).
Two major advances were brought about by the CCD spectrometer aboard ASCA. First, several pairs of Doppler-shifted emission lines were observed and attributed to the relativistic jets in SS 433 (Kotani et al. 1996). A recent observation of the source with Chandra confirmed the presence of these lines from the jets and provided many more details (Marshall et al. 2002), thanks to the improved spectral resolution of the High-Energy Transmission Gratings (HETG) aboard. The studies of such lines have proven fruitful in gaining insights into the dynamics and physical conditions of the jets in SS 433 (Marshall et al. 2002; Kotani et al. 1996). Similar Doppler shifted lines also seem to exist in the spectrum of another well-known jet source, 1E1740.7-2942, based on a recent Chandra HETG observation (Cui et al. 2001). Second, the ASCA observations of micro-quasars GRS 1915+105 and GRO J1655-40 revealed the presence of absorption lines (Ueda et al. 1998; Kotani et al. 2000). The results are confirmed by a recent Chandra observation of GRS 1915+105 (Lee et al. 2001). The absorption lines were interpreted as resonant absorption lines due to highly ionized (helium or hydrogen like) ions in a non-spherical configuration. There was speculation as whether such lines were characteristic of microquasars. This is clearly not the case, as shown by recent Chandra observations of Cyg X-1 (Schulz et al. 2002; Marshall et al. 2001). The obtained HETG spectra of Cyg X-1 show numerous narrow absorption lines due to H-like or He-like ions of various elements. Therefore, the phenomenon may be common for BHCs.
The presence of energetic electrons in the vicinity of accretion disks has always been a key ingradient in nearly all attempts to model the X-ray continuum of a BHC. The observed power-law spectrum at high energies ( keV) is invariably attributed to inverse Comptonization of soft photons by such electrons in an optically thin but geometrically thick configuration (review by Tanaka & Lewin 1995). At low energies, contribution from the accretion disk becomes important and often dominant. The -disk solution (Shakura & Sunyaev 1973) is often adopted to describe the observed spectrum of the disk emission; this has led to the formulation of the popular multi-color disk (MCD) model (Mitsuda et al. 1984). The model has worked satisfactorily in describing low-resolution data, but so have other models (such as a simple blackbody). The high-resolution data from Chandra (and XMM-Newton) may now allow us to see subtle differences in the shape of the continuum as predicted by various models.
The MCD model contains fundamental physical information about the accretion disk, such as its temperature (distribution) and the distance from the inner edge of the disk to the black hole. Existing observational evidence shows that, under certain conditions, the accretion disk extends down to the last (marginally) stable orbit (Tanaka & Lewin 1995 and references therein). Therefore, modeling emission from the disk may lead to a determination of the radius of the last stable orbit and thus the properties of the black hole (e.g., its mass and angular momentum; Zhang, Cui, & Chen 1997; Tanaka & Lewin 1995). However, the local X-ray spectrum of an accretion disk is not a perfect blackbody, because in the hot inner portion of the disk the opacity is primarily due to electron scattering as apposed to free-free absorption. The spectrum can instead be described by a “diluted” blackbody (Ebisuzaki, Hanawa, & Sugimoto 1984), with its temperature higher than the effective temperature. Attempts have been made to quantify such effects theoretically in terms of a spectral hardening factor (Shimura & Takahara 1995), but the results are still quite uncertain. In particular, it has been shown that the hardening factor seems to vary with mass accretion rate (Merloni, Fabian, & Ross 2000). On the other hand, the derivation of disk properties depends critically on this factor. The question becomes whether we can determine it observationally.
In this paper, we present results from a survey of persistent BHCs with the HETG. The motivations for conducting the survey included: (1) using emission or absorption lines, if present, to study the physical properties of the emitting region and its environment; (2) obtaining profiles of those emission lines that might originate in the accretion disk, with a goal of inferring the properties of the black hole; (3) directly detecting X-ray emission from the jets in microquasars; and (4) better characterizing the disk component of the continuum, making use of good low-energy sensitivity as well as excellent energy resolution of the HETG. The survey might also have provided data for systematic studies of line production in persistent BHCs. The results are likely to be relevant to transient BHCs, which constitutes the majority.
2 Sources and Observations
The sample of sources for the survey originally included LMC X-1, LMC X-3, Cyg X-1, and 1E1740.7-2942. Cyg X-1 was subsequently observed a few more times. The results on spectral lines and edges in Cyg X-1 have been presented elsewhere (Schulz et al 2002; Marshall et al. 2001). Here, we used a subset of data from the first observation (see Schulz et al. 2002 for details) to characterize the continuum. 1E1740.7-2942 was omitted from this study because the results have also been published (Cui et al. 2001). On the other hand, we re-analyzed an HETG observation of GRS1758-258 (with data taken from the public archive) and the results are presented here for completeness (see also Heindl & Smith 2001).
LMC X-1 and LMC X-3 are both located in the Large Magellanic Cloud (LMC), about 55 kpc away. Unlike most BHCs, these two sources are usually seen to be in the “soft state” where the soft X-ray ( 10 keV) flux is relatively high and the X-ray spectrum is relatively soft. Evidence for the presence of an iron Kα line in the X-ray spectrum exists for LMC X-1 (Ebisawa et al. 1989; Schlegel et al. 1994) and LMC X-3 (Nowak et al. 2001), but it is not very convincing in either case. In the former, the line appears to be weak and narrow, while in the latter only a broad line is allowed by the observations.
LMC X-1 was observed for about 20 ks on 2000 January 16. We adopted the default time exposure (TE) mode for the observation. The zeroth order image is severely piled up (i.e., multiple photons hit the same event detection cell of the ACIS within one readout frame), because of the brightness of LMC X-1. In fact, the pile-up effect is so severe that the events at the source position were rejected by the on-board processing system (and thus not transmitted back), leaving a “hole” in the image. Because we were mostly interested in using higher-order data to construct a high-resolution spectrum of the source, we sacrificed the imaging capability for better statistics in the dispersed spectra.
LMC X-3 was also observed for about 20 ks on 2000 Febuary 29. In this case, we adopted an alternating exposure mode to obtain some zeroth-order data that is nearly pile-up free. The observation was conducted with eight regular exposure frames (with a readout time of 3.2 sec) followed by one short exposure frame (with a readout time 0.3 sec). Although the use of alternating exposure modes reduces the observing efficiency, the loss is almost negligible in this case. Unlike LMC X-1, which is a relatively steady source, LMC X-3 seems to vary in a quasi-periodic fashion (with a characteristic timescale of 199 days; Cowley et al. 1991; see also the light curves111http://xte.mit.edu/ASM_lc.html from the All-Sky Monitor (ASM) on Rossi X-ray Timing Explorer (RXTE)). The Chandra observation took place when the flux of the source was quite low, as seen by the ASM, but it was still high enough to cause significant pile-up in the zeroth-order image.
GRS 1758-258 is a persistent X-ray source near the center of our own galaxy. It is considered a black hole candidate only because of its similarities to Cyg X-1 both in terms of the observed spectral and temporal X-ray properties. The most remarkable property known of this source is the presence of persistent, two-sided radio jets, reminiscent of extragalactic radio-loud quasars (Rodríguez et al. 1992). Such a comparison also supports the suggestion that GRS 1758-258 is an X-ray binary that contains an accreting black hole. The source shows uncanny similarities to 1E1740.7-2942 (Mirabel & Rodríguez 1999), both in terms of the observed X-ray properties and radio properties. Perhaps, the two systems are indeed intrinsically similar.
GRS 1758-258 was observed with the HETG for about 30 ks on 2001 March 24. A -subarray mode was adopted to reduce the readout time and thus to minimize expected pile-up in the zeroth-order image. Although the use of the subarray mode raises the lower energy threshold of the dispersed spectra, the effects are minimal here because it is still the interstellar absorption that limits the detection of low-energy photons. Like 1E1740.7-2942, GRS 1758-258 is thought to be relatively steady and seems always to be in the “hard state” (Tanaka & Lewin 1995 and references therein). When this Chandra observation was carried out, the X-ray flux of the source was unusually low (Smith et al. 2001).
Cyg X-1 is the first system that was dynamically determined to contain a black hole. It spends most of the time in the hard state. Once every a few years, it undergoes a transition to the soft state, and remains there for weeks to months before returning to the hard state. An iron Kα line has been observed in the X-ray spectrum of Cyg X-1 (Barr et al. 1985; Done et al. 1992; Ebisawa et al. 1996; Cui et al. 1998). The line seems to be relatively broad and strong (however, see Ebisawa et al. 1996). In some cases, it is thought to be significantly red-shifted (Barr et al. 1985). An interesting evolution of the line properties has been observed during the spectral state transition, which seems to suggest a physical origin of the line in the accretion disk (Cui et al. 1998).
Cyg X-1 was observed for about 11 ks on 1999 October 19. An alternating exposure mode was also used here, with five long frames followed by one short frame (with a readout time of 0.3 sec). The pile-up effects are extremely severe in this case, not only affecting the zeroth-order image but also the dispersed spectra. More details regarding this observation can be found in Schulz et al. (2002), along with the procedures to deal with complications caused by pile-up and the results on the detection of discrete spectral features. Here, we only use the short-frame data to construct a reliable continuum for comparison with other sources.
3 Analysis and Results
The HETG consists of two grating assemblies: the medium-energy grating (MEG; 0.4–5 keV or 2.5–31 Å) and high-energy grating (HEG; 0.9–10 keV or 1.2–14 Å). The two gratings are offset by a small angle to avoid the overlap of their dispersed spectra. The resolving power reaches as high as about 1000 for both gratings. The separation of various orders is achieved by utilizing the intrinsic energy resolution of the ACIS CCDs.
With the standard software package CIAO 2.2 (provided by the Chandra X-ray center), we first processed the Level 1 data to produce Level 1.5 and then Level 2 products. The Level 2 data was then reduced and analyzed, again using CIAO, to construct images and spectra of the sources. Spectral modeling was carried out with XSPEC 11.1.0.
3.1 Imaging Analysis
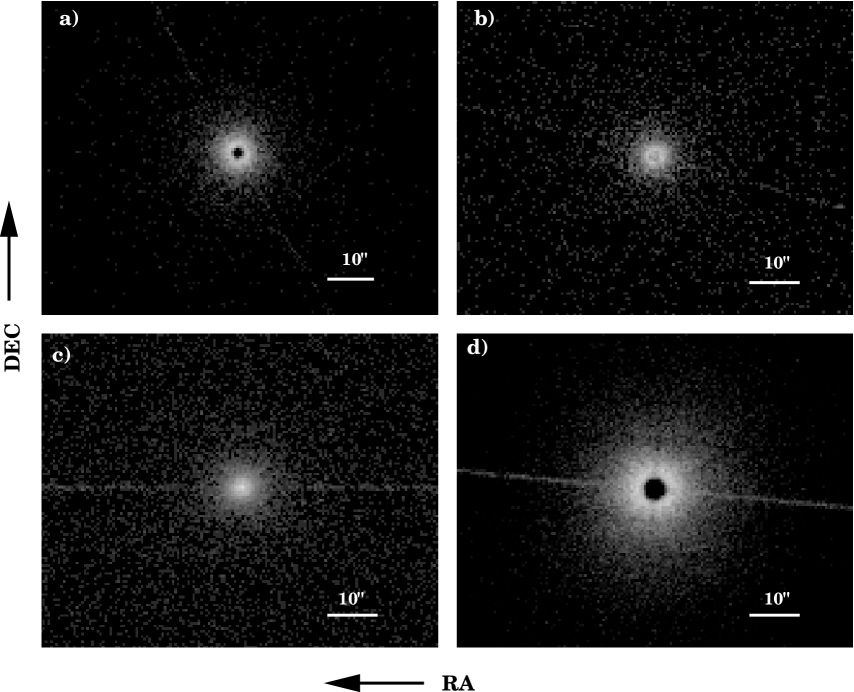
Fig. 1 shows images of the central region of the field of view for all observations. The readout trace is visible (quite bright in the Cyg X-1 image), cutting through the position of the source. For LMC X-3 and Cyg X-1, the images were generated from the long-frame data, so a “valley” (as opposed to a peak) is seen at the position of the source due to severe pile-up. The same is true for LMC X-1, as expected. In all cases, a diffuse “halo” is present around the source. The halo is spherically symmetric and is centered right on the source. It is almost certainly due to the scattering of X-rays from the source by interstellar dust along the line-of-sight. Note that the halo emission is also apparent in the dispersed spectra for Cyg X-1 because the source is so bright. Since photons of lower energies are deflected by larger angles, the size of the halo is determined by two competing factors: dust scattering and photo-electric absorption; the larger the column density, the more likely a photon is scattered out of the line-of-sight (strengthing the halo) or absorbed (weakening the halo). The scattering halos are known to exist around many X-ray sources and have proven useful for studying the spatial and size distributions of dust grains in our Galaxy (e.g., Mauche & Gorenstein 1986; Predehl & Schmitt 1995; Witt, Smith, & Dwek 2001). Chandra now makes it possible to directly image the phenomenon. The observations should, in principle, allow us to derive spatially resolved energy distribution of photons in the halo and thus to test theoretical models at a more detailed level. Such an investigation is beyond the scope of this paper.
A natural product of the observations is a precise determination of the position of each source, thanks to the unprecedented spatial resolution of Chandra. For LMC X-3 and Cyg X-1, the zeroth-order image from the short-frame data is nearly free of pile-up effects. It was used to determine the peak positions of linear count profiles across the directions of right accension (RA) and declination (Dec), which directly yields the source coordinates. However, the short-frame data suffers from poor statistics. The uncertainties on the positions are, therefore, significantly larger than those derived from the long-frame data (which is described below).
Although the zeroth-order image from the long-frame data (or regular frames for LMC X-1 and GRS 1758-258) may be severely piled up, the position of a source can be determined from the intersection between the readout trace and dispersed MEG or HEG image. Since the readout trace is caused by the process in which photons from the source hits the CCD chip during the frame transfer operation, the source must be located somewhere along the trace. Moreover, both the MEG and HEG images should, in principle, run through the position of the source. However, in no cases, their intersection points with the readout trace coincide, due to systematic uncertainties. We chose the average of the two positions to obtain the coordinates of the source. The difference between the two provides an estimate of the systematic uncertainty associated with this technique, which is much larger than the statistical uncertainty. The results are summarized in Table 1. Note that for both GRS 1758-258 and Cyg X-1 the unusually small error bar in the Dec is due to the fact that the readout trace is nearly perpendicular to this direction; the error is, therefore, determined by the statistical uncertainty in fitting the cross linear profile of the trace.
The measured position of LMC X-1 is only about 0.7″ away from the location of its optical counterpart (star 32; Cowley et al. 1978; Pakull 1978). The discrepancy is well within the uncertainty in the absolute aspect solutions222see http://cxc.harvard.edu/cal/ASPECT/celmon/. Therefore, the result strongly supports the conclusions, based on dynamical mass determination, regarding the black hole candidacy of the source (Hutchings et al. 1987). For GRS 1758-258, the derived position is about 0.6″ away from the position of its radio counterpart (whose is accurate to about 0.1″, Marti et al. 1998; also see Table 1). The association between the X-ray source and the core of the radio system (with prominent lobes) is, therefore, quite solid. Similarly, Cyg X-1 is determined to be about 0.5″ away from its optical counterpart (HD 226868). On the other hand, the discrepancy is much larger for LMC X-3, which is about 2.7″ away from its optical counterpart, although it could still be attributed to the uncertainty in the absolute aspect solutions.
3.2 Spectral Analysis
A list of instrumenal features can be found in the Proposers’ Observatory Guide (Table 9.4), which is available from the Chandra X-ray Center. All features in the LETG are also in the HETG (due to Au M edges) and the HETG has additional features at O K, Cr L and N K edges. Moreover, ACIS has an edge at 1.84 keV (Si K) when the detector is a front-illuminated chip and the edge is very weak in a back-illuminated chip.
To account for any remaining calibration uncertainties, we added 1% systematic uncertainty to the data for all sources.
3.2.1 LMC X-1
We caught LMC X-1 in a very soft state. Fig. 2 shows the first-order HETG spectra of the source. The MEG and HEG spectra are shown separately for comparison. The spectral were rebinned so that there were at least 15 counts in each energy bin. They were then jointly fitted with the MCD model (“diskbb” in XSPEC) plus interstellar absorption (“wabs” in XSPEC, using cross-sections from Morrison & McCammon (1983) and assuming solar abundances) and the quality of the fit is excellent. This seems to imply that the X-ray photons detected originate predominantly from the accretion disk; no Compton component is formally required to describe the data. The best-fit parameters are shown in Table 2.
We tried but failed to detect any discrete features in the spectrum of LMC X-1. The absence of interstellar absoprtion edges is certainly due to low statistics of the data, since, after all, such features have been clearly seen in Cyg X-1 (Schulz et al. 2002). To be more quantitative, we derived upper limits on the optical depths of some of the most prominent edges (e.g., Ne K and Fe L3) detected in Cyg X-1. The procedure involved: replacing “wabs” with “varabs” in the model; setting the abundance of an element of interest to zero; and adding to the model an absorption edge (“edge” in XSPEC) of the element (i.e., with fixed energy). It should be noted that the “varabs” model uses more recent cross sections from Balucinska-Church & McCammon (1992). We found that for the Ne K edge the 99% upper limit is about 0.14, which is significantly lower than the expected value of 0.25 (derived by scaling the Cyg X-1 result by the best-fit column densities). On the other hand, the 99% upper limit is about 0.90 for the Fe L3 edge, which is consistent with the scaled Cyg X-1 value (0.80). As for emission or absorption lines, the upper limits are not very constraining. For instance, we searched for Fe Kα emission similar to what was recently detected in Cyg X-1 (Miller et al. 2002). For such a line (which is centered at 6.4 KeV and has a sigma width of 30 eV) the 99% upper limit on the equivalent width is roughly 177 eV (compared to 16 eV as measured for Cyg X-1).
3.2.2 LMC X-3
The X-ray intensity of LMC X-3 is known to vary greatly. The variation was thought to be periodic and the period was determined to be 199 or 99 days (Cowley et al. 1991). However, a simple periodic modulation of the soft X-ray flux can be ruled out by the ASM/RXTE long-term monitoring of the source, although the flux seems to vary quasi-periodically on both timescales (199 or 99 days).
LMC X-3 was in a very faint (and thus relatively hard) state when we observed it. Fig. 3 shows the first-order HETG spectra of the source, again with the MEG and HEG spectra shown separately for comparison. We proceeded to model the spectra in a manner that is similar to the case of LMC X-1. Although the MCD model (plus interstellar absorption) produced a statistically acceptable fit to the data, the residuals show apparent features. An improved fit was achieved by adding a Compton component (“comptt” in XSPEC) to the model (see Fig. 3). The best-fit parameters are also summarized in Table 2. The inferred HI column density is significantly lower than that toward LMC X-1, as is known from previous works. As in the case of LMC X-1, we failed to detect any discrete features in the spectrum. The absence of interstellar absorption edges is certainly due to the combination of low column density along the line of sight and poor statistics of the data. The latter also prevents us from deriving meaningful constraints on emission or absorption lines. For example, the 99% upper limit on the equivalent width of the 6.4 keV line is about 643 eV!
3.2.3 GRS 1758-258
Like 1E1740.7-2942 (but unlike most BHCs), GRS 1758-258 was thought to always occupy the hard state (Tanaka & Lewin 1995). Recently, however, the source was seen to make a brief transition to the soft state as its X-ray flux decreased significantly (Smith et al. 2001). The phenomenon is rather unusual because the X-ray spectrum of a BHC usually hardens as its X-ray flux decreases.
Fig. 4 shows the first-order HETG spectra of GRS 1758-258. The spectra are well described by the MCD model (plus interstellar absorption), which confirms the conclusions of Smith et al. (2001). The spectral fit results are shown in Table 2. The inferred hydrogen column density is in agreement with previous measurements (e.g., Lin et al. 2000 and references therein). The derived temperature of the disk is in the typical range for BHCs in the soft state. In this case, two absorption edges were positively detected at keV and keV and were thus attributed to Mg and Si K edges, respectively. The measured optical depths are and . The former (Mg) is significantly less than the scaled Cyg X-1 value but the latter (Si) is in agreement (see Schulz et al. 2002 for values found in Cyg X-1). We found no emission or absorption lines, confirming the results of Heindl & Smith (2001) who had also derived upper limits on the strength of a possible line over the entire energy range. The spectrum of the source is so soft that there are very few counts at energies above 6 keV. Therefore, no meaningful constraints could be derived for the 6.4 keV emission.
3.2.4 CYGNUS X-1
The short-frame data is nearly pile-up free. Fig. 5 shows the first-order HETG spectra of Cyg X-1 which were constructed from such data. Because of the very short effective exposure time (only about 200 seconds) the quality of the data is insufficient to reveal the discrete features that are known to be present (Schulz et al. 2002).
Cyg X-1 was also observed simultaenously with the Proportional Counter Array (PCA) and High-Energy X-ray Timing Experiment (HEXTE) aboard RXTE. The power density spectrum constructed from the PCA data shows that the source was in the normal hard state, even though its soft flux seems a bit higher and spectrum softer (cf. Schulz et al. 2002). In terms of spectral coverages, the PCA significantly overlaps the HETG at low energies; the PCA and HEXTE extends the energy range up to about 200 keV. Since we were only interested in using the RXTE data to reliably determine the spectrum of non-disk emission, to minimize calibration uncertainties of the PCA at low energies we ignored data below 5 keV. Moreover, we only used data from the first xenon layer of each PCA detector unit. The PCA and HEXTE spectra are also shown in Fig. 5. For spectral modeling, we added 1% systematic uncertainty to the RXTE data.
The Chandra and RXTE data were modeled jointly with the hydrogen column density fixed at (Schulz et al. 2002). We allowed the relative normalization between the HETG and each of the PCA and HEXTE detector units to vary; the results derived (e.g., fluxes and normalizations of individual spectral components) were based on the HETG normalization. The usual combination of a MCD component and a Compton component failed to provide an adequate description of the data, even with the inclusion of a Gaussian function to account for residuals in the RXTE data between 5-8 keV. A much improved (but marginally acceptable) fit was achieved with a model consisting of two Compton components (plus the Gaussian function with its centroid energy fixed at 6.4 keV). There seem to be features in the residuals mostly above 10 keV (see Fig. 5. The fit is nevertheless good enough for decoupling the soft and hard components, so we refrained ourselves from trying more sophisticated models invoking disk reflection. The best-fit parameters are summarized in Table 3. The Gaussian feature is broad ( keV) and its equivalent width is about 150 eV. It is intriguing that these properties are similar to those of the disk line reported by Miller et al. (2002), although complicated calibration issues regarding the PCA often make it difficult to assess the reality of such features. We will not discuss it any further.
4 Summary and Discussion
Unlike Cyg X-1 (Schulz et al. 2002; Marshall et al. 2001; Miller et al. 2002) or 1E1740.7-2942 (Cui et al. 2001), we found no evidence for the presence of any emission or absorption lines in the spectra of LMC X-1, LMC X-3, and GRS 1758-258. This is at least partly due to the lack of statistics, as evidenced by the absence of interstellar absorption edges. In the case of GRS 1758-258, we did positively detect Mg K and Si K edges, which are most likely of interstellar origin.
For BHCs, X-ray illumination of the accretion disk is thought to be very important and is thus necessarily taken into account in the models. The re-processing of incident X-rays by the disk is often used to explain some of the continuum features. This process is expected to be accompanied by the production of fluorescent lines. On the other hand, depending on the ionization state of the disk, the lines can be destroyed by the Auger process (Ross & Fabian 1993). The lack of line emission can, therefore, shed light on these physical processes. Unfortunately, in our case, the quality of data is not good enough to constrain the models.
We have shown that for most sources in our sample the observed X-ray continuum can be well described by a two-component model including a MCD component and a Compton component. Such a model has been successfully applied to BHCs in general previously. The low-energy sensitivity of the HETG has allowed us to reliably model the emission from the hot inner region of the accretion disk (i.e., the MCD component). As in previous studies, however, the coupling between the two components still makes it challenging to completely separate them. Luckily, in two cases, LMC X-1 and GRS 1758-258, the data requires only the MCD component, indicating the X-ray photons from these sources originate entirely from the disk. Here, the derived disk parameters should, in principle, be quite reliable.
There are three important issues that make it uncertain to extract the physical properties of the accretion disk from the measured quantities (e.g., Zhang 1999; Cui 2001). First of all, it is still not clear what is the origin of seed photons for the inverse Comptonization process. If the accretion disk provide all the seed photons, as often assumed, these photons will not appear in the observed spectrum of the disk (i.e., the MCD component). Instead, they appear in the Compton component. In this scenario, therefore, the photons detected are originally all from the accretion disk. To compute intrinsic luminosity of the disk we must then add photons in the Compton component to the MCD component. It is the intrinsic disk luminosity that should be used to derive such important properties as the radius of the inner edge of the disk. In practice, however, the disk radius is often derived directly from the best-fit normalization of the MCD component, which is clearly erroneous, especially when the Compton component is seen to be strong. This erroneous procedure is likely to be responsible for the claimed correlation between the inner disk radius and the spectral hardness of the source: the stronger the Compton component the smaller the radius, since this is exactly what would be expected if the disk is the primary source of seed photons for Comptonization. Unfortunately, the derivation of the intrinsic luminosity of the disk (by taking into account the loss of disk photons to the Comptonization process) depends on many assumption, such as the exact origin of seed photons and the spatial distribution of Comptonizing electrons with respect to the disk, and is thus very model dependent. Robust results can be obtained only for cases in which the Compton component is either absent or weak enough to produce negligible effects.
Secondly, as discussed in § 1, the local spectrum of the inner portion of the disk is not a blackbody, because the opacity is predominantly determined by electron (Compton) scattering as opposed to free-free emission (e.g., Ebisuzaki, Hanawa, & Sugimoto 1984). Strictly speaking, therefore, the spectral shape of the disk emission is that of a (saturated) Comptonized spectrum, with the spectrum of seed photons being of MCD shape. The ratio of the temperature of electrons in the disk to that of seed photons gives the so-called “color correction factor” (or more precisely, spectral hardening factor). This factor is critical to deriving the radius of the inner edge of the disk (see discussion in § 1). A possible way to determine the hardening factor observationally is, therefore, to model the disk spectrum with a Compton component. We investigated this possibility by replacing the MCD component (see Table 2) in the model with “comptt”. The new model fit the data equally well, if not better, for all cases. The results are summarized in Table 3. As a sanity check, we expect that the temperature () of Comptonizing electrons in the disk should be close to the effective temperature of the disk, when the optical depth is large. This is indeed the case (comparing results in Table 3 and Table 2), although the measured values of the optical depth are much smaller than that expected from the standard disk model (Shakura & Sunyaev 1973). It should be noted that “comptt” assumes a Wien (as opposed to MCD) spectrum for seed photons (Titarchuk 1994). Empirically, we found that in order to fit the peak of a MCD spectrum with a Wien function the temperature of the inner disk ( in MCD) must be equal to 2.7 times that of the Wien distribution (). Therefore, the spectral hardening factor is simply given by . With large uncertainties (mostly due to poor constraints on the seed photon temperature), the values of were found to be , , , and , respectively, for the sources in Table 3. While some of these values seem reasonable (compared to the results of Merloni et al. 2000), others are too high (but keep in mind the large uncertainties). Data of much improved statistics, especially at low energies, is required to constrain the temperature of seed photons.
Finally, the situation can be further complicated by the presence of a “warm layer” just above the disk (Zhang et al. 2000). Such a layer can be due to the heating of the disk by an illuminating hard X-ray source (e.g., Nayakshin & Melia 1997; Mistra et al. 1998), although observation evidence suggests that the layer exists even in the absence of any non-disk emission (Zhang et al. 2000). The presence of a low-density warm layer is in fact supported by our results (i.e., relatively small optical depth of the soft Compton component for all sources; see Table 3). To account for the warm layer, yet another Compton component needs to be added to the model, which is not warranted by the quality of our data. This can perhaps explain somewhat erratic values of the spectral hardening factor.
To conclude, we emphasize that although modeling the disk continuum is a viable approach to deriving physical parameters of the disk the derivation is complicated by the issues discussed. Progress can be made by improving the quality of the data, especially at the lowest energies. Equally important is simultaneous broadband coverages that make it possible to reliably separate out the disk component from other components. The value of broad spectral coverage was demonstrated by the modeling of the Cyg X-1 spectrum: the traditional MCD model was shown to fail in this case.
References
- (1) Barr, P., White, N. E., & Page, C. G. 1985, MNRAS, 216, 65
- (2) Balucinska-Church, M. & McCammon, D. 1992, ApJ, 400, 699
- (3) Bromley, C. B., Chen, K., & Miller, W. A. 1997, ApJ, 475, 57
- (4) Cowley, A. P., Crampton, D., & Hutchings, J. H. 1978, AJ, 83, 1619
- (5) Cowley, A. P., et al. 1991, ApJ, 381, 526
- (6) Cui, W., Ebisawa, K., Dotani, T., & Kubota, A. 1998, ApJ, 493, L75
- (7) Cui, W., Chen, W., & Zhang, S. N. 2000, ApJ, 529, 952
- (8) Cui, W., et al. 2001, ApJ, 548, 394
- (9) Cui, W. 2001, talk at the the workshop on “X-ray Emission from Accretion onto Black Holes”, Johns Hopkins University, Baltimore, Maryland (June 20—23, 2001)
- (10) Done, C., Mulchaey, J. S., Mushotzky, R. F., & Arnaud, K. A. 1992, ApJ, 395, 275
- (11) Ebisawa, K., Mitsuda, K., & Inoue, H. 1989, PASJ, 41, 519
- (12) Ebisawa, K., Ueda, Y., Inoue, H., Tanaka, Y., & White, N. E. 1996, ApJ, 467, 419
- (13) Ebisuzaki, T., Sugimoto, D., Hanawa, T. 1984, PASJ, 36, 551
- (14) Fabian, A. C., et al. 1989, MNRAS, 238, 729
- (15) Feng, Y. X., Zhang, S. N., Sun, X., Durouchoux, Ph., Chen, W., & Cui, W. 2001, ApJ, 553, 394
- (16) Haardt, F., et al. 2001, ApJS, 133, 187
- (17) Heindl, W. A., & Smith, D. M. 2001, Proc. X-rays at Sharp Focus, Eds S. Vrtilek, E. M. schlegel, & L. Kuhi, ASP Conf. Ser., in press (astro-ph/0107469)
- (18) Hutchings, J. H., et al. 1987, AJ, 94, 340
- (19) Kitamoto, S., Takahashi, K., Yamashita, K., Tanaka, Y., & Nagase, F. 1990, PASJ, 42, 85
- (20) Kotani, T., Kawai, N., Matsuoka, M., & Brinkmann, W. 1996, PASJ, 48, 619
- (21) Kotani, T., et al. 2000, 539, 413
- (22) Laor, A. 1991, ApJ, 376, 90
- (23) Lee, J. C., Reynolds, C. S., Schulz, N. S., Remillard, R., Blackman, E. G., & Fabian, A. C. 2002, ApJ, in press (astro-ph/0111132)
- (24) Lin, D., et al. 2000, ApJ, 532, 548
- (25) Marshall, H. L., Schulz, N. S., Fang, T., Cui, W., Canizares, C. R., Miller, J. M., & Lewin, W. H. G. 2001, Proc. X-ray Emission from Accretion onto Black Holes, Eds.: T. Yaqoob and J.H. Krolik, Johns Hopkins University, Baltimore, MD (June 20-23, 2001) (astro-ph/0111464)
- (26) Marshall, H. L., Canizares, C. R., & Schulz, N. S. 2002, ApJ, 564, 941
- (27) Marti, J., Mereghetti, S., Chaty, S., Mirabel, I. F., Goldoni, P., & Rodriguez, L. F. 1998, A&A, 338, L95
- (28) Mauche, C. W., & Gorenstein, P. 1986, ApJ, 302, 371
- (29) Merloni, A., Fabian, A. C., & Ross, R. R. 2000, MNRAS, 313, 193
- (30) Miller, J. M., et al. 2002, ApJ, submitted (astro-ph/0202083)
- (31) Mirabel, I. F., & Rodriguez, L. F. 1999, ARA&A, 37, 409
- (32) Mistra, R., Chitnis, V. R., & Melia, F. 1998, ApJ, 495, 407
- (33) Mitsuda, K., et al. 1984, PASJ, 36, 741
- (34) Morrison, R., & McCammon, D. 1983, ApJ, 270, 119
- (35) Nayakshin, S., & Melia, F. 1997, ApJ, 490, L13
- (36) Nowak, M. A., Wilms, J., Heindl, W. A., Pottschmidt, K., Dove, J. B., & Begelman, M. C. 2001, MNRAS, 320, 316
- (37) Pakull, M. 1978, IAU Circ. 3472
- (38) Predehl, P., & Schmitt, J. H. M. M. 1995, A&A, 293, 889
- (39) Rodríguez, L. F., Mirabel, I. F., & Martí, J. 1992, ApJ, 401, L15
- (40) Ross, R. R., & Fabian, A. C. 1993, MNRAS, 261, 74
- (41) Schlegel, E. M., et al. 1994, ApJ, 422, 243
- (42) Schulz, N. S., Cui, W., Canizares, C. R., Marshall, H. L., Lee, J. C., Miller, J. M., & Lewin, W. H. G. 2002, ApJ, 265, 1141
- (43) Shakura, N. I., & Sunyaev, R. A. 1973, A&A, 24, 337
- (44) Shimura, T. & Takahara, F. 1995, ApJ, 445, 780
- (45) Smith, D. M., Heindl, W. A., Markwardt, C. B., & Swank, J. H. 2001, ApJ, 554, L41
- (46) Tanaka, Y., & Lewin, W. H. G. 1995, in “X–ray Binaries”, eds. W. H. G. Lewin, J. van Paradijs, & E. P. J. van den Heuvel (Cambridge U. Press, Cambridge) p. 126
- (47) Tanaka, Y., et al. 1995, Nature, 375, 659
- (48) Titarchuk, L. 1994, ApJ, 434, 570
- (49) Ueda, Y., Inoue, H., Tanaka, Y., Ebisawa, K., Nagase, F., Kotani, T., & Gehrels, N. 1998, ApJ, 492, 782
- (50) Warren, P. R., & Penfold, J. E. 1975, MNRAS, 172, 41
- (51) Witt, A. N., Smith, R. K., & Dwek, E. 2001, ApJ, 550, L201
- (52) Zhang, S. N., Cui, W., & Chen, W. 1997, ApJ, 482, L155
- (53) Zhang, S. N. 1999, talk at the workshop on “X-ray Probes of Relativistic Astrophysics”, the Aspen Center for Physics, Aspen, Colorado
- (54) Zhang, S. N., et al. 2000, Science, 287, 1239
- (55)
| Source | RA (J2000) | Dec (J2000) |
|---|---|---|
| LMC X-1 | ° ′ ″ | |
| star 3222Cowley et al. 1978; Pakull 1978 | ° ′ ″ | |
| LMC X-3 | ° ′ ″ | |
| WP833Warren & Penfold 1975; Cowley et al. 1978 | ° ′ ″ | |
| GRS 1758-258 | ° ′ ″ | |
| VLA C44Rodríguez, Mirabel, & Martí 1992 | ° ′ ″ | |
| Cyg X-1 | ° ′ ″ | |
| HD22686855The coordinates shown were taken from SIMBAD (based on the Hipparcos catalogue). | ° ′ ″ | |
| Multi-Color Disk22 and are the temperature and normalization, respectively. | Comptonized Hard Component33 is the seed photon temperature; is the electron temperature; is optical depth; and is the normalization. | ||||||||
|---|---|---|---|---|---|---|---|---|---|
| Source | Flux44Observed 0.5–10 keV keV flux in units of . | ||||||||
| keV | keV | keV | |||||||
| LMC X-1 | |||||||||
| LMC X-3 | |||||||||
| GRS 1758-258 | |||||||||
| Comptoninzed Disk Component | Comptonized Hard Component | |||||||||
|---|---|---|---|---|---|---|---|---|---|---|
| Source | ||||||||||
| keV | keV | keV | keV | |||||||
| LMC X-1 | ||||||||||
| LMC X-3 | ||||||||||
| GRS 1758-258 | ||||||||||
| Cyg X-122In this case, the column density is fixed and the fit also requires a Gaussian function with its centroid fixed at 6.4 keV. The Gaussian function has a width of 0.94 keV and an equivalent width of 150 eV. | ||||||||||