X-ray and -ray spectra and variability of the black-hole candidate GX 339–4
Abstract
We analyse five observations of the X-ray binary GX 339–4 by the soft -ray OSSE detector on board CGRO simultaneous with either Ginga or RXTE observations. The source was bright during four of them, with the luminosity of erg s-1 and the spectrum typical for hard states of accreting black holes, and it was in an off state during the fifth one, with erg s-1. Our broad-band spectral fits show the mean electron energy of electrons in the Comptonizing plasma decreasing with increasing luminosity within the hard (bright) state. For the observation with the best statistics at soft -rays, of energy in the Comptonizing plasma is probably carried by non-thermal electrons. Then, considering the efficiency of Comptonized hybrid synchrotron emission allows us to obtain an upper limit on the strength of the magnetic field in the X-ray source. Furthermore, this synchrotron emission is capable of producing the optical spectrum observed in an optically-high state of GX 339–4. In the off state, the hard X-ray spectrum is consistent with being dominated by bremsstrahlung. The unusually strong Fe K line observed by the RXTE/PCA during that state is found not to be intrinsic to the source but to originate mostly in the Galactic diffuse emission.
keywords:
accretion, accretion discs – binaries: general – stars: individual: GX 339–4 – gamma-rays: observations – gamma-rays: theory – X-rays: stars.1 Introduction
The Galactic X-ray source GX 339–4 was discovered by the OSO-7 satellite (Markert et al. 1973). It exhibits state transitions typical for accreting black holes in binaries; it has been observed in the quiescent, off, hard (low), soft (high) and very high X-ray states. Its X-ray spectral analyses have been done, e.g., by Ueda, Ebisawa & Done (1994, hereafter U94), Zdziarski et al. (1998, hereafter Z98), Wilms et al. (1999) and Kong et al. (2000). In the soft -ray domain, OSSE observations have been studied by Grabelsky (1995), Z98, and Smith et al. (1999), and SIGMA results have been presented by Bouchet et al. (1993) and Trudolyubov et al. (1998). X-ray variability studies have been done, e.g., by Maejima et al. (1994), Smith & Liang (1999), Nowak, Wilms & Dove (1999) and Revnivtsev, Gilfanov & Churazov (2001, hereafter R01).
The source has been also observed in the radio (Fender et al. 1999 and references therein) and an extended emission from a jet-like elongated structure was reported (Fender et al. 1997). Optical observations (e.g., Grindlay 1979; Motch, Ilovaisky & Chevalier 1982; Motch et al. 1983, hereafter M83; Soria et al. 1999) have not been able to identify the donor star (see also a discussion in Z98). In fact, the observed optical radiation appears to be mostly produced in an accretion flow and/or an outflow. This is supported by the decline of the optical flux during a transition from a hard to a soft state (M83; Makishima et al. 1986). Interestingly, this type of transition is also accompanied by a decline of the radio flux (Corbel et al. 2000).
The presence of an accreting black hole in the system is also suggested by its Fourier power spectra having the same characteristics at high frequencies as other black-hole candidates, but not neutron-star systems (Sunyaev & Revnivtsev 2000). Also, its broad-band energy spectra are remarkably similar to those of a well established black hole binary, Cyg X-1 (e.g., Gierliński et al. 1997, 1999). However, no reliable constraints on the mass of the compact object exist (see a discussion and references in Z98).
X-ray and -spectra of black holes in their hard states are successfully described by models with thermal Comptonization of soft photons in optically thin plasmas of a temperature, K, and reflection of the Comptonization spectrum from an optically thick, cold ( K) medium, presumably an accretion disc (Sunyaev & Trümper 1979, Zdziarski et al. 1995, Gierliński et al. 1997). The disc is also likely to serve as the source of soft photons undergoing Comptonization. This view is supported by the correlation between the spectral index of the Comptonization spectrum and the amount of reflection observed in GX 339–4 (U94, R01) and in other accreting black holes (Zdziarski, Lubiński & Smith 1999; Gilfanov, Churazov & Revnivtsev 2000).
The role of magnetic fields remains an open question. They are probably involved in transfer and generation of energy either via viscosity mechanisms or reconnection processes. As a consequence, synchrotron radiation should be present and it may serve as a source of soft photons undergoing further Comptonization. Though for thermal plasmas this process appears to be typically negligible (Wardziński & Zdziarski 2000, hereafter WZ00), the presence of a weak non-thermal tail strongly amplifies synchrotron emission (Wardziński & Zdziarski 2001, hereafter WZ01). Then, the synchrotron process can become a very effective source of soft photons, comparable to or stronger than the cold disc emission.
Consequently, detection of a non-thermal electron tail via a high-energy tail in a Comptonization spectrum can put constraints on the strength of the magnetic field. In particular, observations of Cygnus X-1 in its hard state suggest the presence of such a tail (McConnell et al. 2000, 2002). For this case, WZ01 obtained an upper limit on the magnetic field strength in the accretion flow and found constraints on the geometry.
Here, we study those (and some other) issues in the context of GX 339–4. We analyze five Ginga and RXTE observations of GX 339–4 which were simultaneous (or nearly simultaneous) with -ray observations by the OSSE detector onboard CGRO. This provides us with data in the useful range from a few keV to a few hundred keV. The data reduction procedures and models we use are described in Sections 2 and 3, respectively. We present the results of spectral analyses in Sections 4 and 5. Consequences of the possible presence of a non-thermal electrons for accretion flow models are discussed in Section 6. We investigate the connection between the X-ray and optical data in the framework of synchrotron self-Compton models in Section 7, while X-ray variability is examined in Section 8. Our results are summarized in Section 9.
2 Selection and reduction of observational data
The data used in this work are listed in Table 1. The first two data sets are identical with those of Z98. They consist of two Ginga data sets from 1991 September 11 and 12, with the usable energy range of 1.2–30 keV, and simultaneous OSSE data in the range from 50 keV up to several hundred keV. A 1 per cent systematic error is added in quadrature to the statistical error in each Ginga channel (as in U94). All the OSSE data used here include energy-dependent systematic errors estimated from the uncertainties in the low-energy calibration and response of the detectors using both in-orbit and prelaunch calibration data. They decrease from per cent at 50 keV to per cent at keV.
| No. | Satellite | Date | Observation ID/ | Instrument | Exposure111For HEXTE, the detector live time (i.e. dead-time corrected) is given. | Count rate | References |
| Viewing Period | [s] | [s-1] | |||||
| 1 | Ginga | 1991 Sept. 11 | 91091109421 | LAC | 1720 | U94; Z98 | |
| CGRO | 1991 Sept. 11 | VP 9 | OSSE | 15 | Grabelsky et al. (1995) | ||
| 2 | Ginga | 1991 Sept. 12 | 91091109421 | LAC | 1700 | U94; Z98 | |
| CGRO | 1991 Sept. 12 | VP 9 | OSSE | 15 | Grabelsky et al. (1995) | ||
| 3 | RXTE | 1996 Jul. 26 | P10420-01-01-00 | PCA | 271 | Böttcher et al. (1998); | |
| HEXTE A | 16 | Smith & Liang (1999); | |||||
| HEXTE B | 13 | ||||||
| CGRO | 1996 Jul. 9–23 | VP 524 | OSSE | 6.5 | Smith et al. (1999) | ||
| 4 | RXTE | 1997 Feb. 14 | P20183-01-02-00, 01 | PCA | 217 | R01 | |
| HEXTE A | 13 | ||||||
| HEXTE B | 11 | ||||||
| CGRO | 1997 Feb. 11–19 | VP 614.5 | OSSE | 7.0 | |||
| 5 | RXTE | 1999 Jul. 7 | P40108-03-01-00 | PCA | 1.5 | Feng et al. (2001) | |
| CGRO | 1999 Jul. 6–13 | VP 821 | OSSE | 0.2 |
The third data set consists of a relatively short RXTE observation on 1996 July 26, which was performed shortly after a two-week long OSSE observation of 1996 July 9–23. For these RXTE data (and other ones used here), we used data from the units 0 and 1 of the PCA detector, and used only layer 1, which provides the highest signal-to-noise ratio. This choice is favoured by Wilson & Done (2001) based on their study of Crab spectra from the PCA. Also following them, we added a systematic error of 0.5 per cent to the PCA data. The RXTE data were reduced with the lheasoft package v. 5.0.4, response matrix v. 7.10. Standard data selectrion criteria were applied, namely the Earth elevation angle , pointing offset , the time since the peak of the last SAA passage greater than 30 min and the electron contamination . We used the Sky_VLE background model for bright sources dated 1999 September. We constrain the energy range to a conservative range of 3–30 keV. We also used data from the clusters A and B of the HEXTE detector in the 30–100 keV range.
The fourth data set consists of an RXTE observation on 1997 February 14 and an OSSE observation on 1997 February 11–19. This data set has the best statistics among all ones used here.
Finally, the fifth data set includes an RXTE observation on 1999 July 7 and a two-week long OSSE observation of 1999 July 6–13. In the PCA energy range, the source was by two orders of magnitude fainter than in the other data sets. Thus, in order to obtain the best signal to noise ratio, in the PCA data analysis we used the layer-1 data from all the detector units available during this observation, i.e., 0, 2 and 3. Here we employed the background model for faint sources from 2002 February. The HEXTE data were not used because of very large statistical errors after background subtraction.
3 Spectral models
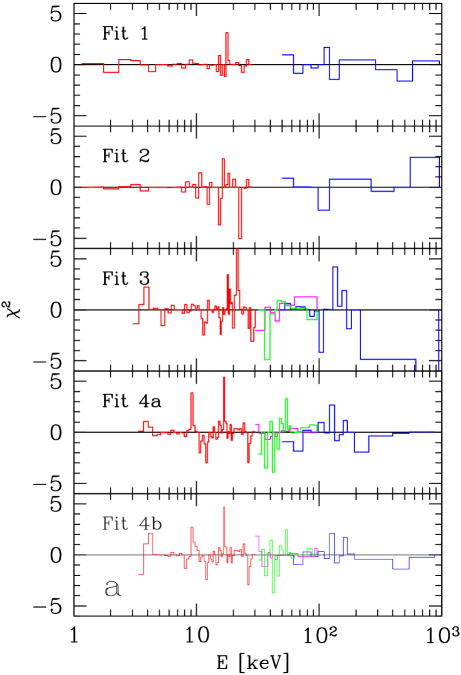
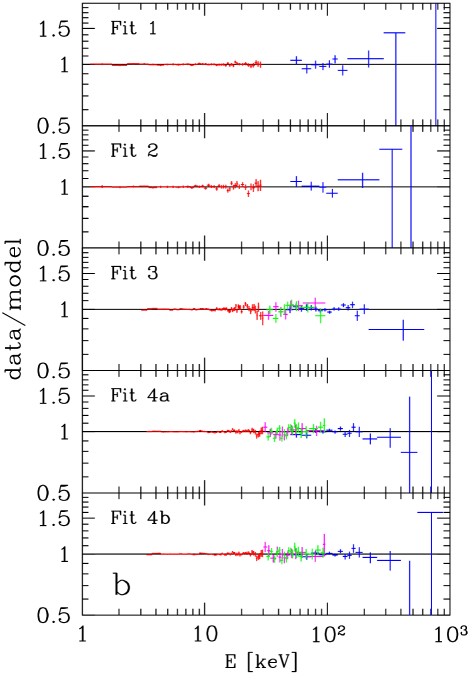
Fits below are performed with the xspec package (Arnaud 1996) v. 11. The confidence ranges of each model parameter are given for a 90 per cent confidence interval, i.e., (e.g. Press et al. 1992). On the other hand, the plotted vertical error bars are 1-, the upper limits, 2-, and the plotted spectral data are rebinned for clarity of the display. Spectra from various detectors are allowed to have free relative normalization.
In most cases, the intrinsic continuum is modelled by Comptonization of blackbody photons in a hybrid plasma with the compps model of Poutanen & Svensson (1996). Compton reflection of the continuum from an ionized, optically thick medium (presumably a cold accretion disc) is also taken into account using the inclination-dependent Green’s functions of Magdziarz & Zdziarski (1995).
In the case of a purely thermal plasma, the Comptonization spectrum is characterized by the Thomson optical depth, , the electron temperature (which we express in energy units, , where is Boltzmann constant), and the temperature of the blackbody seed photons, . We also consider a hybrid electron distribution, which consists of a Maxwellian up to a electron Lorentz factor, , and a power-law of an energy index, , above it. Given these parameters, we calculate the ratio, , of the energy in the non-thermal electrons to that in the thermal ones. In order to quantify the hardness of a given Comptonization spectrum, we also calculate the 4–20 keV power-law photon index, , which we obtain by fitting data simulated with the model of (only) Comptonization.
The reflection is characterized by the solid angle subtended by the reflecting medium, , its ionization parameter, , and the Fe abundance relative to the solar one (Anders & Ebihara 1982), . Here, , is defined as the 5 eV–20 keV luminosity in a power law spectrum and is the density of the reflector located at distance from the illuminating source. We use here the ionization model by Done et al. (1992), which is not applicable to very highly ionized Fe (Ballantyne, Ross & Fabian 2001), but sufficiently accurate at low/moderate ionization, such as that found in our data. The reflector temperature is kept at K, which is about the highest temperature consistent with the model of ionization equilibrium of Done et al. (1992). Compton reflection is accompanied by a fluorescent Fe K line at a rest-frame energy, , and an equivalent width, . Both the line and reflection are relativistically broadened in an accretion disc in the Schwarzschild metric with the emissivity equal to that of a thin disc, extending from an outer radius, (assumed to equal ), to an inner one, , where is in the units of (Fabian et al. 1989). We note here that the values of , , and can be constrained mostly by the OSSE data whereas (for given ) and the reflection/line parameters are determined mostly by either Ginga or RXTE data.
We assume the column density to the source of cm-1. This value was derived from measurements and is consistent with results of other methods, see Z98 and references therein. We assume the distance to the source of kpc (which agrees with both kinematic and extinction measurements, see Z98). In calculations of reflection and relativistic broadening, we assume an inclination of , and we also assume , but we stress that currently there are no constraints on these quantities.
4 Hard state observations
The source flux (extrapolated to the range of 1–1000 keV) in the data sets from 1 to 4 is erg cm-2 s-1, which corresponds to the luminosity of – erg s-1 and per cent of the Eddington luminosity (at kpc and assumed here).
4.1 The Ginga-OSSE data
Results of thermal-Comptonization fits to the Ginga-OSSE data sets 1 and 2 are given in rows 1 and 2 of Table 2, respectively. The former has much better statistics and we discuss it in more detail, but results for the set 2 are very similar. As it was shown by Z98 (see their section 5.1), spectral fits to the Ginga-OSSE data do not constrain the geometry of the Comptonizing plasma and the seed-photon source. Thus, we assume here a simple geometry of a spherical source with seed photons emitted uniformly. We also account for the soft excess present in the data by a blackbody component at the same temperature as that of the seed photons.
We obtain a very good fit to the data set 1, with . The value of much smaller than unity results from relatively large systematic errors added to the Ginga data, see Section 2. The fit components, as well as comparison of this spectrum with spectra from data set 3 and 4 (analyzed in Section 4.2 below) are shown in Fig. 1. Fig. 2 shows the quality of our fits to the data sets 1–4. The parameters of the fit to data set 1 are very similar to those obtained by Z98 and indicative of a typical hard-state spectrum of black-hole binaries. The main difference with respect to the results of Z98 in their table 2 is the plasma temperature, which we fit here at keV, whereas Z98 obtained keV. This difference is due to the model of Comptonization used here being more accurate than that used by Z98.
The fitted relative normalization of OSSE to Ginga is close to unity, and for the sets 1 and 2, respectively. Hereafter, we give the luminosity normalized to the OSSE data. Such a choice is appropriate for investigating a connection between the luminosity and (see Section 4.3) since both are determined mostly by the OSSE data.
| Fit | ||||||||||||
| 1 | 46/81 | |||||||||||
| 2 | 63/81 | |||||||||||
| 3 | 159/130 | |||||||||||
| 4a | 143/148 | |||||||||||
| 4b | 133/147 |

In non-homogenous geometries (such as a corona above a disc), an anisotropy break appears at the peak energy of the second-order scattering for a high enough , with deficiency of photons below the break with respect to the extrapolation of the main power law (e.g., Poutanen & Svensson 1996). In general, the form or the absence of this break may be then used to constrain the geometry. However, the energy range where it may appear in the case of GX 339–4 is similar to that of the soft excess. Consequently, fits assuming different geometries and including the soft excess give very similar statistics [see also discussions in Z98 and Nowak, Wilms & Dove (2002)]. The presence of the soft excess itself is very significant statistically, e.g., for a fit to the set 1 in spherical geometry and without the soft excess.
We also note that our adopted simple model of the soft excess as a blackbody is probably not realistic. In particular, the fitted keV is about twice higher than that of Cyg X-1 in the hard state (Ebisawa et al. 1996). In Cyg X-1, the soft excess is consistent with the presence of both blackbody and its Comptonization in a plasma cloud separate from the main Comptoning source (Di Salvo et al. 2001; Frontera et al. 2001a). This results in the onset of the excess at keV (similar to GX 339–4), but with the excess –3 keV emission being mostly due to Comptonization, not blackbody. Consequently, we also have fitted the soft excess by a second thermal Comptonization component (in addition to the main Comptonization component responsible for the emission at keV). We find the excess can be fitted by emission of either an optically-thick plasma with and keV (using comptt, Titarchuk 1994), or optically-thin one with , keV (using compps). Both models yield , and are analogous to the models of the soft excess in Cyg X-1 by Di Salvo et al. (2001) and Frontera et al. (2001a), respectively. We conclude that the data do not allow us to distinguish between different soft excess models.
As far as the high-energy end of the measured spectrum is concerned, an important issue is the possible presence of a high-energy tail in the electron distribution. We have found that none of the OSSE data considered in this work have enough statistics at high energies to constrain the electron power law index, . We have thus chosen , which is close to the values measured in Cyg X-1, see Gierliński et al. (1999), and McConnell et al. (2000, 2002), and it was used in the theoretical study of WZ01.
We find that the Ginga-OSSE data are consistent with the presence of a high-energy electron tail, but they do not constrain its amplitude. E.g., the non-thermal fraction, , for the data set 1 is . The presence of a tail is indicated by the result of Z98, who obtained when allowing for the presence of non-thermal electrons in their fit to the OSSE data from 1991 September 5–12. However, an alternative explanation of the departure of the spectrum for the thermal one can be a distribution of the plasma parameters, in particular , either in time or in space.
4.2 The RXTE-OSSE data
Since the usable PCA data extend down only to 3 keV (compared to 1.2 keV for the Ginga data), the soft excess cannot be constrained by them at all. Thus, we neglect its presence for all RXTE-OSSE data. Then, the thermal model applied to the data set 4 (fit 4a in Table 2) yields an acceptable . The normalization of the models to the HEXTE A and B clusters relative to the PCA data is and , respectively. On the other hand, the relative normalization of models to the OSSE and PCA data was almost unity, , in spite of the observing time being larger for the OSSE. The results of our fits in the X-ray regime are similar to those of Wilms et al. (1999), who analyzed an RXTE observation that took place three days after ours.
Our data set 4 has the best quality of all those considered here, and allows us to study the presence of a non-thermal electron tail in the source. We have found it improves the fit (4b in Table 2) very significantly, to , with the probability of the fit improvement being by chance of only (using the F-test, Bevington & Robinson 1992). The parameters of the hybrid electron distribution are and keV, which corresponds to ( increases with decreasing either or ). The normalizations of the models to the HEXTE A and B clusters and to the OSSE detector, relative to the PCA data, were , and , respectively.
We caution, however, that the OSSE observation was much longer than the RXTE one, and thus it is possible that the modification of the shape of the OSSE spectrum was due not to non-thermal electrons, but resulted from variations of the plasma parameters in time or in space. We have checked these possibilities. First, we allowed for different values of in thermal fits to the RXTE and OSSE data. This, however, did not change the fit quality, , and the difference between the two values of was only 0.1. We then fit two compps models allowing for different values of and and keeping all other model parameters the same. This significantly improves the fit compared to the previous thermal model, resulting in , only slightly worse than the hybrid fit. The fitted plasma parameters are keV, , and keV, for the two components. Indeed, plasmas in an accretion flow are expected, on average, to increase its temperature with decreasing optical depth as a result of less effective Compton cooling, in agreement with our fit results. Thus, the data set 4 is as consistent with emission from regions of different , as with the presence of a non-thermal tail in a uniform electron population. The latter interpretation may be favoured by the similarity of our result to those of McConnell et al. (2000, 2002) for Cyg X-1.
On the other hand, either thermal or hybrid model applied to the data set 3 yields unacceptable fits, e.g., in the thermal case. However, both the OSSE lightcurve and that from the All-Sky Monitor on board RXTE (available on the public database at xte.mit.edu/ASM_lc.html) have shown that the source was significantly variable on timescale of days during the observation. In particular, the OSSE spectrum underwent a significant softening and brightening during the two-week observation (Smith et al. 1999). The softening implies either or of the plasma decreasing with time, to that during the RXTE observation (three days after the OSSE one). We have accounted for this effect by allowing for different values of and the same (since the RXTE data alone constrain it only weakly) in the fits to the RXTE and the OSSE data. We find the best-fit for the OSSE data of 2.4, indeed larger than the value for the RXTE data (Table 2). Then, the model becomes statistically acceptable, with . The relative normalization of the OSSE and PCA data corresponds to the ratio of the respective model luminosities of 0.67, while the normalizations of the HEXTE A and B data, relative to the PCA data, were and , respectively.
Our results differ significantly from those of Smith et al. (1999) and Böttcher et al. (1999). They analyzed the same data and concluded that the RXTE-OSSE spectrum could be modelled without reflection. In order to reproduce the hardening at keV (characteristic to reflection), they introduced two different power-law models intersecting at keV. We consider this approach (analogous to that of Dove et al. 1998 applied to Cyg X-1) to represent an only phenomenological (i.e., unphysical) description of the spectrum. The hardening at keV is, at very high probability, indeed due to reflection (and not due to a fortitous intersection of two power law components just at 10 keV), as it is present in many other spectra of GX 339–4 as well as in many other Galactic and extragalactic accreting black-hole sources (e.g., Gilfanov et al. 2000; Nandra & Pounds 1994). In fact, the models of Smith et al. (1999) and Böttcher et al. (1999) do include an Fe K line and an Fe K edge, which features naturally appear in the presence of Compton reflection.
In the X-ray data (from both Ginga and RXTE), the reflector was found to be moderately ionized, with erg s-1 cm (see discussion of physical implications in Z98). In the Ginga data, was keV and consistent with modest ionization. On the other hand, it was keV in the RXTE data, where disc ionization was also high. Such an effect was also found in other RXTE observations of GX 339–4 (Wilms et al. 1999; Feng et al. 2001), which may indicate a calibration problem. The equivalent width of the line, eV or so, is roughly consistent with the observed reflection (George & Fabian 1991; Życki & Czerny 1994). We also see in Table 2 that relativistic smearing of the reprocessing features cannot be constrained by the data. Only the RXTE data appear to constrain to .
4.3 A possible relation between the high-energy cutoff and luminosity
The four bright-state observations of GX 339–4 cover a factor of in the luminosity, . On the other hand, all the spectra have very similar values of the X-ray slope, , as seen in Table 2. An interesting issue is then a possible correlation between and the high-energy cutoff in the spectrum. Such a correlation is generally predicted by theories of accretion flows, as a higher accretion rate, , usually yields higher both and . If the X-ray slope is constant, the electron temperature (determining the cutoff) should then decrease, an effect due to an increased efficiency of cooling per electron.
A complication for our data arises due to the possible presence of non-thermal electrons. A purely thermal fit to a hybrid plasma will overestimate the actual , as can be seen by comparing the results of the fits 4a and 4b in Table 2. On the other hand, both thermal and non-thermal electrons Compton scatter photons, and the average electron energy, , is then the crucial factor determining the low-energy slope of the Comptonization spectrum and the position of the high-energy cutoff. These effects are taken into account in the compps model. We can then look directly for a correlation between and using fits with that model. Fig. 3a shows that indeed increases almost monotonically with increasing provided the hybrid fit is used for the data set 4, supporting the presence of a non-thermal tail in that observation. Similarly, shows a decreasing trend with increasing , as shown in Fig. 3b. (See also Zdziarski 2000 for a comparison of the spectra from the sets 1 and 4.)

Zdziarski (1998) considered a simple hot accretion model parametrized by the Compton parameter, ( in the thermal case, and for our data). The Compton parameter determines in turn the X-ray slope, , which is constant among the 4 data sets. For constant , and in the advection and cooling dominated cases, respectively (Zdziarski 1998). The two dependences are shown in Fig. 3a by the solid and dashed curves, respectively. We see that the former appears to fit the data slightly better, but the result is not conclusive. The corresponding relations for are shown in Fig. 3b, where we assumed .
Physically, a constant (or ) corresponds to a constant ratio of the Comptonization luminosity to that in the seed photons (e.g., Beloborodov 1999b), which can be due to a constant geometry of the flow. We also note that the values of in our data are close to the maximum in a hot accretion flow with advection and Comptonization cooling, (Zdziarski 1998), where is the viscosity parameter.
5 The off-state spectrum
During the fifth observation (Table 1), GX 339–4 was by 2 orders of magnitude fainter than during the hard-state observations. At this flux level, GX 339–4 has been classified as being in the off state, see, e.g., Kong et al. (2000). We note here that the object also enters even more quiescent states, e.g., during an observation of Asai et al. (1998), when an upper limit on the source flux was about two orders of magnitude below the flux of our data.
We first fit the data with the same thermal model as for the sets 3–4, in which we assume the relative normalization of the OSSE data to the PCA ones of unity. This provides a statistically acceptable model, with , unconstrained reflection, and a broad range of the allowed electron temperature, keV. However, the spectrum shows a distinct hardening at keV, which in turn requires either a very high temperature of the seed photons, keV, or very strong Compton reflection, . The former is rather unlikely at the observed low luminosity level, erg s-1, and the latter has never been observed in any other black-hole binary. We have performed extensive tests checking also the possibility that the hardening is due to the PCA background subtraction uncertainties. We have concluded it to be unlikely and hereafter consider the hardening to be intrinsic to the source, but still cannot rule out completely a significant effect of the background subtraction.
On the other hand, it is possible that spectrum below several keV is the standard Comptonization power law, and the hardening at higher energies is due to thermal bremsstrahlung. That process is indeed expected to dominate the high-energy spectrum at very sub-Eddington accretion rates, see, e.g., Narayan & Yi (1995), Esin, McClintock & Narayan (1997), Zdziarski (1998). We model the spectrum by the sum of a power law (corresponding to Comptonization at low energies), thermal bremsstrahlung and a Gaussian Fe K line. This yields a good fit, with . The slope of the low-energy power law is whereas the bremsstrahlung temperature is unconstrained. We have assumed it to equal 200 keV (e.g., Esin et al. 1997), which corresponds to erg s-1, and, e.g., and the source radius of , with the bremsstrahlung luminosity scaling approximately as . The data and the model spectrum are shown in Fig. 4.

An important issue here is the origin of the strong Fe K line seen in the data. In the model with bremsstrahlung, the line is narrow at keV with the photon flux of cm-2 s-1, corresponding to eV. If the line were intrinsic, its energy indicating origin in a strongly ionized medium and the large equivalent width would be difficult to explain given the very low luminosity of the source, when the accretion disc is expected to be cold and far away from the black hole. For example, the Fe K emission is weak in a faint hard state of the black-hole binary XTE J1118+480, at an Edddington ratio somewhat higher than that of the present observation (Frontera et al. 2001b).
Thus, we have investigated whether the line may be not intrinsic to GX 339–4. In fact, the source lies close to the direction of the Galactic centre, where the Galactic diffuse emission is strong. Based on the observations of Yamauchi & Koyama (1993), we have estimated the intensity of the Fe 6.7 keV line in the Galactic diffuse emission at the direction of GX 339–4 is cm-2 s-1 deg-2. Given the field of view of the PCA of deg2, the Fe K line seen in our data should be attributed mostly to the Galactic background.
Similarly strong lines were reported and attributed to GX 339–4 in a number of off-state PCA observations (including ours) by Feng et al. (2001), but we believe their origin is also diffuse. Furthermore, Nowak et al. (2002) found that the ratio of the line equivalent width to the relative reflection strength in GX 339–4 was increasing with the decreasing luminosity, which they claimed to represent an argument against simple reprocessing models of those features.
However, we have checked that the effect seen by Nowak et al. (2002) can be explained by the relative contribution of the diffuse 6.7 keV line increasing with the decreasing luminosity. For the two weakest of their observations, where the keV source flux was by factors of and higher than in our observation, the total line equivalent width was eV and eV, respectively. The Galactic diffuse emission would then contribute to the observed at the level of eV and eV, respectively. Then, the agreement between the intrinsic Fe K line equivalent width and the strength of reflection in their data would be significantly improved.
6 The origin of seed photons and constraints on magnetic field
Here, we explore some consequences of the possible presence of a non-thermal electron tail, found statistically necessary in our uniform-plasma model for the fourth observation. A weak non-thermal tail beyond a Maxwellian distribution leads to a moderate hardening of the X-ray power law in the Comptonization spectrum (as repeated scattering off thermal electrons still dominates at those energies) as well as it yields a weak high-energy photon tail at energies (from scattering off non-thermal electrons), see, e.g., WZ01. On the other hand, it can amplify the cyclo-synchrotron emission by a very large factor, due to the fact that the unabsorbed synchrotron radiation is emitted just by the high-energy tail of the electron distribution, which itself is strongly amplified by the tail with respect to the Maxwellian (WZ01). This amplified synchrotron emission within the Comptonizing plasma provides then a copious source of seed photons. For given magnetic field strength, , and the plasma parameters, and , we can calculate the expected self-Compton luminosity, which can exceed the observed in general.
This provides a way to constrain , with the maximum one corresponding to all the seed photons being synchrotron (see section 5.3 of WZ01). Since we know that a cold medium is also present in the plasma vicinity, which medium is also a copious source of soft blackbody photons, the actual value of has to be even lower.
First, we consider a hot accretion flow with nearly-virial ions (e.g., Abramowicz et al. 1995; Narayan & Yi 1995). Following WZ00, we estimate the equipartition field strength within a radius of (where most of the gravitational energy is dissipated) as G. Then, following the calculations in WZ01 and using the hybrid electron distribution fitted to the data set 4 (, Section 4.2), we obtain the synchrotron–self-Compton luminosity of erg s-1, which exceeds the observed one by a factor of . The condition that the predicted luminosity does not exceed the observed leads to G. Although this is a factor of several below the equipartition, various processes dissipating magnetic field can lead to this condition to be satisfied in an actual accretion flow. On the other hand, the self-Compton luminosity from the purely thermal electron distribution fitted to the data set 4 (Section 4.2) would be only erg s-1, i.e., negligibly small compared to the observed . Thus, the non-thermal tail amplifies thus the synchrotron emission by a rather large factor of . Consequently, most of the seed photons for Comptonization have to be emitted by a cold medium if the tail is very weak or absent.
We have also considered the configuration of small, active regions above a cold disc, in which regions dissipation of magnetic field occurs (see WZ00 for details of the assumed model). Assuming that magnetic field dissipates at 10 per cent of the Alfvén speed in 10 active regions of the size cm, the magnetic field required to dissipate enough energy to reproduce the observed would be G. Then, however, the synchrotron–self-Compton luminosity from the hybrid plasma would be times the observed . It would be for G, which field, however, would not be able to dissipate enough energy to power the observed . We thus conclude that the non-thermal electron tail fitted to the data rules out the active regions model for the hard state of GX 339–4. The same conclusion was obtained by WZ01 for the hard state of Cyg X-1. Also, Z98 found the model of active regions for the hard state of GX 339–4 to be ruled out based on independent spectral considerations.
7 The origin of the optical emission in the hard state
GX 339–4 in an X-ray hard state was observed by the Ariel 6 satellite (Ricketts 1983), which observation was in part simultaneous with optical observations, which found the source in a very bright state (Motch, Ilovaisky & Chevalier 1981, 1982). The simultaneous data from 1981 May 28 are analyzed by M83. The 1–50 keV X-ray spectrum of Ricketts (1983) is, in fact, very similar to our Ginga-OSSE spectra. Given our considerations of the origin of the seed photons for Comptonization in the X-ray regime, it is of great interest to check whether the optical emission can be due to the cyclo-synchrotron process in the X-ray emitting plasma. Such origin of the optical emission was suggested by Fabian et al. (1982), but those authors have not performed any calculations of the actual efficiency of that process.
Here, we assume that the plasma temperature and optical depth during the 1981 observation were the same as those obtained from our X-ray data and consider in detail the requirements on other parameters implied by the cyclo-synchrotron origin of the optical emission. Fig. 5 shows the unabsorbed spectrum of GX 339–4 from the IR to soft -rays. The IR/optical data are from Motch et al. (1981), dereddened assuming , and the X-ray spectrum is from Ricketts (1983).

Fig. 5 also shows the Ginga-OSSE spectrum. We see that the spectra from Ginga-OSSE and Ariel 6 are indeed quite similar. Furthermore, the extrapolation to the optical range of the thermal-Compton spectrum fitted to the Ginga-OSSE spectrum lies just a factor of several below the peak of the optical emission. Thus, the optical emission can indeed provide enough seed photons for Comptonization in the X-ray emitting plasma.
We then assume that the uppermost point in the optical spectrum, erg cm-2 s-1 at eV, corresponds to cyclo-synchrotron emission at the turnover frequency (i.e., where the plasma becomes optically thin to synchrotron self-absorption). The corresponding spectrum is shown by the dotted curve in Fig. 5. In the purely thermal case and with the plasma parameters as in Table 2, fit 1, the required magnetic field strength and the size of the plasma (assuming spherical geometry, and calculated as in WZ00) are G and cm, respectively. (These values are each an order of magnitute higher than those given by Fabian et al. 1982.) The required source size is rather large, . It can be reduced if either the magnetic field were larger (corresponding to the synchrotron turnover peak at both higher photon energy and flux, which is allowed by the data), were higher (as its value during the 1981 observation is unknown), or the electron distribution contained a non-thermal tail. The last possibility is, in fact, suggested by our data (Section 4.2), and we consider it in detail. We assume the electron power law index of , as before, and calculate the required values of and as a function of the fraction of energy in the non-thermal electrons, . Results are shown in Fig. 6. We see that is reduced by a factor of several already for , and for , both and are reduced by an order of magnitude. The field expected in a hot accretion disc flow in equipartition with nearly-virial ions would be G and G at at and cm, respectively. Thus, cm, the equipartition G, and represent our preferred set of the plasma parameters of the flow explaining the optical emission.

Interestingly, M83 found an anticorrelation between the optical emission and the 1–13 keV X-rays. An anticorrelation can appear, e.g., if the cyclo-sychrotron emission is variable (due to variability of some plasma parameters) but the total luminosity is approximately constant. The spectral variability would then show a pivot between the optical and X-ray ranges, which naturally leads to an anticorrelation between the respective emission. Furthermore, M83 found that the optical emission leads the X-rays by s. At keV (Table 2), it takes scatterings to upscatter a 2.7 eV photon to 10 keV. At , the source size required for the time lag to be due to the delay during Compton upscattering is then cm, still a plausible value. M83 also found a QPO at s in their data, which, interestingly, corresponds to the Keplerian frequency at a radius of cm (at ). A somewhat lower QPO period, s, was found in the data set 4 (R01). The time scale of flares of 20 ms found by M83 can then correspond to the light travel time across the source. A remaining unresolved issue would be then the lack of an anticorrelation found by M83 between the optical photons and those in the 13–20 keV range. Possibly, that energy range is dominated by Compton reflection showing a different timing behaviour than the primary continuum.
On the other hand, Fabian et al. (1982) proposed that the anticorrelation is due to the X-rays below 13 keV being due to emission of colder clouds surrounding the hot plasma (emitting both the optical emission and X-rays above 13 keV). However, present fits to X-ray spectra of GX 339–4 as well as other black-hole binaries in the hard state tend to rule out this possibility, indicating that the entire X-ray emission is dominated by a single power law (e.g., U94; Z98, Gierliński et al. 1997).
We note that similar optical/X-ray behaviour has been observed from the black-hole binary XTE J1118+480 (Kanbach et al. 2001). Optical emission from that object is very strong, comparable to X-rays, similar to the case of GX 339–4. Also, a similar anti-correlation between optical and X-ray flux was observed, with the optical minimum leading the X-rays maximum by s. Furthermore, the optical emission has a narrower auto-correlation function than that of X-rays, which implies that the primary variability is in the optical band. It is then possible that the optical emission is cyclo-synchrotron, which is then Comptonized up to the X-ray range. The anticorrelation can be explained as in GX 339–4, by spectral pivoting between the optical and X-ray bands.
The site of the hot plasma could be in principle an outflow, possibly a jet, which presence is indicated by radio observations in the hard state (e.g., Fender et al. 1997, 1999; Corbel et al. 2000). In fact, double-peaked emission lines have been found in the soft state of GX 339–4 by Soria et al. (1999), whereas they observed broad, single-peaked profiles in the hard state. They attributed the difference in the line profiles to the origin of the line in the outflow in the hard state and in the disc in the soft state. Also Wu et al. (2001) reached a similar conclusion. On the other hand, there is no natural interpretation to the frequency of the optical QPO in the outflow model. A way to test the origin of the optical radiation would be to measure its polarization, which would be non-zero in an outflow with a directed magnetic field.
While the optical spectrum may in principle be either quasi-thermal and produced in an accretion flow or purely non-thermal and produced in a jet, our fits to the -ray high-energy cutoff confirm that the distribution of electrons producing the main X/-ray continuum in the hard state has a predominantly thermal character (even if it does originate in an outflow, as, e.g., in the coronal outflow model of Beloborodov 1999a). This represents a strong argument against the model of the X/-ray continuum of black-hole binaries as being predominantly non-thermal (Markoff, Falcke & Fender 2001). In that model, the predicted position of the cutoff in the photon spectrum is very sensitive to the magnetic field strength and details of acceleration and cooling. Markoff et al. (2001) deal with this problem by fine-tuning the high-energy cutoff in the distribution of the non-thermal electrons. However, virtually all black-hole binaries in the hard state have remarkably uniform high-energy cutoffs (e.g., Grove et al. 1998; Z98; Gierliński et al. 1997), which thus represents a severe problem for the non-thermal model. On the other hand, this uniformity is accounted for in the thermal (or quasi-thermal) model, in which the Compton cooling (e.g., Zdziarski 1998) and/or pair production (e.g., Malzac, Beloborodov & Poutanen 2001) naturally constrain the electron temperature to –100 keV.
8 X-ray variability
The fractional variability of GX 339–4 in X-rays was investigated by, e.g., Maejima et al. (1984), Nowak et al. (1999), Lin et al. (2000) and R01 and was found to be, in general, energy-dependent. Here, we investigate the energy-dependence of the X-ray variability in the RXTE data of the set 4, which has the best statistics of the data sets studied by us. We use all layers in all available PCA detectors (PCUs 0–4) in order to obtain the best possible photon statistics.
We construct light curves in a number of energy bands with different bin size, . For each lightcurve, we integrate the power density spectrum in the frequency range from 0.001 Hz up to the upper frequency of , from which we obtain the (Poisson-corrected) rms variability divided by the mean count rate. The latter has been corrected for the instrumental background, which is strong, especially at keV. The results are presented in Fig. 7.
A common feature of all the shown dependencies is a decrease of the rms/mean starting at keV. This agrees with a general trend of the fractional rms decreasing with increasing X-ray energy in other black-hole binaries in the hard state (Revnivtsev et al. 2000). In our case, the ratio of the rms at keV to that at keV increases with the increasing upper frequency.

R01 have studied a number of PCA data for GX 339–4 including our set 4 and found that the reflection component is much more variable at Hz than at Hz. This effect will result in a reduction of the rms at keV. However, we have checked that the dependencies of rms on in Fig. 7 cannot be explained just by a superposition of different values of the rms for the power law and for reflection. Also, the ratio of the rms/mean at high energies to that at low energies would decrease with the increasing upper frequency whereas we observe the opposite behaviour.
It is thus more likely that we observe a change of the variability pattern in the Comptonization continuum itself. We propose that it could take place in a similar scenario to that considered in Section 7 when analyzing the optical and X-ray variability. Namely, if the total Comptonization luminosity remains constant but the flux in seed photons varied, this would result in a pivoting of the spectrum. The pivot energy would in general depend on the spectral index and the temperatures of the electrons and the seed photons. Because a part of the spectrum closer to the pivot energy would be less variable than that further away, this scenario can qualitatively reproduce the observed rms/mean for the pivot at keV. The dependence on the upper frequency can be explained if the pivoting occured mostly on long time scales. We note that a similar pivoting is indeed observed in Cyg X-1 on very long time scales (Zdziarski et al. 2002).
We note that the pivoting energy required by the above interpretation is different from that needed for explaining the optical/X-ray anticorrelation by varying cyclo-synchrotron seed photons in Section 7. For that, the pivot energy has to be obviously between the optical and X-ray ranges. Thus, the two interpretations are mutually exclusive. We have also calculated that the pivot at keV implies keV, which rules out the cyclo-synchrotron origin of the seed photons in our data set 4. We point out, however, that the two variability patterns were observed in two different observations of GX 339–4 (separated by 15 years), during which the state of the source could be different. Also, the cause of the dependence of the rms on shown in Fig. 7 could be different than due to pivoting. It can possibly be explained, e.g., by models of magnetic avalanches (e.g., Poutanen & Fabian 1999), which predict complicated patterns of variability of flares on different time scales.
9 Conclusions
We have analyzed four broad band X/-ray spectra of GX 339–4 in the hard state and found that they are well fitted by Comptonization being predominantly thermal, Compton reflection and fluorescent Fe K emission with the strength compatible with that of the reflection. This provides a further confirmation of the dominance of those physical processes in this object, and black-hole binaries in the hard state in general. It also argues against the non-thermal model for the origin of the X/-ray continuum of black-hole binaries by Markoff et al. (2001). We also study time variability in our best X-ray data set, and find a decline of the fractional rms with increasing photon energy, again consistent with previous findings for this source.
Our fifth observation was in an off state, with the X-ray flux two orders of magntitude below that in the hard state. Our major finding here is that the very strong Fe K line present in our data (as well as in other reported proportional-counter off-state observations of this source) is not intrinsic to GX 339–4, but is due to the strong diffuse 6.7 keV emission in the Galactic Center region.
We also obtain a number of other results, which, however, are less unambiguous and require future further studies. This is due to either the limitations of the available data or insufficient theoretical understanding at the present time.
In the off state, we find a spectral hardening at keV, which we find to be incompatible with thermal Comptonization but, rather, compatible with the presence of a bremsstrahlung spectral component. Such a component is in agreement with theoretical predictions, but its unambiguous detection is hampered by the low signal-to-noise ratio and lack of sufficient coverage at high energies.
In the hard state, we find a statistically significant departure from the pure thermal Comptonization spectrum at high energies in our best spectrum. We interpret it as due to the presence of a weak high-energy tail in the electron distribution. However, we cannot rule out an alternative explanation of the effect of the plasma parameters varying in space and/or time.
The possible presence of a high-energy electron tail has implications for the strength of the magnetic field in the source, from the consideration of Compton scattering of the cyclo-synchrotron emission. The magnetic field strength is constrained to values somewhat below equipartition (with hot ions) in the case of a hot accretion disc.
Interestingly, the four hard-state spectra have very similar intrinsic X-ray slope, . On the other hand, the high-energy cutoff energy decreases with increasing luminosity, and, correspondingly, the fitted Thomson optical depth of the plasma increases with luminosity. The significance of the correlations is strongly increased if we allow for the presence of a high-energy electron tail in our model. Such a correlation is in agreement with theoretical predictions for hot accretion flows. Still, it is based only on the four available spectra, and studies of more broad-band spectra with similar X-ray slope, , are highly desirable.
We also study the origin of the strong optical emission found in the past to be associated with the X-ray bright hard state. We find the reported optical emission can be due to the cyclo-sychrotron process, and the emission also provides seed photons for Comptonization. The presence of a high-energy electron tail alleviates constraints on the emission region, allowing it to be smaller and with a weaker field. The reported optical/X-ray anticorrelation can be due to the synchrotron emission being variable at an approximately constant total luminosity, which leads to a spectral pivot between the optical and X-ray bands.
On the other hand, we find the dependence of the rms variability on energy can be also explained by variable seed photons, but the pivot point is then at keV, i.e., in conflict with the previous model. Thus, a comprehensive model of both of these variability patterns requires more complications, probably more source components.
ACKNOWLEDGMENTS
This research has been supported in part by the Foundation for Polish Science and KBN grants 5P03D00121, 5P03D00821 and 2P03D00514. We are very grateful to Mike Revnivtsev for his help with the variability analysis and the suggestion to consider the diffuse Fe K emission. We also thank Bożena Czerny, Chris Done, Piotr Lubiński, Joanna Mikołajewska, Marek Sikora and Piotr Życki for valuable and inspiring discussions.
References
- [1] Abramowicz M. A., Chen X., Kato S., Lasota J.-P., Regev O., 1995, ApJ, 438, L37
- [2] Anders E., Ebihara M., 1982, Geochim. Cosmochim. Acta, 46, 2363
- [3] Arnaud K. A., 1996, in Jacoby G. H., Barnes J., eds., Astronomical Data Analysis Software and Systems V, ASP Conf. Series Vol. 101, San Francisco, p. 17
- [4] Asai K., Dotani T., Hoshi R., Tanaka Y., Robinson C. R., Terada K., 1998, PASJ, 50, 611
- [5] Ballantyne D. R., Ross R. R., Fabian A. C., 2001, MNRAS, 327, 10
- [6] Beloborodov A. M., 1999a, ApJ, 510, L123
- [7] Beloborodov A. M., 1999b, in Poutanen J., Svensson, R. eds., High Energy Processes in Accreting Black Holes, ASP Conf. Ser. Vol. 161, San Francisco, p. 295
- [8] Bevington P. R., Robinson K. D., 1992, Data Reduction and Error Analysis for the Physical Sciences, 2nd Ed., New York, McGraw-Hill
- [9] Böttcher M., Liang E. P., Smith I. A., 1998, A&A, 339, 87
- [10] Bouchet L. et al., ApJ, 1993, 407, 739
- [11] Corbel S., Fender R. P., Tzioumis A. K., Nowak M., McIntyre V., Durouchoux P., Sood R., 2000, A&A, 359, 251
- [12] Di Salvo T., Done C., Życki P. T., Burderi L., Robba N. R., 2001, ApJ, 547, 1024
- [13] Done C., Mulchaey J. S., Mushotzky R. F., Arnaud K. A., 1992, ApJ, 395, 275
- [14] Dove, J. B., Wilms, J., Nowak, M. A., Vaughan, B. A., Begelman, M. C., 1998, MNRAS, 298, 729
- [15] Esin A. A., McClintock J. E., Narayan R., 1997, ApJ, 489, 865
- [16] Fabian A. C., Guilbert P. W., Motch C., Ricketts M., Ilovaisky S. A., Chevalier C., 1982, A&A, 111, L9
- [17] Fabian A. C., Rees M. J., Stella L., White N. E., 1989, MNRAS, 238, 729
- [18] Fender R. P., Spencer E. R., Newell S. J., Tzioumis A. K., 1997, MNRAS, 286, L29
- [19] Fender R. P. et al., 1999, ApJ, 519, L165
- [20] Feng Y. X., Zhang S. N., Sun X., Durochoux P., Chen W., Cui W., 2001, 553, 394
- [21] Frontera F. et al., 2001a, ApJ, 546, 1027
- [22] Frontera F. et al., 2001b, ApJ, 561, 1006
- [23] George I. M., Fabian A. C., 1991, MNRAS, 249, 352
- [24] Gierliński M., Zdziarski A. A, Done C., Johnson W. N., Ebisawa K., Ueda Y., Haardt F., Phlips B. F., 1997, MNRAS, 288, 958
- [25] Gierliński M., Zdziarski A. A., Poutanen J., Coppi P. S., Ebisawa K., Johnson N. W., 1999, MNRAS, 309, 496
- [26] Gilfanov M., Churazov E., Revnivtsev M., 2000, in G. Zhao et al., eds., Proc. 5th CAS/MPG Workshop on High Energy Astrophysics, Beijing, Sci. Techn. Press, p. 114 (astro-ph/0002415)
- [27] Grabelsky D. A. et al., 1995, ApJ, 441, 800
- [28] Grindlay J. E., 1979, ApJ, 232, L33
- [29] Grove J. E., Johnson W. N., Kroeger R. A., McNaron-Brown K., Skibo J. G., 1998, ApJ, 500, 899
- [30] Kanbach G., Straubmeier C., Spruit H. C., Belloni T., 2001, Nat, 414, 180
- [31] Kong A. K. H., Kuulkers E., Charles P. A., Homer L., 2000, MNRAS, 312, L49
- [32] Lin D., Smith I. A., Böttcher M., Liang E. P., 2000, ApJ, 531, 963
- [33] Maejima Y., Makishima K., Matsuoka M., Ogawara Y., Oda M., Tawara Y., Doi K., 1984, ApJ, 285, 712
- [34] Magdziarz P., Zdziarski A. A., 1995, MNRAS, 273, 837
- [35] Makishima K. et al., 1986, ApJ, 308, 635
- [36] Malzac J., Beloborodov A. M., Poutanen J., 2001, MNRAS, 326, 417
- [37] Markert T. H., Canizares C. R., Clark G. W., Lewin W. H. G., Schnopper H. W., Sprott G. F., 1973, ApJ, 184, L67
- [38] Markoff S., Falcke H., Fender R., 2001, A&A, 372, L25
- [39] McConnell M. L. et al., 2000, ApJ, 543, 928
- [40] McConnell M. L. et al., 2002, ApJ, 572, 984
- [41] Motch C, Ilovaisky S. A., Chevalier C., 1981, IAUC 3610
- [42] Motch C, Ilovaisky S. A., Chevalier C., 1982, A&A, 109, L1
- [43] Motch C., Ricketts M. J., Page C. G., Ilovaisky S. A., Chevalier C., 1983, A&A, 119, 171 (M83)
- [44] Nandra K., Pounds K., 1994, MNRAS, 268, 405
- [45] Narayan, R., & Yi, I. 1995, ApJ, 452, 710
- [46] Nowak M. A., Wilms J., Dove J. B., 1999, ApJ, 517, 355
- [47] Nowak M. A., Wilms J., Dove J. B., 2002, MNRAS, 332, 856
- [48] Poutanen J., Svensson R., 1996, ApJ, 470, 249
- [49] Poutanen J., Fabian A. C., 1999, MNRAS, 306, L31
- [50] Press W. H., Teukolsky S. A., Vetterling W. T., Flannery B. P., 1992, Numerical Recipes. Cambridge Univ. Press, Cambridge
- [51] Revnivtsev M., Gilfanov M., Churazov E., 2001, A&A, 380, 520 (R01)
- [52] Revnivtsev M., Borozdin K. N., Priedhorsky W. C., Vikhlinin A., 2000, ApJ, 530, 955
- [53] Ricketts M. J., 1983, A&A, 118, L3
- [54] Smith I. A., Liang E. P., 1999, ApJ 519, 771
- [55] Smith I. A. et al., 1999, ApJ, 519, 762
- [56] Soria R., Wu K., Johnston H. M., 1999, MNRAS, 310, 71
- [57] Sunyaev R. A., Revnivtsev M., 2000, A&A, 358, 617
- [58] Sunyaev R. A., Trümper J., 1979, Nat, 279, 506
- [59] Titarchuk L., 1994, ApJ, 434 313
- [60] Trudolyubov S. et al., 1998, A&A, 334, 895
- [61] Ueda Y., Ebisawa K. Done C., 1994, PASJ, 46, 107 (U94)
- [62] Wardziński G., Zdziarski, A. A., 2000, MNRAS, 314, 183 (WZ00)
- [63] Wardziński G., Zdziarski, A. A., 2001, MNRAS, 325,963; Erratum: 2001, MNRAS, 327, 351 (WZ01)
- [64] Wilms J., Nowak M. A., Dove J. B., Fender R. P., Di Matteo T., 1999, ApJ, 522, 460
- [65] Wilson C. D., Done C., 2001, MNRAS, 325, 167
- [66] Wu K., Soria R., Hunstead R. W., Johnston H. M., 2001, MNRAS, 320, 177
- [67] Yamauchi S., Koyama K., 1993, ApJ, 404, 620
- [68] Zdziarski A. A., 1998, MNRAS, 296, L51
- [69] Zdziarski A. A., 2000, in Martens P. C. H., Tsuruta S., Weber M. A., eds., Highly Energetic Physical Processes and Mechanisms for Emission from Astrophysical Plasmas, IAU Symp. 195, San Francisco, ASP, p. 153 (astro-ph/0001078)
- [70] Zdziarski A. A., Johnson W. N., Done C., Smith D., McNaron-Brown K., 1995, ApJ, 438, L63
- [71] Zdziarski A. A., Poutanen J., Mikołajewska J., Gierliński M., Ebisawa K., Johnson W. N., 1998, MNRAS, 301, 435 (Z98)
- [72] Zdziarski A. A., Lubiński P., Smith D. A., 1999, MNRAS, 303, L11
- [73] Zdziarski A. A., Poutanen J., Paciesas W. S., Wen L., 2002, ApJ, 578, in press (astro-ph/0204153)
- [74] Życki P. T., Czerny B., 1994, MNRAS, 266, 653