AST/RO Observations of CO and Emission toward the Galactic Center Region
Abstract
We present position-velocity strip maps of the Galactic Center region in the CO and transitions observed with the Antarctic Submillimeter Telescope and Remote Observatory (AST/RO) located at Amundsen-Scott South Pole Station. Emission from the two rotational transitions of 12CO was mapped at for , on a grid with a FWHM beamsize of at 806 GHz and at 461 GHz. Previous observations of CO (Martin et al., in preparation) and [C I] (Ojha et al. 2001) emission from this region show that these lines are distributed in a manner similar to CO (Stark et al. 1987); the (CO )/(CO ) line ratio map is almost featureless across the entire Galactic Center region. In contrast, the CO emission from the Galactic Center is strongly peaked toward the Sgr A and Sgr B molecular complexes. A Large Velocity Gradient (LVG) analysis shows that aside from the two special regions Sgr A and Sgr B, the photon-dominated regions within a few hundred parsecs of the Galactic Center are remarkably uniform in mean density and kinetic temperature at to and T = 30 to 45 K. The (CO )/(CO ) line temperature ratios near Sgr B are a factor of two higher than those observed in the nuclear region of the starburst galaxy M82 (Mao et al. 2000), while the CO()/CO() line temperature ratios around Sgr A are similar to M82. The line ratio on large scales from the Galactic Center region is an order of magnitude less than that from M82.
1 Introduction
Observations of photons emitted by the various rotational transitions of the ground vibrational state of carbon monoxide (CO) are the primary means of studying molecular gas in the Galaxy. These spectral lines occur at frequencies of , for the transition from the to the rotational state. Numerous galactic surveys (Combes 1991) have studied the lowest-frequency line. The brightness of this spectral line is roughly proportional to the total molecular column density within the telescope beam (Liszt 1984), provided that the molecular gas has a relatively low density () and column density (). Surveys of the line therefore give an indication of the extent and distribution of molecular material.
A more complete picture of the thermodynamic state of the molecular gas can be gained through observations of other, higher- transitions of CO and the various rotational transitions of the isotopically-substituted species 13CO and C18O. If the brightness of several of these lines is known, models of the excitation and radiative transfer can be used to solve for the density, temperature, and cooling rate of the molecular gas. To avoid degeneracy in this solution, it is valuable to have observations of a line transition from a -state that is sufficiently high in energy such that it is only weakly populated. CO in interstellar molecular gas is typically in a thermodynamic state where the low- transitions are in approximate thermal equilibrium, so that all of the rotational transitions below some -level have roughly the same excitation temperature as the transition. The observable quantity that is usually compared with theory is the ratio of line brightnesses. If only low- lines are observed, it is found that the ratio of these line brightnesses are only weakly dependent on excitation temperature and that maps of all the low- transitions look similar, regardless of variations in excitation temperature across the map. If, however, we observe a transition from a high- level that is not strongly excited, it will be found that the line brightness ratios involving that transition do vary significantly across the map, and the value of the excitation temperature can be more readily determined.
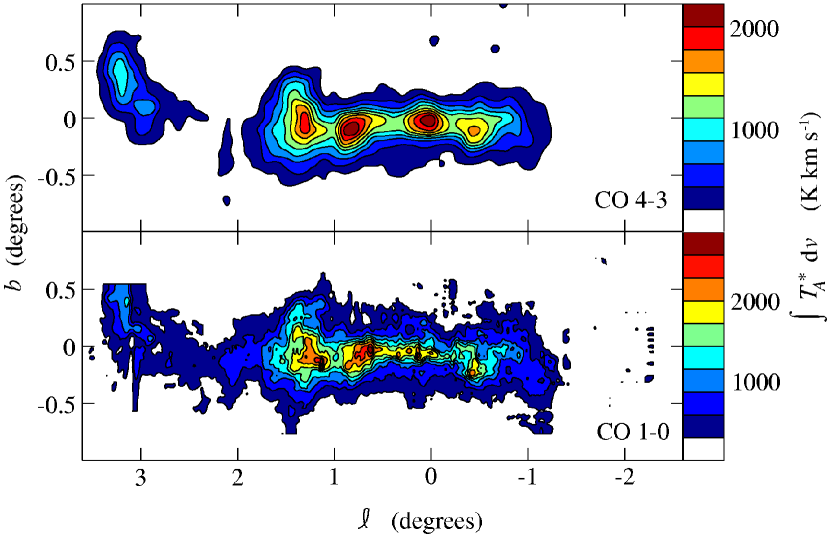
Previous observations with the AST/RO telescope (see Figure 1) have shown that the distribution of the CO line emission is remarkably similar to that of the CO line throughout the Galactic Center region. Previous observations of CO (Harris et al. 1985) showed that line to be unusually bright within of the Galactic Center. In this paper, we report observations of the CO and transitions in a strip map several degrees in extent, and find that the line has significantly lower brightness temperature and significantly different spatial distribution than the lower- CO lines. We can therefore produce a new model of the thermodynamic state of the CO gas along this 1-dimensional strip.
2 Observations
These observations were made from 21 to 25 July 2000 with the Antarctic Submillimeter Telescope and Remote Observatory (AST/RO), located at Amundsen-Scott South Pole Station. AST/RO is a 1.7 m diameter, offset Gregorian telescope capable of observing at wavelengths between 200 m and 1.3 mm (Stark et al. 2001).
The facility dual-channel SIS waveguide receiver (Walker et al. 1992; Honingh et al. 1997) was used in position-switching mode. Emission from the 806.6517 GHz transition of 12CO was mapped at = 0∘, 3.51.5∘ with 1′ spacing and a beam size of . The 461.041 GHz transition of 12CO was observed simultaneously, with a beam size of . The atmosphere-corrected system temperature during the observations ranged from 12,000 to 26,000 K at 806 GHz and from 3000 to 4000 K at 461 GHz. Observing time at each of the 304 observed positions was typically 7 minutes.
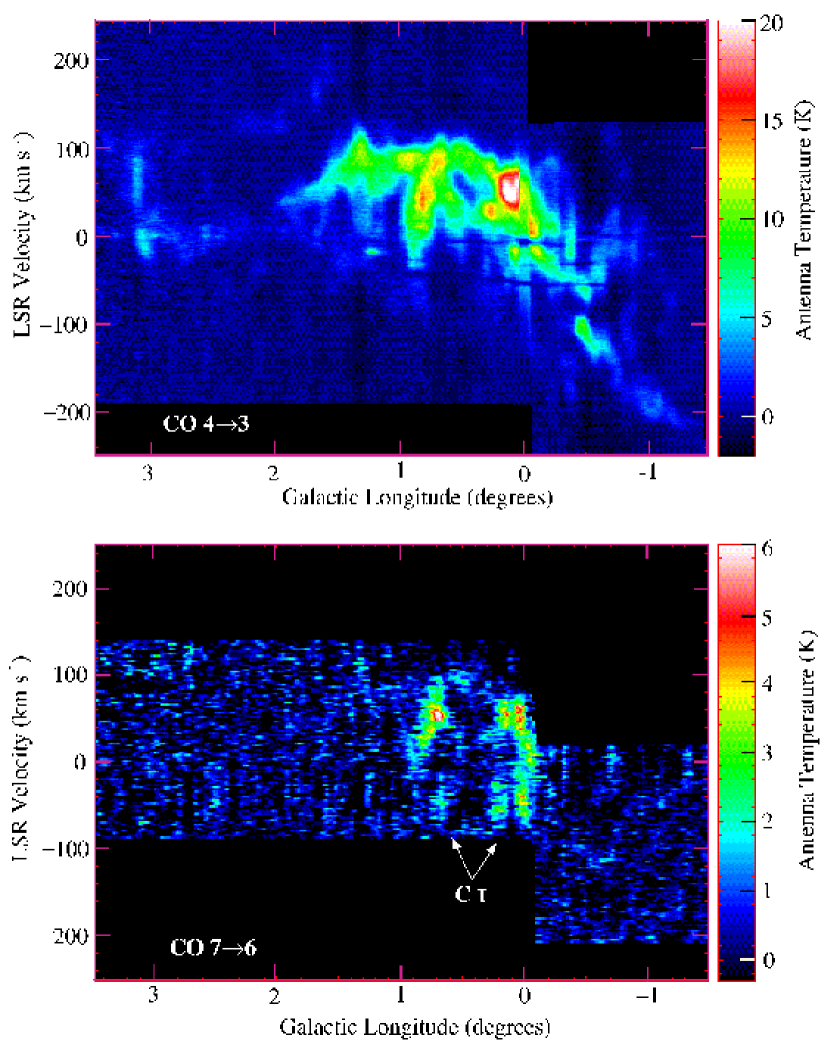
The intermediate frequency output of each receiver was connected to one of two acousto-optical spectrometers (Schieder, Tolls, and Winnewisser 1989) of which 1-MHz-wide channels were in use at 806 GHz and 1-MHz-wide channels were in use at 461 GHz. This configuration provided a velocity range of 225 km s-1 at 806 GHz and 438 km s-1 at 461 GHz. The channel spacing of 0.67 MHz corresponds to a velocity resolution of 0.37 km s-1 at 806 GHz and 0.65 km s-1 at 461 GHz. The high frequency observations were made with the CO line in the lower sideband (LSB). Since the intermediate frequency of the AST/RO system is 1.5 GHz, the line of [C I] at 809.34197 GHz appears in the upper sideband and is superposed on the observed LSB spectrum. The local oscillator frequency was chosen so that the nominal line centers appear separated by 100 km s-1 in the double-sideband spectra. Velocity increases with spectrometer channel number in opposite directions for the two sidebands; in Figure 4, for example, velocity increases to the left for the [C I] line and to the right for the CO. There is 809 GHz [C I] emission superposed on the 806 GHz CO data at most positions where the line is strong. The central channel of the spectrometer was shifted for observations at negative longitudes so that the limited bandpass covered most of the velocity range of known low- emission.
During the time these observations were made, the AST/RO automated calibration system (Stark et al. 1997, 2001) was broken, so that we were not able to make automated sky or receiver measurements. We did, however, make manual measurements once a day. These show that the receiver gain and noise were stable within a few percent throughout the period of the observations. To determine the atmospheric opacity and sky temperature, we used data from the NRAO-CMU tipper in operation at the South Pole. Several times each hour, this instrument makes a calibrated skydip using a broadband room-temperature bolometer. During the subsequent observing season, when the automated calibration system was working, it was determined that the opacity in the narrow 806 GHz band is related to the opacity measured by the NRAO-CMU tipper through the relation (R. A. Chamberlin, private communication):
The relation used to calibrate the 461 GHz data was (Chamberlin 2001):
We used these relations, together with the NRAO-CMU tipper data and thermometer measurements of the outside ambient temperature, to calculate the value we would have gotten if the automated calibration system had been working. These values were edited into a copy of the data file, allowing the data to be treated normally by our data reduction program, COMB, as described in Stark et al. (2001).
3 Results and Analysis
3.1 Strong CO Emission in the Sgr B and Sgr A Complexes
Longitude-velocity maps of the 12CO and distributions are shown in Figure 2. As can be seen by reference to the maps in Figure 1, the strip maps at shown in Figure 2 skirt the outer regions of the strongest CO features, rather than passing through their peak positions. Nonetheless, the CO emission is concentrated in the Sgr B and Sgr A complexes at velocities between 0 and +100 km s-1. Emission features at negative velocities in Figure 2b are contributed by superposed 809 GHz [C I] emission from the upper sideband (see §2).
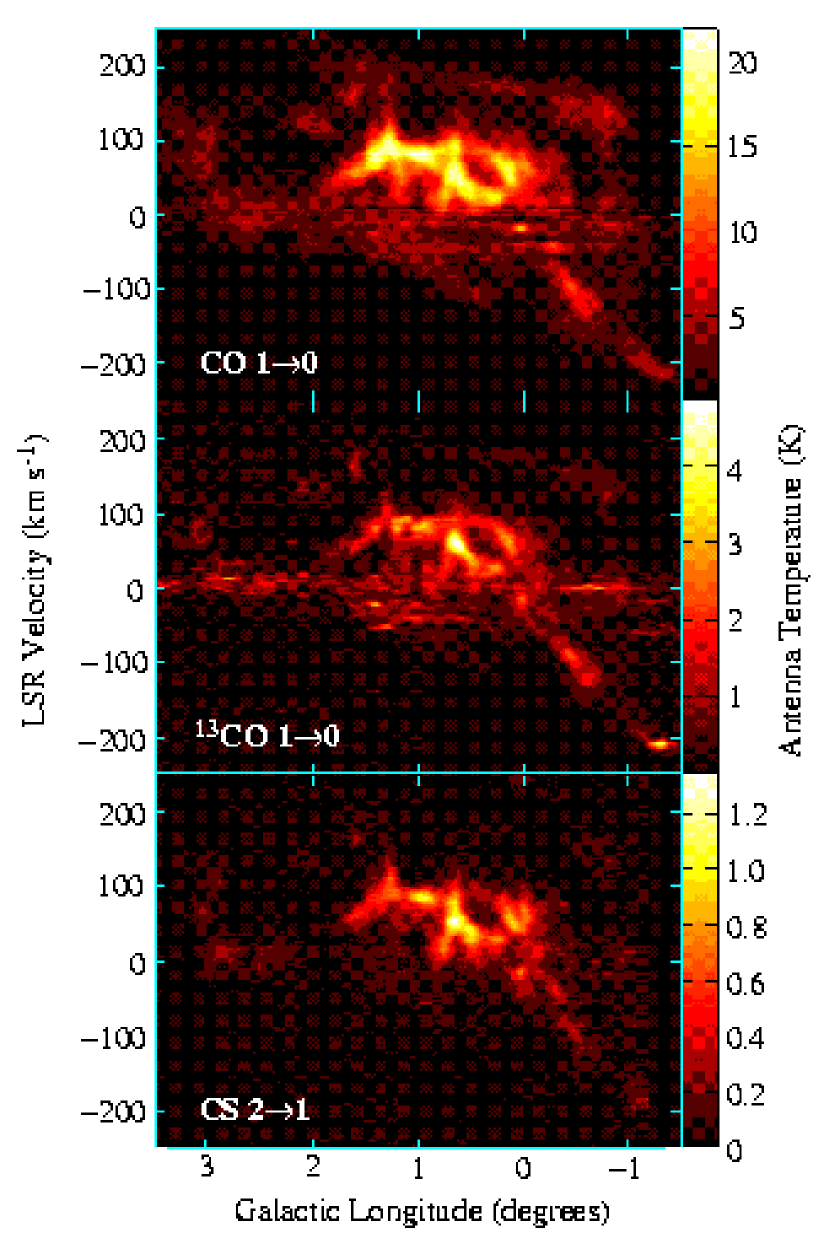
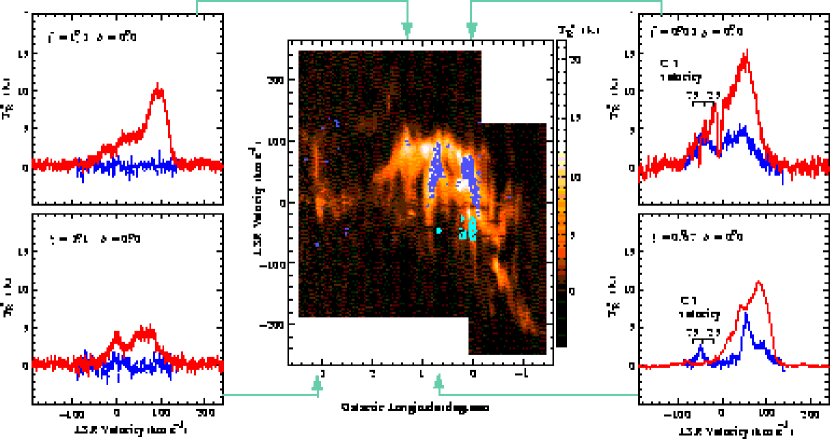
For comparison, longitude-velocity maps of the 12CO , 13CO , and CS data described by Stark et al. (1987) and Bally et al. (1987, 1988) are shown in Figure 3. Again, it is seen that the low- rotational transitions are broadly and similarly distributed, while the CO emission is much more spatially confined. A direct superposition of the 12CO and maps is shown in Figure 4, along with sample spectra at several positions.
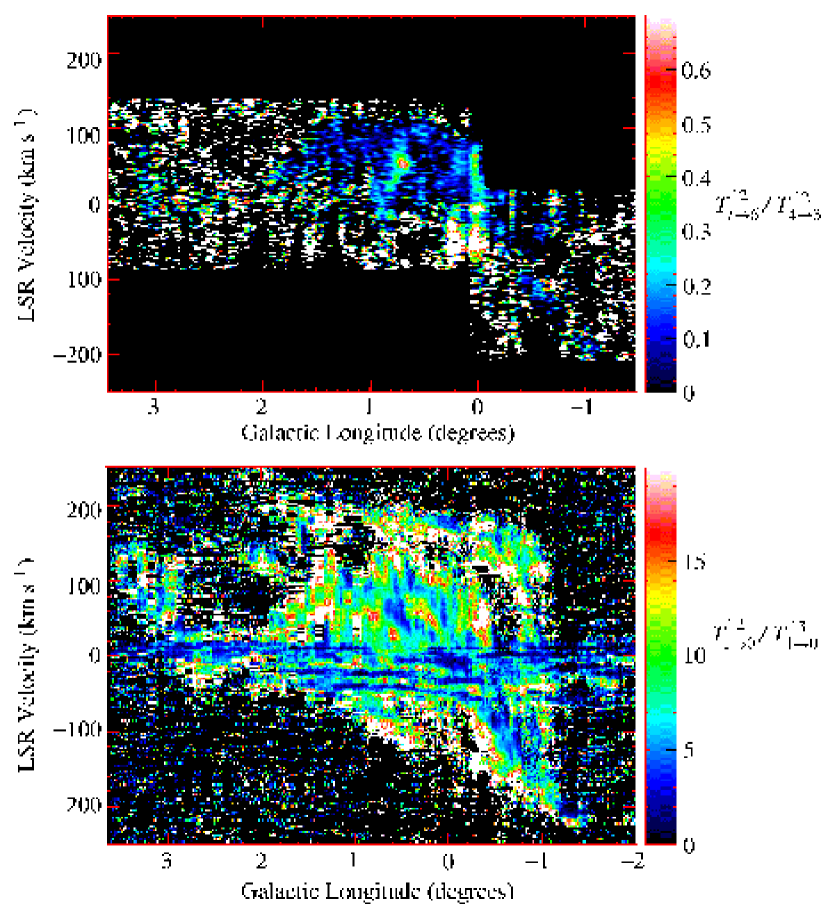
Figure 5 shows maps of 12CO to 12CO () and 12CO to 13CO () line brightness temperature ratios as a function of longitude and velocity in the Galactic Center region. The data were all convolved to the resolution of the 12CO map. The data in this figure fall into three categories: (1) regions where the signal-to-noise ratio is high for both the numerator and the denominator, (2) regions where the signal-to-noise ratio is low for the numerator but high for the denominator, and (3) regions where the signal-to-noise ratio is low for both the numerator and denominator. The fourth possibility, where the signal-to-noise ratio is high for the numerator but low for the denominator, is avoided by placing the higher signal-to-noise data in the denominator. Category 1 data appear as smooth blue, green, yellow, orange, or white areas of the map. In these regions, the temperature ratio is well-determined, and has a fractional error only a little larger than that of the temperature data constituting the numerator. Category 2 data appear as mottled black and blue, since the value of the numerator is small and dominated by noise, while the denominator is some well-determined number ([zero noise]/[number]); the values of the ratio in these regions are near zero, with large fractional error. Category 3 data have a “salt and pepper” black and white appearance as the ratio varies wildly over all possible values, both positive and negative, since both the numerator and denominator have noisy values near zero. Both the value of the ratio and its error are large. In the upper panel of Figure 5, category 1 data can be found in the vicinity of Sgr A and Sgr B; category 2 data is found between Sgr A and Sgr B and to the left of Sgr B; category 3 data occupies the periphery of the figure.
Typical values of at points near Sgr A. At positions on the strip near Sgr B, typical values are higher: , over the velocity range 50 to 85 km s-1 . Average line temperature ratios near Sgr A and Sgr B are summarized in Table 1. The value of near Sgr B is a factor of two higher than the ratio observed in the nuclear region of the starburst galaxy M82 (Mao et al. 2000). Figure 5 shows that aside from the regions near Sgr A and Sgr B, in the region bounded roughly by and 10 km s-1 110 km s-1. This is the area that shows significant CS emission in Figure 3 and is the area that Binney et al. (1991) identify with orbits in the galactic bulge. The 300 parsec ring is the rough parallelogram-shape between =1∘ and =1.8∘, and velocities from 200 to 200 km s-1. The Clump 2 molecular cloud complex is located near =3∘, at velocities from 20 to 150 km s-1 . Both these regions show .
3.2 LVG Analysis Using the Line Ratios
Using the line ratios, we can estimate the kinetic temperature, , and the number density of molecular hydrogen, , through a large velocity gradient (LVG) radiative transfer analysis (Goldreich & Kwan 1974). The LVG approximation simplifies radiative transfer by the assumption that an emitted spectral line photon can only be absorbed “locally”, within a small region whose velocity is similar to the point of emission. This approximation is robust, in the sense that the results of LVG models are often reasonably accurate, even when reality violates the assumptions underlying the models (Ossenkopf 1997). Our LVG radiative transfer code simulates a plane-parallel cloud geometry. It uses the CO collisional rates from Turner (1995) and newly-derived values for the H2 ortho-to-para ratio ( 2) and the collisional quenching rate of CO by H2 impact (Yan, Balakrishnan, & Dalgarno, in preparation). The model has two input parameters: the ratio of 12CO to 13CO abundance, and the ratio , where is the fractional CO abundance parameter and denotes the velocity gradient. The abundance ratio 12CO/13CO is taken to be 25 in the Galactic Center region (Langer & Penzias 1990, 1993). We take , assuming that the 12CO/H2 ratio is 10-4 and the velocity gradient of Galactic Center clouds is typically 3 to 6 km s-1pc-1 (Dahmen et al. 1998).
The line ratios for the LVG analysis and the physical parameters derived are summarized in Table 1. The solution of the radiative transfer equation gives and as a function of the total molecular hydrogen volume density for different values of the gas kinetic temperature, as shown in Figure 6. For each observed point, we can invert these functions to determine the kinetic temperature and molecular hydrogen volume density corresponding to the observed line ratios.
3.3 Temperature and Density Variations in the Galactic Center
The LVG model shows the variation of kinetic temperature across the Galactic Center region. Sgr B, with 0.6, has a kinetic temperature of 72 (2) K, the highest kinetic temperature among the Galactic Center molecular clouds on our strip map. This derived kinetic temperature is consistent with the rotational temperature derived from the NH3(J,K)=(3,3) (1,1) data (Morris 1989) and 13CO survey (Oka et al. 1998). The kinetic temperature at the position nearest Sgr A is 47 () K, lower than Sgr B. If we exclude these two regions, we find that the mean kinetic temperatures is 35 K within the inner 500 parsecs of the Galaxy. In comparison, the dust temperatures in the inner 200 pc are 212 K (Pierce-Price et al. 2000).
The observed line intensities of CO , , and lines, together with the LVG values for the kinetic temperature, allow us to estimate the column densities of all the -states of CO. The CO line is the most luminous CO transition from the Sgr A complex, whereas the line is the most luminous CO transition from the Sgr B complex.
Adopting diameters of 45 pc for Sgr B and 30 pc for Sgr A from inspection of 13CO and CS maps (Bally et al. 1987), and assuming uniform thermodynamic properties within those volumes, we can estimate the properties of those clouds as a whole. The total CO luminosity integrated over the Sgr B complex is ergs s-1 and integrated over the Sgr A complex is ergs s-1. We estimate the total CO rotational line cooling to be ergs s-1 from Sgr B and ergs s-1 from Sgr A. The CO transition accounts for 7.5% of the total CO luminosity from the Sgr A complex (Table 2). At the Sgr B complex, with its higher gas temperature, the CO transition contributes more than 17% of the total CO luminosity. The total estimated energy released by the CO rotational lines toward the Sgr B cloud is, however, similar to that of Sgr A.
Using the derived molecular hydrogen volume density from our LVG analysis and assuming spherical geometry, we can estimate the masses of the Sgr B and Sgr A molecular clouds. Multiplying the LVG-calculated density by the size of Sgr B, we find its mass is approximately 106 , consistent with estimates of 8 105 , derived using dust continuum emission (Lis, Carlstrom, & Keene 1991; Gordon et al. 1993). The CO emitting region towards the Sgr A complex has a mass of .
4 Summary & Conclusions
We have presented maps of the Galactic Center region in the CO and transitions observed with the Antarctic Submillimeter Telescope and Remote Observatory (AST/RO) located at Amundsen-Scott South Pole Station. Comparing the CO , CO , and 13CO maps reveals that the CO emission is concentrated toward the Sgr A and Sgr B complexes. Using an LVG model, we find that the gas kinetic temperatures of the Sgr B and Sgr A complexes are 72 K and 47 K and the gas densities of those regions are 104.15 cm-3 and 103.9 cm-3. Excluding those regions, we estimate the mean kinetic temperature and density throughout the Galactic Center are 30 to 45 K and 103.7±0.05 cm-3. The CO transition accounts for 7.5% of the total CO luminosity from the Sgr A complex. At the Sgr B complex, with its higher gas temperature, the CO transition contributes more than 17% of the total CO luminosity.
The tragic death of Rodney Marks, who was the year 2000 AST/RO Winterover Scientist, occurred just before this observational program. The remaining winterover crew from the Center for Astrophysical Research in Antarctica—Gene Davidson, Greg Griffin, David Pernic, and John Yamasaki—continued AST/RO operations in tribute to Rodney’s memory, allowing these observations to be made. The AST/RO group is grateful for the logistical support of the National Science Foundation (NSF), Antarctic Support Associates, Raytheon Polar Services Company, and the Center for Astrophysical Research in Antarctica during our polar expeditions. SK thanks Min Yan for LVG analysis and Wilfred Walsh for his helpful comments on the manuscript. This work was supported in part by United States National Science Foundation grant DPP88-18384, and by the Center for Astrophysical Research in Antarctica and the NSF under Cooperative Agreement OPP89-20223.
References
- (1)
- (2) Bally, J., Stark, A. A., Wilson, R. W., & Henkel, C. 1987, ApJS, 65, 13
- (3)
- (4) Bally, J., Stark, A. A., Wilson, R. W., & Henkel, C. 1988, ApJ, 324, 223
- (5)
- (6) Binney, J., Gerhard, O. E., Stark, A. A., Bally, J., & Uchida, K. I. 1991, MNRAS, 252, 210
- (7)
- (8) Chamberlin, R. A. 2001, JGR, 106, 20101
- (9)
- (10) Combes, F. 1991, ARA&A, 29, 195
- (11)
- (12) Dahmen, G., Huttemeister, S., Wilson, T. L., and Mauersberger, R. 1998, A&A, 331, 959
- (13)
- (14) Goldreich, P., & Kwan, J. 1974, ApJ, 189, 441
- (15)
- (16) Gordon, M. A., Berkermann, U., Mezger, P. G., Zylka, R., Haslam, C. G. T., Kreysa, E., Sievers, A., & Lemke, R. 1993, A&A, 280, 208
- (17)
- (18) Harris, A. I., Jaffe, D. T., Silber, M., & Genzel, R. 1985, ApJ, 294, L93
- (19)
- (20) Honingh, C. E., Haas, S., Hottgenroth, D., Jacobs, K., & Stutzki, J. 1997, IEEE Trans. Appl. Superconductivity, 7, 2582
- (21)
- (22) Langer, W. D., & Penzias, A. A. 1990, ApJ, 357, 477
- (23)
- (24) Langer, W. D., & Penzias, A. A. 1993, ApJ, 408, 539
- (25)
- (26) Lis, D. C., Carlstrom, J. E., & Keene, J. 1991, ApJ, 380, 429
- (27)
- (28) Liszt, H. S. 1984, Comm. Ap., 10, 137
- (29)
- (30) Mao, R. Q., Henkel, C., Schulz, A., Zielinsky, M., Mauersberger, R., Storzer, H., Wilson, T. L., & Gensheimer, P. 2000, A&A, 358, 433
- (31)
- (32) Morris, M. 1989, in The Center of the Galaxy, IAU Symp. 136, ed. M. Morris, (Kluwer: Dordrecht), 171
- (33)
- (34) Ojha, R., Stark, A. A., Hsieh, H. H., Lane, A. P., Chamberlin, R. A., Bania, T. M., Bolatto, A. D., Jackson, J. M., & Wright, G. A. 2001, ApJ, 548, 253
- (35)
- (36) Oka, T., Hasegawa, T., Sato, F., Tsuboi, M., & Miyazaki, A. 1998, ApJS, 118, 455
- (37)
- (38) Ossenkopf, V. 1997, New Astronomy, 2, 365
- (39)
- (40) Pierce-Price, D., et al. 2000, ApJ, 545, L121
- (41)
- (42) Schieder, R., Tolls, V., & Winnewisser, G. 1989, Experimental Astronomy, 1, 101
- (43)
- (44) Stark, A. A., Bally, J., Knapp, G. R., & Wilson, R. W. 1987, in Molecular Clouds in the Milky Way and External Galaxies, Lecture Notes in Physics 315, eds. R. L. Dickman, R. L. Snell, & J. S. Young, (Springer-Verlag: Berlin), 303
- (45)
- (46) Stark, A. A., Chamberlin, R. A., Ingalls, J. G., Cheng, J., & Wright, G. A. 1997, Rev. Sci. Instrum., 68, 2200
- (47)
- (48) Stark, A. A., et al. 2001, PASP, 113, 567
- (49)
- (50) Turner, B. E. 1995, ApJ, 455, 556
- (51)
- (52) Walker, C. K., Kooi, J. W., Chan, M., LeDuc, H. G., Schaffer, P. L., Carlstrom, J. E., & Phillips, T. G. 1992, Int. J. IR MM Waves, 13, 785
- (53)
| Parameter | Sgr A | Sgr B |
|---|---|---|
| Velocity Range (km s-1 ) | 10 80 | 50 85 |
| (H2) (cm-3) | 103.9±0.05 | 104.15±0.05 |
| (K) | ||
| Mass H2 () | 0.4 106 | 1.0 106 |
| Size (pc) | 30 | 45 |
| Sgr A | Sgr B | |
|---|---|---|
| (CO 76) (ergs s-1) | 1.501036 | 5.071036 |
| (CO 43) (ergs s-1) | 4.731036 | 5.591036 |
| (CO total) (ergs s-1) | 2.001037 | 2.921037 |
| (C I total) (ergs s-1) | 5.461035 | 8.961035 |