Strongly absorbed quiescent X-ray emission from the X-ray transient XTE J0421+56 (CI Cam) observed with XMM-Newton
We have observed the X-ray transient XTE J0421+56 in quiescence with XMM-Newton. The observed spectrum is highly unusual being dominated by an emission feature at 6.5 keV. The spectrum can be fit using a partially covered power-law and Gaussian line model, in which the emission is almost completely covered (covering fraction of ) by neutral material and is strongly absorbed with an NH of () 1023 atom cm-2. This absorption is local and not interstellar. The Gaussian has a centroid energy of keV, a width keV and an equivalent width of eV. It can be interpreted as fluorescent emission line from iron. Using this model and assuming XTE J0421+56 is at a distance of 5 kpc, its 0.5–10 keV luminosity is erg s-1. The Optical Monitor onboard XMM-Newton indicates a V magnitude of . The spectra of X-ray transients in quiescence are normally modeled using advection dominated accretion flows, power-laws, or by the thermal emission from a neutron star surface. The strongly locally absorbed X-ray emission from XTE J0421+56 is therefore highly unusual and could result from the compact object being embedded within a dense circumstellar wind emitted from the supergiant B[e] companion star. The uncovered and unabsorbed component observed below 5 keV could be due either to X-ray emission from the supergiant B[e] star itself, or to the scattering of high-energy X-ray photons in a wind or ionized corona, such as observed in some low-mass X-ray binary systems.
Key Words.:
Accretion, accretion disks – Stars: individual: XTE J0421+56 – X-rays: general1 Introduction
XTE J0421+56 was discovered by the All-Sky Monitor onboard RXTE as a soft X-ray transient during an outburst in 1998 March 31 (Smith et al. 1998). This outburst was observed by CGRO (Paciesas & Fishman 1998), RXTE (Revnivtsev et al. 1999; Belloni et al. 1999), ASCA (Ueda et al. 1998) and BeppoSAX (Frontera et al. 1998; Orr et al. 1998). The source brightened rapidly, reaching an intensity of 2 Crab after a few hours, then quickly decayed with an initial e-folding time of only 0.6 days before reaching quiescence in less than 2 weeks. This was the fastest rise and decay of any outburst from a soft X-ray transient (see e.g., Chen et al. 1997). The outburst X-ray spectra from XTE J0421+56 are complex and can not be fit by any of the models usually applied to soft X-ray transients. The ASCA outburst spectrum was fitted with a two temperature optically thin thermal model and an additional broad Fe-K emission line at 6.4 keV. Both BeppoSAX outburst spectra were described using a two temperature bremsstrahlung model and narrow emission line features identified with O, Ne/Fe-L, Si, S, Ca and Fe-K (Orr et al. 1998). Emission lines at energies of 6.5 keV and 8 keV are detected in the RXTE outburst spectra.
Optical and radio observations allowed XTE J0421+56 to be rapidly identified with CI Cam, also known as MWC 84 (Wagner & Starrfield 1998; Hjellming & Mioduszewski 1998; Robinson et al. 1998). It is a frequently observed source in ultra-violet (UV), optical and infra-red (IR) wavelengths. Its V magnitude over long term observations shows a 0.4 magnitude amplitude variability and has a mean value of 11.6, both before (1989–1994) and after (1998–1999) the 1998 X-ray outburst (Bergner et al. 1995; Clark et al. 2000). CI Cam is a supergiant B[e] star (Clark et al. 1999; Robinson et al. 2002), or a sgB[e] star, following the notation of Lamers et al. (1998), i.e. a supergiant showing the B[e] phenomenon. The B[e] phenomenon concerns many objects of different masses and evolutionary phases (see e.g., Lamers et al. 1998). One of the common properties of stars exhibiting the B[e] phenomenon is the presence of forbidden emission lines in their optical spectra (the notation “[e]” refers to the one used for forbidden lines). Another common property is to show a strong IR excess attributed to hot circumstellar dust. In these respects, stars with the B[e] phenomenon clearly differ from the ordinary Be stars which are rapidly rotating stars near the main sequence losing mass in an equatorial wind. In practice, the spectroscopic and photometric properties of stars with the B[e] phenomenon are also easily distinguished from those of ordinary Be stars. CI Cam/XTE J0421+56 is the first high-mass X-ray binary (HMXB) with a sgB[e] mass donor companion. Another source suspected to be a HMXB with a mass donor showing the B[e] phenomenon is the optical/X-ray source HD 34921/1H 0521+37 (Clark et al. 1999). Adopting the classification criteria and notation of Lamers et al. (1998), Clark et al. (1999) identify the companion star in this system as an “unclB[e] star” (unclassified B[e] star).
Optical high-dispersion spectroscopy of CI Cam led Robinson et al. (2002) to the conclusion that the sgB[e] star emits a two component wind. One component is a hot, high-velocity wind. The other component is a cool, low-velocity and very dense (electron number density log ne ) wind. The wind is roughly spherical and continuously replenished. The mass-loss rate due to the wind is very high: M⊙ yr-1. This wind fills the space around the sgB[e] star and, from the size of the IR-emitting dust shell, extends to a radius between 13 and 50 AU. Thus, the circumstellar material around CI Cam is much denser, far more extended, and much less confined to the equatorial plane than the circumstellar material around a Be star. The passage of the compact X-ray source through such a complex and dense environment is likely to strongly affect the X-ray properties of the source.
Within this picture, Robinson et al. (2002) suggest that the 1998 outburst was caused by the same disk instability mechanism responsible for the outbursts in X-ray novae, i.e. by an instability in the accretion disk around the compact object (see e.g., Lasota 2001). It would thus differ from the outbursts observed in ordinary Be HMXB that recur at multiples of the orbital period, when the compact object comes close to the Be star at periastron and plunges into its equatorial wind.
The distance to XTE J0421+56 is uncertain. Based on optical spectroscopic properties, on radial velocity measurements of CI Cam and on considerations about the structure of the Galaxy, Robinson et al. (2002, Sect. 2.3) estimate that the distance to the source is much larger than the 2 kpc previously considered. Robinson et al. (2002) use a distance of 5 kpc and note that it is likely to be a lower limit to the true distance which could be up to 10 kpc. In this paper, we assume a distance of 5 kpc. This distance makes XTE J0421+56 among the most luminous transients. The 2–25 keV luminosity at the peak of the outburst was erg s-1, assuming the revised distance of 5 kpc (Orlandini et al. 2000; Robinson et al. 2002).
The unusual nature of CI Cam makes the interstellar absorption towards the star difficult to estimate. From an UV spectrogram, Robinson et al. (2002) derive a differential extinction E(B–V) of , but do not attempt to separate circumstellar from interstellar extinction. From an analysis of diffuse interstellar bands in the optical spectrum of CI Cam, Clark et al. (2000) derive an interstellar E(B–V) of and an of , which implies an interstellar X-ray absorption, NH, of 1021 atom cm-2 (Parmar et al. 2000, Sect. 3). Extinction at soft X-ray wavelengths yielded an NH of 1022 atom cm-2 near the peak of the outburst, and the NH decreased to 2.2 1021 atom cm-2 as XTE J0421+56 approached quiescence (Belloni et al. 1999). This rapid change in the X-ray extinction, as well as the change in the IR flux after the outburst (Clark et al. 2000), indicate that much of the extinction to CI Cam is local, not interstellar (Robinson et al. 2002).
No bursts, pulsations or quasi-periodic oscillations have been detected from XTE J0421+56 (Belloni et al. 1999). The large ratio of peak to quiescent luminosity is taken as evidence for the compact object being a black hole (Robinson et al. 2002). Furthermore, CI Cam has been detected as a relatively bright radio source (Hjellming & Mioduszewski 1998) which is more typical of black hole candidates than neutron star systems (see Belloni et al. 1999, Sect. 5).
XTE J0421+56 was observed in quiescence by BeppoSAX on 1998 September 03, 1999 September 23 and 2000 February 20 (Orlandini et al. 2000; Parmar et al. 2000). In 1998, the source was soft (power-law photon index, , of ) with a low NH of ) 1021 atom cm-2. In 1999, the source had hardened ( ) and brightened and became strongly absorbed with an NH of 1023 atom cm-2. There is evidence for a narrow emission line in both spectra at 7 keV. In 2000, the source was not detected. At 5 kpc, the 1–10 keV luminosities were , , and erg s-1, in 1998, 1999, and 2000, respectively. These results are summarized in Table 1.
| Obs. | Year | NH | L | Ref. |
|---|---|---|---|---|
| (atom cm-2) | (erg s-1) | |||
| SAX | 1998 | [1], [2] | ||
| SAX | 1999 | [2] | ||
| SAX | 2000 | [2] | ||
| XMM | 2001 | [3] |
Here, we report on the XMM-Newton observation of XTE J0421+56 in quiescence performed on 2001 August 19. We present and discuss the nature of the X-ray spectrum and derive the V magnitude of the source using the Optical Monitor.
2 Observations and data analysis
The XMM-Newton Observatory (Jansen et al. 2001) includes three 1500 cm2 X-ray telescopes each with an European Photon Imaging Camera (EPIC, 0.1–15 keV) at the focus. Two of the EPIC imaging spectrometers use MOS CCDs (Turner et al. 2001) and one uses pn CCDs (Strüder et al. 2001). Reflection Grating Spectrometers (RGS, 0.35–2.5 keV, den Herder et al. 2001) are located behind two of the telescopes. In addition, a coaligned optical/UV Monitor (OM, 160–600 nm, Mason et al. 2001) is included as part of the payload.
The region of sky containing XTE J0421+56 was observed by XMM-Newton on 2001 August 19 between 07:05 and 16:16 UTC.
2.1 X-ray observations
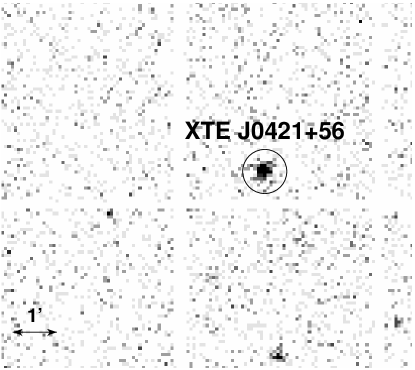
The X-ray cameras were operating in their Prime Full Window mode with Medium thickness filters. We used the X-ray data products generated by the Pipeline Processing Subsystem in September 2001. We further filtered these products using the Science Analysis Software (SAS) version 5.1.0111 After the public release of SAS version 5.3.0, we used this latest version and re-extracted the pn spectrum. The obtained spectrum is identical to the one obtained using SAS version 5.1.0. and especially the tasks evselect and xmmselect. Electronic noise and hot or flickering pixels were rejected. The observation is contaminated by high backgrounds intervals due to solar activity. We excluded these times by selecting intervals where the overall keV pn count rate was . Source counts were extracted in a 30′′ radius circular region centered on XTE J0421+56. The source is close to a chip border in the pn detector. Background counts were obtained from a circular region of 90′′ radius offset from the source position. For the pn, single and double pixel events were selected (patterns 0 to 4). For the MOS, events corresponding to patterns from 0 to 12 were selected. The exposure after applying these filtering criteria is 12 ks. This is substantially below the expected exposure due to the removal of intervals of high solar activity. Fig 1 shows the EPIC pn image of the region of sky containing XTE J0421+56. The source, although faint, is clearly detected.
We next extracted spectra. For the pn, subtracting the source and background count rates gives a net count rate of s-1 in the 0.1–12 keV energy range, where the source is detected. This corresponds to 280 net counts detected. We used the standard pn response matrix file epn_ff20_sY9_medium.rmf. Approximately 60 net counts are detected in each MOS camera. We used the response matrix files m1_medv9q19t5r5_all_15.rsp and m2_medv9q19t5r5_all_15.rsp for MOS 1 and MOS 2, respectively. In order to ensure applicability of the statistic with so few counts, we rebinned the MOS and pn spectra such that at least 25 net counts per bin were present. The resulting MOS spectra have 2 bins and the pn spectum has 11 bins, allowing only simple models to be tested. XTE J0421+56 is not detected in the RGS. Modeling of the spectra was carried out using XSPEC version 11.1.0. All spectral uncertainties are given at 90% confidence and upper limits at 95% confidence.
2.2 Optical observations
The OM was operating in its default Imaging Mode. Five consecutive exposures of 1000 s were obtained through the V filter (510-580 nm), followed by five consecutive exposures of 4540 s through the UVW1 filter (245-320 nm). We have analyzed 2′2′ high resolution images centered on XTE J0421+56.
Instrumental magnitudes of the source were extracted for each image using DAOPHOT. We computed the average instrumental magnitudes for both filters and used these values to correct the average V instrumental magnitude into a standard V magnitude of the Johnson’s UBV system. We used the color transformation relation shown e.g., in Antokhin et al. (2002) and the coefficients from the Current Calibration File OM_COLORTRANS_0006.CCF.
3 Results
3.1 The X-ray spectrum
The combined MOS 1, MOS 2 and pn spectrum of XTE J0421+56 is shown in Fig. 2. Its shape is highly unusual. It is clearly dominated by an emission feature peaking at 6.5 keV222As XTE J0421+56 is located near a chip border in the pn detector, which could produce artefacts in the spectrum (see e.g., Borozdin & Trudolyubov 2002), we checked that the 6.5 keV feature was not due to the closeness of the edge. We extracted a pn spectrum from a 30′′ radius circle located at the same distance from the edge as the source. This spectrum does not show a feature around 6.5 keV, indicating that this feature is not an artefact caused by the closeness to a chip border..
We first tried to fit the spectrum with simple descriptive models. A model consisting of a power-law with a photon index, -0.9, to account for the low-energy feature of the spectrum (5 keV) and a Gaussian to account for the high-energy feature (above 5 keV) does not provide an acceptable fit to the data giving a reduced () of 2.07 for 10 degrees of freedom (d.o.f.). A similarly poor result is obtained when including photo-electric absorption (phabs within XSPEC) to this model in order to account for an absorption of the X-rays. Both a broad and a narrow component seem to be needed to account for the high-energy feature. A relatively good ( of 1.56 for 8 d.o.f.) description of the spectrum can be obtained using a model consisting of a power-law ( 1.9) to account for the low-energy feature plus another power-law ( -1.3) to account for the broad high-energy feature and a Gaussian at 6.4 keV to account for the narrow high-energy feature.
We then adopted a different fitting approach by modeling the broad high-energy feature as a highly absorbed continuum component. We tried a model consisting of a power-law for the low-energy feature, plus a power-law and a Gaussian both modified by absorption from neutral material for the high-energy feature (model powerlaw+phabs(powerlaw+gaussian) within XSPEC). This model fits the spectrum relatively well, with a of 1.04 for 7 d.o.f.. The best-fit parameters for this model are given in Table 2. We note that, without the Gaussian in the model, the fit is poor, with a of 2.19 for 10 d.o.f.. An F-test indicates that the probability, Prej, of rejecting the hypothesis that the fit is better including the Gaussian is 4.3%. This indicates that the Gaussian is significant at 95.7% confidence. In order to account for potential absorption of the first power-law emission by the line of sight interstellar medium, we included an additional photo-electric absorption component (phabs within XSPEC) to the previous model. The resulting model (phabs(powerlaw+phabs(powerlaw+gaussian)) fits the spectrum relatively well, with a of 1.22 for 6 d.o.f., although an F-test indicates that the addition of the absorption component does not improve the fit (Prej of 99.9%). The best-fit parameters obtained using this model are also given in Table 2. The NH of the additional absorption component is 1.8 1021 atom cm-2. The other parameter values are consistent with those obtained previously without the additional phabs component.
We then tried to fit the spectrum using a partially covered power-law and Gaussian model, the pcfabs(powerlaw+gaussian) model within XSPEC. In this model, some absorbing material covers a fraction (from 0 to 1) of the power-law and Gaussian emission. The absorption is by neutral material with solar abundances and uses cross-sections from Balucinska-Church & McCammon (1992). This model fits the spectrum very well with a of 1.04 for 8 d.o.f. The best-fit parameters are given in Table 2. Without the Gaussian in the model, the fit is poor, with a of 2.47 for 11 d.o.f. An F-test indicates that the probability, Prej, of rejecting the hypothesis that the fit is better including the Gaussian is 1.8%. This indicates that the Gaussian is significant at 98.2% confidence. In order to account for potential interstellar absorption of the uncovered component of the emission, we included an additional photo-electric absorption component to the previous model. The resulting model (phabs(pcfabs(powerlaw+gaussian)) fits the spectrum relatively well, with a of 1.18 for 7 d.o.f., although an F-test indicates that the addition of the absorption component does not improve the fit, with Prej of 99.7%. The best-fit parameters obtained using this model are given in Table 2. The NH of the additional absorption component is 2.0 1021 atom cm-2. The other parameter values are consistent with those obtained previously, without the additional phabs component.

| MOS 1 + MOS 2 + pn spectrum | ||
|---|---|---|
| Model | pl+phabs(pl+gauss) | phabs(pl+phabs(pl+gauss)) |
| (d.o.f.) | 1.04 (7) | 1.22 (6) |
| NH (atom cm-2) | … | |
| NH (atom cm-2) | () | () |
| Gaussian energy | keV | keV |
| Gaussian width | keV | keV |
| Gaussian equivalent width | eV | eV |
| Model | pcfabs(pl+gauss) | phabs(pcfabs(pl+gauss)) |
| (d.o.f.) | 1.04 (8) | 1.18 (7) |
| NH (atom cm-2) | … | |
| NH (atom cm-2) | () | () |
| CvrFract | ||
| Gaussian energy | keV | keV |
| Gaussian width | 0.28 keV | 0.28 keV |
| Gaussian equivalent width | eV | |
Summarizing, we have obtained acceptable fits to the combined pn and MOS spectra of XTE J0421+560 in quiescence using two different two component models. One component is strongly absorbed and the other may be unabsorbed, or only slightly absorbed (Table 2). In both models, the shape of the high-energy continuum is dominated by absorption resulting in a strong cutoff above 7.1 keV due to neutral iron absorption edge. This produces a very sharply peaked spectral feature which resembles a broad emission line. In addition, there is some evidence for the presence of an additional narrow emission feature at an energy of 6.4 keV. (This feature is required at 98.2% confidence in the case of the partially covered power-law and Gausssian model). The two models presented in Table 2 differ by how the low-energy component is modeled. This is either by partial covering, in which case the low-energy component is constrained to have the same underlying spectral shape as the absorbed high-energy component, or by a power-law with an unconstrained slope. For completeness, Table 2 lists the results if additional low-energy absorption is included to account for interstellar absorption. However, the fits do not require such absorption, and the upper-limits are consistent with that expected from the likely interstellar values.
The partially covered power-law and Gaussian model and the power-law plus absorbed power-law and Gaussian model give equally good fits with a of 1.04 for 8 d.o.f.. Fig. 3 shows the former model fit to the pn spectrum only for clarity. In this model , the power-law and Gaussian emissions are almost completely covered (with a covering fraction of 0.98) by neutral material and strongly absorbed with an NH of () 1023 atom cm-2. The equivalent width of the Gaussian line feature is eV. This model is equivalent to the sum of an absorbed (and covered) plus an unabsorbed (and uncovered) component with the same spectral shape. The contributions of both these components are shown separately in the right panel of Fig. 3. The unabsorbed omponent (dashed line) dominates the emission 5 keV. We refer to this component as the low-energy component. On the contrary, the absorbed component (dotted line) clearly dominates the emission 5 keV. We refer to this component as the high-energy component. Using the partially covered power-law and Gaussian model, we derive a 0.5–10 keV absorbed flux of erg cm-2 s-1 and a unabsorbed flux of erg cm-2 s-1 by setting NH to 0. This corresponds to an unabsorbed luminosity of dkpc2 erg s-1 at a distance of dkpc given in kpc, and to a unabsorbed luminosity of erg s-1, at a distance of 5 kpc. The low-energy component contributes 9.8% to the total absorbed flux in the 0.5–10 keV range. The 1–10 keV luminosity is given in Table 1 for comparison with previous BeppoSAX observations of XTE J0421+56 in quiescence.


3.2 The V magnitude
The average UVW1 instrumental magnitude of XTE J0421+56 during the XMM-Newton observation is . The average standard V magnitude is .
4 Discussion
4.1 The V magnitude
Optical observations of XTE J0421+56 (CI Cam) exist prior to the 1998 outburst. A V magnitude of 11.4 is attributed to CI Cam during observations made in the 1970’s (Allen & Swings 1976).
Long term observations of the source were carried out between 1989 and 1994. CI Cam covered a range of V magnitudes between and (47 data points), thus showing a 0.4 magnitude amplitude variability on a day-to-day timescale (Bergner et al. 1995). The mean V magnitude of CI Cam during this pre-outburst interval was . Performing a Fourier analysis on these data, Miroshnichenko (1995) found evidence for a 11.7 days quasi-period which he interpreted as a possible orbital period.
Clark et al. (2000) report on observations of CI Cam performed after the outburst, between 1998 August and 1999 March. The V magnitude of CI Cam during this post-outburst interval ranges between and (18 data points) and shows the same 0.4 magnitude variability with the same mean value as during the pre-outburst period.
Thus, the V magnitude of during the XMM-Newton observations is outside the range of magnitudes reported previously, indicating that the source had become fainter. However, this magnitude represents only one data point. So, it is difficult to determine if this higher value is due to variability on a day-to-day timescale, or if the source has become fainter for an extended interval.
4.2 The X-ray emission
The quiescent XMM-Newton spectrum of XTE J0421+56 can be fit by a power-law plus absorbed power-law and Gaussian model or alternatively by a partially covered power-law and Gaussian model. In both models, the high-energy component corresponds to a strongly absorbed continuum ( of 1023 atom cm-2). This fitting approach is supported by the fact that a similarly strongly absorbed quiescent emission was also reported from the source during the 1999 BeppoSAX observation. Parmar et al. (2000) fit the BeppoSAX 2–10 keV spectrum with an absorbed (NH of 1023 atom cm-2) power-law ( ) together with a Gaussian emission feature with an energy of 7.3 0.2 keV and an equivalent width of 620 350 eV. Since an unabsorbed component is unambiguously detected at low-energy in the XMM-Newton quiescent spectrum of XTE J0421+56, we re-examined the BeppoSAX spectrum reported in Parmar et al. (2000) to see if there is evidence for the presence of a similar component. The 0.2–2 keV LECS count rate of (7.5 4.8) 10-4 s-1 suggests that such a component may be present. In order to investigate this further, we fit the partially covered XMM-Newton model discussed above to the 0.5–10 keV BeppoSAX spectrum allowing the spectral parameters to vary. The line energy and width which were poorly constrained were set to the best-fit XMM-Newton values. This gives a of 1.43 for 38 d.o.f.. The uncovered component contributes (63)% of the total 1–10 keV absorbed flux, consistent with the ratio observed with XMM-Newton. Thus, the presence in the BeppoSAX 1999 spectrum of an unabsorbed component, similar to that detected in the XMM-Newton spectrum cannot be excluded.
When absorption is added to either the power-law plus absorbed power-law and Gaussian model or the partially covered power-law and Gaussian model used to fit the XMM-Newton spectrum, the NH of this component is 2.0 1021 atom cm-2 (see Table 2). This value is consistent with that obtained when XTE J0421+56 approached quiescence after the outburst (Belloni et al. 1999). These low values of NH confirm that the interstellar column towards XTE J0421+56 is not high. On the other hand, X-ray results show that the column density intrinsic to the system can be very high, and as inferred from the large range of absorption obtained (from roughly 0.2 to 50 1022 atom cm-2), very variable. Thus, this confirms the picture that most of the absorption towards XTE J0421+56 is local and not interstellar.
The Gaussian feature observed at 6.4 keV can be interpreted as a fluorescent emission from iron. Such an interpretation is consistent with the modeling of the spectrum using partial covering since it suggests the presence of significant cold absorbing material in the system. The large equivalent width observed can be explained if cold material surrounds the X-ray emitter with a large column density, which is also consistent with our modeling and with the picture, drawn from optical spectroscopy, of a compact object embedded in a very dense wind (Robinson et al. 2002). However, the spectral quality is too low to test for the presence of associated signatures of cold material such as absorption edges. A reflection component due to the presence of cold material could be expected as well, but such a component usually peaks above the energy range covered here (between 10 and 100 keV). Gaussian emission features were detected during the 1998 and 1999 BeppoSAX observations of XTE J0421+56 in quiescence at energies of and 7.3 0.2 keV respectively. Their different energies as compared to the 6.4 keV feature detected with XMM-Newton may indicate a different origin, or different physical conditions in the emission region. Emission features at 6.4 keV were also detected in outburst spectra from XTE J0421+56 and mostly interpreted as emission lines produced by an optically thin plasma (see e.g., Ueda et al. 1998; Revnivtsev et al. 1999). Such a mechanism can not be excluded in the case of the XMM-Newton observation of XTE J0421+56, although the geometry and emission processes involved during quiescence are likely to be very different from those involved during the outburst.
The partially covered power-law and Gaussian model as well as the powerlaw plus absorbed power-law and Gaussian model suggest the presence of two components: an unabsorbed component mainly observed 5 keV (the uncovered or low-energy component), and second, a strongly absorbed component mainly observed 5 keV (the covered or high-energy component) and dominating the total spectrum.
We propose that the covered component results from the compact object being embedded within the dense circumstellar wind emitted from the sgB[e] companion star, in agreement with the picture drawn from optical spectroscopy of the source (Robinson et al. 2002). The large range of observed NH at X-ray wavelengths could reflect the complexity of the B[e] star environment in which the compact object is traveling. Regions with different physical properties may be crossed, depending e.g., on the distance of the compact object from the sgB[e] star or from its equatorial plane. This environment may vary with time as well. It may also be modified by the X-rays emitted in the vicinity of the compact object, which are probably variable themselves.
We suggest two possible origins for the low-energy component. First, it could be due to X-ray emission from the sgB[e] star itself. The X-ray emission from OB stars is intrinsically soft (up to 4 keV, Long & White 1980). Orlandini et al. (2000) estimate that the X-ray luminosity of the companion star in XTE J0421+56 could be 5 erg s-1, while Robinson et al. (2002, Sect. 2.4) estimate that the sgB[e] star could emit up to erg s-1 in the 0.2–4.0 keV band. The 0.2–4.0 keV luminosity observed from XTE J0421+56 during the XMM-Newton observation is erg s-1 at 5 kpc. Thus, we cannot exclude that the low-energy emission, or part of it, originates from the companion star.
Another possibility is that the low-energy component is due to the scattering of higher-energy X-ray photons in a wind or ionized corona such as observed in some low-mass X-ray binaries. The flux of the low-energy component in XTE J0421+56 is about 10% of the total 0.5–10 keV flux. In dipping, eclipsing or accretion disk corona sources, the ratio observed between the flux attributed to scattered emission and the total flux is usually 5% (see e.g., Parmar et al. 1986). Thus, at least a part of the low-energy emission could be due to scattering in XTE J0421+56. We note however that corona have been observed in low-mass X-ray binaries that are much brighter than XTE J0421+56. So the possible scattering region in XTE J0421+56 may differ in nature and formation from those observed in low-mass X-ray binaries. The scattering region in XTE J0421+56 could be linked to the wind emitted by the B[e] companion star. Emission from the companion star and scattering could both play a role in the low-energy emission observed from XTE J0421+56.
XTE J0421+56 is the first identified member of a new class of HMXB with sgB[e] companion. It is the only known system in which the compact object is immersed in a dense and complex circumstellar wind. Further multiwavelength observations of this source are needed to explore the geometry and the emission processes involved in this system. Many other stars showing the B[e] phenomenon, and especially sgB[e] stars, could host a compact object. Due to their low X-ray luminosity and absorbed spectra, such objects are unlikely to have been identified in previous low-energy (0.1–2.5 keV) sky surveys such as conducted by ROSAT, and we await future medium energy X-ray surveys to detect further members of this class.
Acknowledgements.
This work is based on observations obtained with XMM-Newton, an ESA science mission with instruments and contributions directly funded by ESA member states and the USA (NASA). L. Boirin acknowledges an ESA Fellowship. We thank Rudi Much, Igor Antokhin and Simon Rosen for providing very useful help analyzing the XMM-Newton Optical Monitor data.References
- Allen & Swings (1976) Allen, D. A. & Swings, J. P. 1976, A&A, 47, 293
- Antokhin et al. (2002) Antokhin, J. I., Breeveld, A., Chen, B., et al. 2002, in New Visions of the X-ray Universe in the XMM-Newton and Chandra Era, eds. F. Jansen, ESA SP-488
- Balucinska-Church & McCammon (1992) Balucinska-Church, M. & McCammon, D. 1992, ApJ, 400, 699
- Belloni et al. (1999) Belloni, T., Dieters, S., van den Ancker, M. E., et al. 1999, ApJ, 527, 345
- Bergner et al. (1995) Bergner, Y. K., Miroshnichenko, A. S., Yudin, R. V., et al. 1995, A&AS, 112, 221
- Borozdin & Trudolyubov (2002) Borozdin, B. N. & Trudolyubov, S. P. 2002, ApJ, submitted, astroph/0205208
- Chen et al. (1997) Chen, W., Shrader, C. R., & Livio, M. 1997, ApJ, 491, 312
- Clark et al. (2000) Clark, J. S., Miroshnichenko, A. S., Larionov, V. M., et al. 2000, A&A, 356, 50
- Clark et al. (1999) Clark, J. S., Steele, I. A., Fender, R. P., & Coe, M. J. 1999, A&A, 348, 888
- den Herder et al. (2001) den Herder, J. W., Brinkman, A. C., Kahn, S. M., et al. 2001, A&A, 365, L7
- Frontera et al. (1998) Frontera, F., Orlandini, M., Amati, L., et al. 1998, A&A, 339, L69
- Hjellming & Mioduszewski (1998) Hjellming, R. M. & Mioduszewski, A. J. 1998, IAU Circ., 6862
- Jansen et al. (2001) Jansen, F., Lumb, D., Altieri, B., et al. 2001, A&A, 365, L1
- Lamers et al. (1998) Lamers, H. J. G. L. M., Zickgraf, F., de Winter, D., Houziaux, L., & Zorec, J. 1998, A&A, 340, 117
- Lasota (2001) Lasota, J.-P. 2001, New Astronomy Review, 45, 449
- Long & White (1980) Long, K. S. & White, R. L. 1980, ApJ, 239, L65
- Mason et al. (2001) Mason, K. O., Breeveld, A., Much, R., et al. 2001, A&A, 365, L36
- Miroshnichenko (1995) Miroshnichenko, A. S. 1995, Astronomical and Astrophysical Transactions, 6, 251
- Orlandini et al. (2000) Orlandini, M., Parmar, A. N., Frontera, F., et al. 2000, A&A, 356, 163
- Orr et al. (1998) Orr, A., Parmar, A. N., Orlandini, M., et al. 1998, A&A, 340, L19
- Paciesas & Fishman (1998) Paciesas, W. & Fishman, G. 1998, IAU Circ., 6856
- Parmar et al. (2000) Parmar, A. N., Belloni, T., Orlandini, M., et al. 2000, A&A, 360, L31
- Parmar et al. (1986) Parmar, A. N., White, N. E., Giommi, P., & Gottwald, M. 1986, ApJ, 308, 199
- Revnivtsev et al. (1999) Revnivtsev, M. G., Emel’Yanov, A. N., & Borozdin, K. N. 1999, Astronomy Letters, 25, 294
- Robinson et al. (2002) Robinson, E. L., Ivans, I. I., & Welsh, W. F. 2002, ApJ, 565, 1169
- Robinson et al. (1998) Robinson, E. L., Welsh, W. F., Adams, M. T., & Cornell, M. E. 1998, IAU Circ., 6862
- Smith et al. (1998) Smith, D., Remillard, R., Swank, J., Takeshima, T., & Smith, E. 1998, IAU Circ., 6855
- Strüder et al. (2001) Strüder, L., Briel, U., Dennerl, K., et al. 2001, A&A, 365, L18
- Turner et al. (2001) Turner, M. J. L., Abbey, A., Arnaud, M., et al. 2001, A&A, 365, L27
- Ueda et al. (1998) Ueda, Y., Ishida, M., Inoue, H., et al. 1998, ApJ, 508, L167
- Wagner & Starrfield (1998) Wagner, R. M. & Starrfield, S. G. 1998, IAU Circ., 6857