Early-type galaxies in low-density environments
Abstract
We describe the construction and study of an objectively-defined sample of early-type galaxies in low-density environments. The sample galaxies are selected from a recently-completed redshift survey using uniform and readily-quantified isolation criteria, and are drawn from a sky area of 700 deg2, to a depth of 7 000 km s-1 and an apparent magnitude limit of . Their early-type (E/S0) morphologies are confirmed by subsequent CCD imaging. Five out of the nine sample galaxies show signs of morphological peculiarity such as tidal debris or blue circumnuclear rings. We confirm that E/S0 galaxies are rare in low-density regions, accounting for only 8% of the total galaxy population in such environments. We present spectroscopic observations of nine galaxies in the sample, which are used, in conjunction with updated stellar population models, to investigate star-formation histories. Our line-strength analysis is conducted at the relatively high spectral resolution of 4.1 Å. Environmental effects on early-type galaxy evolution are investigated by comparison with a sample of Fornax cluster E/S0s (identically analysed). Results from both samples are compared with predictions from semi-analytic galaxy formation models. From the strength of [OII] emission we infer only a low level of ongoing star formation ( M⊙ yr-1). Relative to the Fornax sample, a larger fraction of the galaxies exhibit [OIII] nebular emission and, where present, these lines are slightly stronger than typical for cluster E/S0s. The Mg– relation of E/S0s in low-density regions is shown to be indistinguishable from that of the Fornax sample. Luminosity-weighted stellar ages and metallicities are determined by considering various combinations of line-indices; in particular the vs Fe5015 diagram cleanly resolves the age–metallicity degeneracy at the spectral resolution of our analysis. At a given luminosity, the E/S0 galaxies in low-density regions are younger than the E/S0s in clusters (by 2–3 Gyr), and also more metal-rich (by 0.2 dex). We infer that an anti-correlation of age and metallicity effects is responsible for maintaining the zero-point of the Mg– relation. The youngest galaxies in our sample show clear morphological signs of interaction. The lower mean age of our sample, relative to cluster samples, confirms, at least qualitatively, a robust prediction of hierarchical galaxy formation models. By contrast, the enhanced metallicity in the field is contrary to the predictions and highlights shortcomings in the detailed treatment of star-formation processes in current models. The [Mg/Fe] abundance ratio appears to span a similar, mostly super-solar, range both in low-density regions and in Fornax cluster galaxies. This result is quite unexpected in simple hierarchical models.
keywords:
galaxies: abundances - galaxies: formation - galaxies: elliptical and lenticular - galaxies: evolution - cosmology: observations1 INTRODUCTION
Hierarchical galaxy formation models predict significantly different formation histories for early-type galaxies in cluster and low-density environments (Baugh, Cole & Frenk 1996, Kauffmann & Charlot 1998). In these models, present day clusters form from the highest peaks in the primordial density fluctuations where major mergers of dark matter halos, which harbour the first galaxies, rapidly produce bulge-dominated galaxies at high redshifts (). The merging of galaxies and the infall of new cold gas cannot continue once the relative velocity dispersion of galaxies becomes large ( km s-1), i.e., the deep potential well of a cluster has been formed. Within this scenario it is possible to reconcile the characteristic ingredient of hierarchical galaxy formation, the merging process, with the observational finding that most stars in luminous cluster elliptical galaxies formed at (e.g., Aragon-Salamanca et al. 1993, Ellis et al. 1997, van Dokkum et al. 1998).
In low-density regions, hierarchical models predict that (i) galaxies can accrete new cold gas and perhaps build up a stellar disk driving the morphology towards later types and (ii) that major mergers continue to take place at redshifts well below unity. As a result of this, early-type galaxies in low-density regions are able to incorporate stars formed at low redshifts and therefore should have, at the present day, younger luminosity-weighted ages than the equivalent cluster population [Baugh et al. 1996, Kauffmann & Charlot 1998, Governato et al. 1999, Cole et al. 2000]. As shown in Figure 1 the models predict for cluster ellipticals a mean luminosity-weighted age of 9.6 Gyr (dashed line). The cluster S0s are predicted to be 1 Gyr younger. Both ellipticals and lenticular galaxies in clusters show a weak trend in the sense that fainter galaxies are older. By contrast, the models predict that early-type galaxies in low-density regions should show a broad age distribution over the whole luminosity range with a mean age of 5–6 Gyr.

Recent observational efforts to investigate the formation of early-type galaxies in low-density regions, and test the model predictions discussed above, have largely focused on HST imaging of galaxies at redshifts . When early-type galaxies (‘spheroidals’) are selected by morphology alone, no significant evidence of a decline in comoving number density with look-back time is found [Menanteau et al. 1999]. At face value this suggests an early formation epoch. However, some of these galaxies show colours which are too blue to be consistent with the predictions of a simple high-redshift monolithic-collapse model [Menanteau et al. 1999]. Furthermore, there is evidence that the dispersion in colour among field ellipticals is larger than for the equivalent cluster population at (Schade et al. 1999; see also Larson, Tinsley & Caldwell 1980 for a low redshift analogy). Schade et al. also found spectroscopic evidence of ongoing star formation in the field, since about one-third of the field elliptical galaxies show [OII] lines with equivalent widths in excess of 15 Å. These results are further supported by the study of Menanteau, Abraham & Ellis (2001) who investigated the internal colour variations of faint spheroidals in the HDFs. They find that at least one third of the galaxies show strong variations in internal colour, mostly showing centrally located blue cores, and conclude that at approximately 50% of the field spheroidals experience episodes of star formation.
Recent fundamental plane studies of field early-type galaxies [van Dokkum et al. 2001, Treu et al. 2001] find, within their observational errors, no significant difference between cluster and field samples at . However, both samples provide evidence that the stars in field early-types are marginally younger than the equivalent cluster population, although most of the stars must have formed at high redshifts. van Dokkum et al. conclude that their measurement of the evolution of the ratio with redshift is inconsistent with the predictions of semi-analytical models for galaxy formation [Diaferio et al. 2001]. While the models predict a systematic offset between field and cluster in at all redshifts (the field being brighter at a given mass), van Dokkum et al. find no significant offset in their data.
There are a few investigations of the nearby population of early-type galaxies in low-density regions. de Carvalho & Djorgovski (1992) investigate the properties of field and cluster early-type galaxies using a subset of the ‘7 Samurai’ sample [Faber et al. 1989] and the data from Djorgovski & Davis (1987). They conclude that field ellipticals show more scatter in their parameters than cluster galaxies indicating the presence of younger stellar populations in the field. Silva & Bothun (1998) investigate a sample of nearby early-type galaxies, specifically including galaxies with disturbed morphologies such as shells and tidal tails (see also Schweizer & Seitzer 1992). From their analysis of near-IR colours they conclude that there is little or no evidence for an intermediate age (1–3 Gyr) population of significant mass (10%) in their sample, irrespective of morphological details. Colbert, Mulchaey & Zabludoff (2001) have undertaken an imaging survey of 23 nearby isolated early-type galaxies, finding morphological evidence for recent merging (e.g., shells and tidal features) in 41% of the galaxies, as compared to only 8% in their comparison sample of group members. Bernardi et al. (1998) investigate the Mg2– relation in a large sample of early-type galaxies drawn from the ENEAR survey [da Costa et al. 2000] and find that there is a small difference in the zero-point between cluster and field galaxies. They interpret this offset as an age difference, in the sense that field galaxies are younger by 1 Gyr. They conclude however, that the stars in both field and cluster early-type galaxies formed mostly at high redshifts.
One of the main obstacles for studies of field galaxies is the exact treatment of the selection process. There are many possible definitions for the term ‘field’, and it is critical to account for the different selection criteria when comparing published studies. For example, while Colbert et al. find only 30 isolated early-type galaxies in the RC3 (de Vaucouleurs 1991, within km s-1), the field sample of Bernardi et al. comprises more than two thirds of the entire ENEAR catalogue (631 out of 931 galaxies within km s-1). Clearly, the definitions of what is a field galaxy differ widely even for nearby galaxy samples. It is even more difficult to compare medium- or high-redshift samples, where redshift data is sparse, and selection criteria for the field often ill-defined.
The present paper presents a high-quality spectroscopic study of the stellar populations of early-type galaxies in low-density environments. In Section 2 we describe the precise and reproducible selection criteria according to which our new sample is selected. The observations and basic data reduction processes are outlined in Section 3, in which we also describe the verification and refinement of the galaxy sample. Our measurements of absorption (and emission) line strengths are presented in Section 4. The principal results, detailed in Section 5, derive from analysis of (i) the Mg– relation, (ii) the luminosity-weighted ages and metallicities and (iii) the [Mg/Fe] abundance ratios. We discuss these results in Section 6, relating them to previous studies, and comparing with the expectations from hierarchical scenarios for galaxy formation. Our conclusions are presented in Section 7.
Throughout this paper, for model predictions as well as observations, luminosities and physical scales are computed for a Hubble constant km s-1 Mpc-1. The adopted deceleration parameter is ; using a negative , as preferred by SN Ia data [Riess et al. 1998, Perlmutter et al. 1999], would have negligible effects on these calculations.
2 Sample Selection
An important limitation of previous work has been the difficulty in selecting a genuine sample of nearby early-type galaxies in low-density environments. The recent FLASH (FLAIR-Shapley-Hydra) redshift survey of Kaldare et al. (2001111Strictly, this paper is based on a preliminary version of the FLASH redshift catalogue, as of December 1998.) provides a good basis for constructing such a sample, with a luminosity range similar to that in typical nearby cluster samples (). The survey provides redshifts for 2931 of the 4737 galaxies brighter than =16.7 in a strip of sky covering 10° in Galactic latitude (=25°–35°) and 70° in Galactic longitude (=260°–330°). The survey spans the region between the Shapley Concentration and the Hydra cluster and reaches out to beyond 20 000 km s-1 (median redshift km s-1). The source catalogue is based on the Hydra-Centaurus Catalogue of Raychaudhury (1989, 1990) and is derived from APM scans of Southern Sky Survey plates. The magnitude system is defined by the IIIa-J emulsion of the plates and the GG395 filter, and is related to the standard Johnson B and V magnitudes by =B-0.28(BV) for 0.1(BV)1.6 (Blair & Gilmore 1982). The redshifts in the survey catalogue comprise both new measurements obtained with the FLAIR fibre spectrograph on the United Kingdom Schmidt Telescope, of the Anglo-Australian Observatory, and measurements from the literature; they have an rms precision of approximately 60 km s-1. The completeness of the survey for early-type galaxies is a function of magnitude and is approximately given by for and for . Therefore, at our limiting magnitude of (equivalent to for early-type galaxies) the completeness is still 51%.
For the selection of our low-density region sample of early-type galaxies we chose a redshift limit of km s-1, an apparent magnitude limit of (no limit on the brightest galaxies), and required neighbours () within a redshift-scaled search radius corresponding to 0.8° at km s-1 (i.e., a radius of 1.3 Mpc in our adopted cosmology) and a constant depth of km s-1. Within km s-1 the survey contains 1069 galaxies. Of these, 237 galaxies are classified as early-types and brighter than (after excluding those galaxies which are so close to edges of the survey that the search radius is not fully sampled).
These selection criteria yielded a sample of E and S0 galaxies in low-density regions. Visual inspection of ‘Digitized Sky Survey’ (DSS) images, however, revealed that some of the galaxies have later morphology than indicated by Raychaudhury’s (1989) classification. Excluding these galaxies resulted in a sample of 30 galaxies of which 24 were observed (see Section 3). We note that a visual inspection (DSS images) of galaxies satisfying our isolation criteria and classified as spiral by Raychaudhury yielded only four additional galaxy targets which can be classified as S0. Non of these galaxies were observed. Since not all of the galaxies are included in well-known catalogues we refer to them in this paper as LDR xx where LDR stands for Low Density Region (see Table 2 and 3).
3 THE OBSERVATIONS AND BASIC DATA REDUCTION
3.1 Observational techniques
Spectroscopic observations were obtained during two runs (1999 January 18–20 and 1999 February 11–14) at the ANU 2.3m telescope at Siding Spring Observatory, Australia. The first run yielded only one night of usable data; the second run was entirely clear. Both runs used identical instrumentation. The observations were made with the Double Beam Spectrograph [Rodgers 1988], in which a dichroic feeds red and blue beams to two identical spectrographs. The analyses presented in this paper, however, are based on the blue-beam spectra, and so the details below refer to the blue-beam instrumentation only. A 600 line mm-1 grating yielded a spectral resolution of 2.6 Å (FWHM, instrumental velocity resolution km s-1 at 5200 Å), and a sampling of Å pixel-1. The spatial scale was 0.91 arcsec pixel-1 and the slit width was 2 arcsec (aligned roughly along the major axis of each galaxy). The detector was a SITe CCD of 1752532 pixel format. The resulting spectra cover the rest-wavelength range 3690–5600 Å, including many prominent Balmer and metallic lines (, , , Mg b, Fe5270, Fe5335 amongst others) and the wavelengths of nebular [OII] and [OIII] emission. Table 1 summarizes the instrumental set-up.
| Telescope | MSSSO (2.3m) |
|---|---|
| Dates | 18-20 Jan 1999, 11-14 Feb 1999 |
| Instrument | DBS spectrograph (blue beam) |
| Spectral range | 3690-5600 Å |
| Grating | 600 line mm-1 |
| Dispersion | 1.1 Å pixel-1 |
| Resolution (FWHM) | 2.6 Å |
| Spatial Scale | 091 pixel-1 |
| Slit Width | 20 |
| Detector | SITe ( pixels; ) |
| Gain | |
| Read-out-noise | (rms) |
| Typical seeing | 2″ |
The standard calibration frames were obtained, including zero-exposure bias frames, tungsten lamp exposures for flat-fielding and twilight-sky exposures for vignetting corrections. Neon–argon arc lamp spectra were obtained to provide wavelength calibration. Arc exposures were made immediately prior to, or subsequent to, each exposure. Long integrations were divided into exposures of at most 1200 s, each with a separate arc observation, so as to track any flexure in the telescope–spectrograph system during the exposure.
In order to calibrate the two runs and provide templates for redshift and velocity dispersion measurements we observed stars selected from the Lick stellar library catalogue [Worthey et al. 1994], covering a broad range of spectral types. Spectrophotometric standard stars were also observed to calibrate the response function of the system.
For the target galaxies, the total exposure times were typically 2400 s or 3600 s. In two cases (LDR 15 & LDR 27) the surface brightness of the galaxy was too low to obtain spectra of sufficient signal-to-noise ratio in a reasonable integration time (e.g., per Å in 1.5 hr). For these galaxies, we obtained a single exposure, in order to make a rough spectral classification from the presence and strength of emission lines.
For five galaxies we noticed a spiral morphology on the CCD auto-guider and took only one 20 min exposure. These galaxies (LDR 03, LDR 04, LDR 10, LDR 11 & LDR 31) show emission line spectra typical for spiral galaxies (see Figure 2) and were excluded from our final sample.

For calibration purposes, five comparison galaxies were observed in overlap with the sample of Kuntschner (2000): NGC 1381, NGC 1399, NGC 1404 and IC 2006 (all in the Fornax cluster), plus the Leo-group member NGC 3379. We also obtained spectra of three early-type galaxies in the Fornax cluster which were not previously observed by Kuntschner (NGC 1344, NGC 1366 and NGC 1387). For a summary of the comparison galaxies in the Fornax cluster, see Table 5.
3.2 Basic data reduction
Data reduction followed standard methods, and was performed using a combination of the starlink and iraf software packages. Frames were de-biased (allowing for a small along-the-slit bias-level variation, which changes slightly from exposure to exposure), flatfielded to remove pixel-to-pixel sensitivity variations and corrected for vignetting along the slit. Cosmic ray events were removed from the frames interactively, and with great care, using the lineclean task within iraf. Wavelength calibration was achieved by fitting a low-order (usually cubic) polynomial to 40 lines in the arc spectra. The typical rms scatter in the calibration was 0.07 Å.
From each exposure, one-dimensional spectra were extracted for a central aperture. The radial gradients of line-strengths are not known a priori for individual galaxies. It is therefore desirable to scale the extraction aperture with redshift, so as to probe a roughly constant physical scale at all of the galaxies in the sample. Jørgensen, Franx & Kjærgaard (1995, see also Appendix A) have given a recipe for converting rectangular aperture dimensions to an equivalent circular aperture diameter. We scale the along-the-slit extraction length with redshift such that this equivalent circular aperture has 1.08 kpc diameter for all galaxies. The extraction area is at the characteristic depth of the sample (5 000 km s-1).
Finally, the individual spectra for each target were added to yield the final spectrum from which redshift, velocity dispersion and line-indices are measured. Prior to the index measurements the continuum shape was corrected to a relative flux scale using the spectrophotometric standard GD 108 [Oke 1990].
3.3 Redshift determination
In a first analysis, redshifts were measured for the galaxies in low-density regions with the IRAF routine fxcor and corrected to heliocentric values (see Table 2). A comparison of these redshifts with the catalogue of Kaldare et al. (2001) showed that our high-quality measurements disagree with the catalogue by more than three times the expected 1 error for eight galaxies. In order to test whether these galaxies still satisfy our isolation criteria we re-ran our selection program using the new redshifts.
This resulted in three galaxies being removed, having redshifts beyond 7 000 km s-1 (our redshift limit). Four galaxies were reclassified as group/cluster members (see Table 3). We note that by searching a given redshift survey for isolated early-type galaxies, one is likely to pick up many of the erroneous redshifts in the survey, since a large error in most likely moves these galaxies from clusters and groups (where they are most common) to lower-density environments (which occupy most of the survey volume).
3.4 Imaging
We have obtained optical () and near-infrared () imaging data at the CTIO 1.5m telescope. The morphologies of our sample galaxies, estimated from visual inspection of the optical images, are best described as E or S0. Many of the galaxies, however, present peculiarities (tidal tails or debris, rings, secondary intensity-maxima, disturbed companions, etc.) which are likely related to merger and/or interaction events (indeed six of the nine galaxies in the final sample are listed in the Arp & Madore (1987) catalogue of peculiar galaxies).
The sample galaxy LDR 13 is an exception to the above statement. It presents an exponential profile and, after subtraction of an elliptical-isophote model, spiral arms are clearly visible. This galaxy was thus reclassified as a spiral galaxy, and removed from later consideration. A spectrum of LDR 13 is shown in Figure 2.
Our broad classifications based on visual inspection are included in Table 2. A more detailed and quantitative description of the morphological characteristics of the individual sample galaxies, and their relation to the spectroscopic results, will be provided in a forthcoming paper.
| Name | ESO cat. | AM cat. | Type | RA J2000 DEC | neigh. | |||||
|---|---|---|---|---|---|---|---|---|---|---|
| [mag] | [mag] | [km s-1] | [km s-1] | |||||||
| (1) | (2) | (3) | (4) | (5) | (6) | (7) | (8) | (9) | (10) | (11) |
| LDR 08 | ESO 503-G005 | AM 1112-272 | S0 (S…) | 11h15m156 | -27°39m38″ | 15.30 | -18.5 | 3 88010 | 0/1 | |
| LDR 09 | ESO 503-G012 | AM 1115-255 | E (S0) | 11h17m509 | -26°08m04″ | 14.76 | -17.6 | 2 13810 | 2/2 | |
| LDR 14 | ESO 379-G026 | AM 1203-354 | E (S0) | 12h06m169 | -35°58m51″ | 14.24 | -19.5 | 3 90310 | 1/1 | |
| LDR 19 | ESO 442-G006 | - | S0 (S0) | 12h34m062 | -31°13m00″ | 15.42 | -19.2 | 5 78118 | 0/0 | |
| LDR 20 | ESO 381-G004 | - | S0 (Sa) | 12h39m096 | -34°46m51″ | 15.07 | -18.9 | 4 26314 | 1/1 | |
| LDR 22 | ESO 382-G016 | AM 1310-362 | E (S0) | 13h13m123 | -36°43m22″ | 13.54 | -19.8 | 3 29714 | 2/4 | |
| LDR 29 | ESO 445-G056 | - | S0 (S0) | 13h50m536 | -30°17m20″ | 14.89 | -19.6 | 5 68210 | 2/3 | |
| LDR 33 | - | AM 1402-285 | S0 (- ) | 14h05m224 | -29°08m27″ | 15.19 | -19.5 | 5 99911 | 0/0 | |
| LDR 34 | ESO 446-G049 | - | S0 (S0) | 14h20m144 | -29°44m50″ | 13.71 | -20.1 | 3 83610 | 0/0 | |
Notes: The first column gives the name of the galaxy as used in this paper. If the galaxy is found in the ESO/Uppsala survey of galaxies [Lauberts 1982] then we list its ESO identification in column two. For those galaxies tabulated in “A catalogue of southern peculiar galaxies and associations” [Arp & Madore 1987], the corresponding identification is given in column three. The fourth column denotes our own morphological classification followed by the ESO classification in brackets. The tabulated coordinates (columns five and six) are determined from the ‘Digitized Sky Survey’, and should be accurate to 1 arcsec. Column seven shows the (total) magnitude, derived from Hydra–Centaurus Catalogue (Raychaudhury 1989). The absolute magnitude (column eight) was calculated using the redshift of each galaxy ( km s-1 Mpc-1, ), and is converted from to using the transformation given in the text, assuming . The quoted is corrected for galactic extinction using the Schlegel et al. (1998) maps. Column nine gives the central velocity dispersion , as measured within an aperture equivalent to 1.08 kpc diameter. Column ten lists our heliocentric redshift (measured from spectra of much higher quality than the FLASH survey data), while column eleven shows the number of neighbours detected in the FLASH catalogue by applying our isolation criteria (see Section 2 for details). In this final column, the first number refers to the results obtained using the Dec 1998 version of the FLASH catalogue; the second number is the value obtained using the updated catalogue as published by Kaldare et al. (2001).
3.5 The final sample
Taking into account all of the selection criteria discussed above (see Table 4 and Table 6), the final sample comprises nine early-type galaxies (3 Es, 6 S0s) in low-density regions (see Table 2). While the sample size is small, we emphasize that the multiple, well-defined selection criteria guarantee that these galaxies are of E/S0 morphology, and reside in large-scale environments of very low density.
Figure 3 presents the rest-frame spectra of galaxies in the confirmed LDR sample. All spectra show the features characteristic of early-type galaxies: prominent H and K lines, the G-band and the Mg feature at 5175 Å. Compared to the spiral galaxy spectra in Figure 2, there is little emission visible in the oxygen lines. However, about half of our sample galaxies do exhibit weak [OII] emission (equivalent width between 3 and 7 Å; detection limit 0.5 Å). [OIII] emission (at 4959 Å and 5007 Å) is rarely visible in the raw spectra, but can be distinguished after subtraction of a model continuum. Emission line measurements are further discussed in Section 4.

The distribution of our sample in redshift space (‘pie-diagram’) and projected on the sky are presented in Figures 4 and 5, respectively. These diagrams show graphically that our selection procedure finds galaxies well separated from dense cluster environments such as Abell 1060 (l,b)=(270°, 27°), Abell 3581 (l,b)=(325°, 33°), Abell 3574 (l,b)=(320°, 30°) and Abell S0753 (l,b)=(320°, 26°) which are located within the FLAIR redshift survey. The only sample member which might potentially be a cluster member (albeit with extremely large relative velocity) is LDR 29, located 2 000 km s-1 beyond the mean redshift of Abell 3574.


We note that at the time of submission of this paper, an updated version of the FLASH catalogue became available. This catalogue contains more literature redshifts than the version we used to select our sample (Dec 1998). As a result LDR 22 and LDR 29 have 4 and 3 neighbours, respectively, in the new catalogue. This moves them slightly out of our original selection criteria; nevertheless, the environments of these galaxies are still best-described as being of low density. Figure 6 shows the distribution of ‘neighbour counts’ for early-type galaxies in the FLASH survey (version Dec 1998) within 7 000 km s-1 restricted to galaxies with . The hatched region indicates the location of our final sample of nine galaxies. Note that our experience in compiling the LDR sample suggests that the number of isolated E/S0s is systematically overestimated in the FLASH catalogue, due to morphological classification and redshift errors (see Section 3.3). In particular, only 40% of the observed candidates were confirmed as fulfilling our criteria. If this effect were corrected for, it is likely that our sample would be found to occupy the tail of a distribution which peaks at 10-15 neighbours.

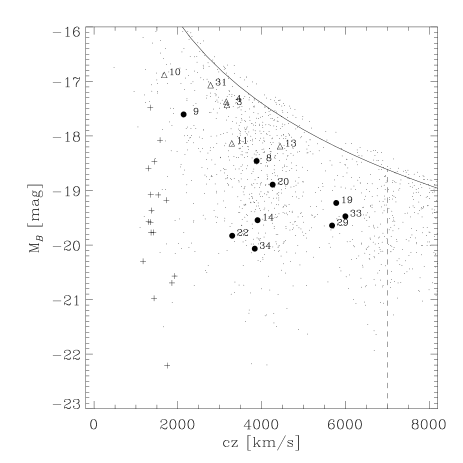
Figure 7 shows the FLASH catalogue selection function ( versus redshift diagram) with the galaxies of Table 2 highlighted. Our sample spans a luminosity range of to . The luminosity distribution of our sample is similar to that of the early-type galaxies in Fornax fainter than . However, there are no galaxies in our field sample more luminous than this (compared to 5 in Fornax, see Section 6.1 for further discussion).
| Name | Name other | RA J2000 DEC | ||||
| [mag] | [mag] | [km s-1] | ||||
| Emission line and spiral galaxies in low-density regions | ||||||
| LDR 03 | ESO 569-IG?002 | 10h44m599 | -22°09m09″ | 15.80 | -17.4 | 3 17121 |
| LDR 04 | ESO 501-G096 | 10h46m475 | -23°19m39″ | 15.90 | -17.4 | 3 15635 |
| LDR 10 | ESO 439-G016 | 11h31m512 | -30°24m40″ | 15.02 | -16.9 | 1 67512 |
| LDR 11 | ESO 503-G025 | 11h34m290 | -26°52m10″ | 15.20 | -18.1 | 3 28723 |
| LDR 13 | - | 12h00m346 | -32°21m50″ | 15.98 | -18.2 | 4 44111 |
| LDR 31 | S753 [56]a | 14h03m146 | -34°01m17″ | 15.96 | -17.1 | 2 78115 |
| Galaxies in group/cluster environments or km s-1 | ||||||
| LDR 06 | ESO 502-G005 | 10h57m370 | -25°25m39″ | 14.87 | -18.9 | 3 90112 |
| LDR 17 | ESO 441-G025 | 12h16m132 | -30°07m41″ | 15.61 | -21.0 | 14 56630 |
| LDR 18 | - | 12h18m405 | -28°27m58″ | 15.87 | -20.0 | 10 23612 |
| LDR 21 | ESO 381-G019 | 12h44m441 | -35°52m21″ | 15.50 | -20.1 | 9 10814 |
| LDR 25 | ESO 444-G038 | 13h27m006 | -29°11m30″ | 14.79 | -19.0 | 4 15310 |
| LDR 26 | A 3559 [23]b | 13h28m057 | -29°25m29″ | 15.75 | -18.1 | 4 08712 |
| LDR 30 | S753 [49]a | 14h03m079 | -34°01m58″ | 15.70 | -18.7 | 5 12422 |
| low S/N spectra without classification | ||||||
| LDR 15 | - | 12h08m342 | -30°08m53″ | 16.04 | -16.4 | 2 15724 |
| LDR 27 | GSC 7269 01680 | 13h31m362 | -32°58m52″ | 15.92 | -17.6 | 3 55610 |
Notes: The cluster S753 is listed in the supplementary catalogue of Abell, Corwin & Olowin (1989). The galaxy number in square brackets is that assigned by Willmer et al. (1991). The cluster Abell 3559 is listed in Abell, Corwin & Olowin (1989). The galaxy number in square brackets is that of Katgert et al. (1998). The first column lists the name of the galaxy as referred to in this paper, column two gives the identification in the ESO/Uppsala survey [Lauberts 1982], or other source as described above. Other columns are as in Table 2.
| Sky area | =260°– 330°, =25°– 35° |
|---|---|
| Redshift range | km s-1 |
| Magnitude | |
| Morphology | E or S0 |
| Environment | neighbours with |
| (within 1.3 Mpc projected radius and | |
| 350 km s-1 ) | |
| Spectral type | absorption-dominated |
| Spectral | per Å |
| Name | Type | Reference | |
|---|---|---|---|
| NGC 1316 | S0 | K00 | |
| NGC 1336 | E | K00 | |
| NGC 1339 | E | K00 | |
| NGC 1344 | S0 | this study | |
| NGC 1351 | E | K00 | |
| NGC 1366 | S0 | this study | |
| NGC 1373 | E | K00 | |
| NGC 1374 | E | K00 | |
| NGC 1379 | E | K00 | |
| NGC 1380 | S0 | K00 | |
| NGC 1381 | S0 | K00, this study | |
| NGC 1387 | S0 | this study | |
| NGC 1399 | E | K00, this study | |
| NGC 1404 | E | K00, this study | |
| NGC 1419 | E | K00 | |
| NGC 1427 | E | K00 | |
| IC 2006 | S0 | K00, this study |
Notes: K00: Line-strength and velocity dispersions previously published by Kuntschner (2000); All velocity dispersions are corrected to nominal aperture of at 5 000 km s-1, equivalent to 1.08 kpc diameter.
| Selection step | # of galaxies |
|---|---|
| remaining | |
| Original selection from FLASH survey | 40 |
| Morphology check with DSS | 30 |
| Observed galaxies | 24 |
| Sufficiently high S/N | 22 |
| Morphology check on auto-guider | 17 |
| FLASH redshifts confirmed | 10 |
| Morphology check with CCD imaging | 9 |
3.6 Central velocity dispersions
Central velocity dispersion estimates were derived using version 8 of the Fourier Quotient Coefficient algorithm developed by Bender (1990). For this analysis the spectra were rebinned to a logarithmic wavelength scale and a rest-wavelength range of approximately 4850 to 5560 Å was extracted. As we only consider central spectra in this paper we fit a pure Gaussian profile to the broadening function, neglecting higher order terms. For the final estimate of the central velocity dispersion, we averaged the results obtained using 15 different template stars ranging from G7III to K5III in spectral type. The error was taken to be the larger of (i) the mean internal error estimate and (ii) the rms dispersion between the different template stars. The average relative error is 3%. The final, aperture-corrected (see Appendix A), central velocity dispersion measurements are listed in Tables 2 and 5.
A comparison of central velocity dispersion measurements for the five galaxies in common with Kuntschner (2000) shows excellent agreement; the conversion factor between the two data-sets is . Since this is small and not significant, neither source is corrected for the offset.
4 Line-strength indices
The wavelength range of our observations allows us to analyse a range of important absorption and emission features, including Balmer lines, Mg and Fe lines and the [OII] and [OIII] emission lines. These will be compared to predictions from population synthesis models in order to constrain parameters such as the luminosity-weighted age, metallicity and magnesium to iron abundance ratio of each galaxy.
4.1 Spectral resolution and choice of stellar population models
In the optical region of the spectrum, the line-strength indices most commonly exploited are those of the Lick/IDS system. The Lick index definitions are described in detail in Worthey (1994), Worthey & Ottaviani (1997) and Trager et al. (1998). Unfortunately, the Lick/IDS system and its associated models (e.g., Worthey 1994; Vazdekis et al. 1996) are calibrated at a fixed spectral resolution of 9 Å (FWHM). Thus to measure indices in the Lick system, it is necessary to degrade the observed spectra to match this resolution, sacrificing the weak features which may be most sensitive to the stellar populations. The spectra of the LDR galaxies analysed in this paper were obtained at an instrumental resolution of 2.6 Å. For a comparison cluster sample, we use the Fornax dataset of Kuntschner (2000); these spectra have an instrumental resolution of 4.1 Å. Hence, for all but the most luminous galaxies (where velocity broadening unavoidably degrades the resolution of the spectra), our measurements would be severely compromised by the use of the Lick system as originally defined.
Instead, we will exploit the new stellar population models by Vazdekis (1999), which predict the full SED of the integrated stellar light, at the much higher resolution of 1.8 Å for two wavelength regions (3856-4476 Å and 4795-5465 Å). The Vazdekis models and their application are discussed in greater detail in Appendix B. In order to make a fair comparison between our LDR sample, the Fornax cluster sample, and the stellar population models, we broadened the LDR data and the model SEDs to match the 4.1 Å resolution of the cluster sample. The predicted line-strengths for simple stellar populations are obtained by measuring the indices directly from the model SEDs.
4.2 The measurements
Although we measure and analyse the indices at higher resolution, we continue to employ the index definitions (i.e., the central and pseudo-continuum bandpasses) standardized by the Lick group.
The measured indices were corrected for velocity dispersion broadening using the results of simulations with template stars (see Kuntschner 2000 for details). Using the galaxies in common with the cluster sample of Kuntschner (2000), we checked for any systematic offsets. There is excellent agreement for all indices with formal offsets 0.1 Å (0.01 mag for Mg2) which were removed from the Kuntschner (2000) data if the offset was significant compared to its formal error. The final line-strengths indices for the LDR sample are listed in Table 7.
| Name | Fe5015 | Mg2 | Mg b | Fe5270 | Fe5335 | |||
|---|---|---|---|---|---|---|---|---|
| [Å] | [Å] | [Å] | [Å] | [mag] | [Å] | [Å] | [Å] | |
| LDR 08 | ||||||||
| LDR 09 | ||||||||
| LDR 14 | ||||||||
| LDR 19 | ||||||||
| LDR 20 | ||||||||
| LDR 22 | ||||||||
| LDR 29 | ||||||||
| LDR 33 | ||||||||
| LDR 34 |
| Name | [OII] | [OIII] |
|---|---|---|
| [Å] | [Å] | |
| LDR 08 | ||
| LDR 09 | ||
| LDR 14 | ||
| LDR 19 | ||
| LDR 20 | ||
| LDR 22 | ||
| LDR 29 | ||
| LDR 33 | ||
| LDR 34 |
Notes: All indices are calculated for the nominal aperture (equivalent to 1.08 kpc diameter) and are quoted without the correction for emission contamination. See Section 4 for details.
As we discuss in greater detail in the following section, several indices can be contaminated by nebular emission lines. Corrections can be established for this contamination, based on the measured equivalent width of [OIII]. This line is difficult to discern in the spectra of Figure 3. It can be reliably measured however, after subtraction of a stellar absorption spectrum. We used a simple minimization routine to find the best-fitting Vazdekis (1999) model, over the range 4900–5100Å, after broadening to match the velocity dispersion of the galaxy. The [OIII] equivalent width was then measured from the residual spectrum, in which the [OIII] doublet is clearly revealed (see Figure 8).

For completeness we show in Figure 9 the relation between the [OII] and [OIII] emission lines for all galaxies where we could measure significant values. We determine a linear relation of [OIII] [OII]. The equivalent width of the [OII] emission for all sample galaxies is 7 Å.

4.3 Indices used in this paper
For clarity, we summarize here the various absorption line indices discussed in this paper, their sensitivities and their relative merits.
4.3.1 Age-sensitive indices
The features most useful for inferring ages in integrated spectra are the Balmer series lines of Hydrogen. Given the spectral range of our data, we employ and in this role.
A pitfall in using the Balmer lines is that the stellar absorption features can be contaminated by nebular emission. It is possible, in principle, to correct for this effect using an assumed relationship between the Balmer emission and the strength of the [OII] or [OIII] lines. For instance Trager et al. (2000a) concluded that 0.6 times the [OIII] emission is a good estimate for the -emission. However, in their sample of 27 galaxies the correction factor varies from 0.33 to 1.25. Therefore it is doubtful whether this correction is accurate for an individual galaxy (see also Mehlert et al. 2000), although it may be a good correction in a statistical sense.
Much better established are the ratios between the Balmer line-strengths in nebular emission spectra: e.g., / , / (Osterbrock 1989). These ratios do not carry through directly to the indices, because the Lick system does not measure the equivalent width of the features alone, due to neighbouring lines of other species in typical early-type galaxy spectra. However, the ratios above can be used as input to simulations of nebular contamination. Our tests with artificial contamination of galaxy spectra give the following results: if the -index is contaminated by, say, 1.0 Å emission then the -indices will be affected by Å and the -indices by only Å. Hence, using the results of Trager et al. (2000a), the average correction for the indices is , while for the indices it is .
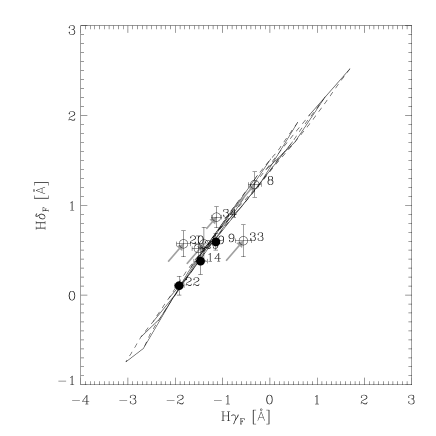
This alone would only give a factor of 1.7 improvement between the -index and the -indices, but one also has to take into account the range spanned by the indices, compared to the error in their determination. For example, at solar metallicity, the absorption changes by 1.8 Å between a 17.8 Gyr model and a 1.6 Gyr model, yet the -index changes by 4.4 Å for the same age range. The total Balmer-index error is a function of S/N, but also dependent on how well one can correct it for emission contamination. Hence the optimal choice of the Balmer line depends on the dataset. We will see that the LDR galaxies exhibit nebular emission more frequently than is typical for cluster E/S0s, and also with slightly greater strength. Largely motivated by this fact, we will adopt the -index as our age-sensitive index, since it significantly reduces the emission contamination compared to the -index, while it shows similar error statistics. Although is available for the LDR sample, it is not covered by the Fornax data. For completeness we show the relation between the index and the index for the galaxies in low-density regions in Figure 10.
Abundance ratio influences on the -index are thought to be small [Trager et al. 2000a] and should therefore not compromize our results. The dependence of the -index on abundance ratios is unknown and will not be considered in this paper.
4.3.2 Metallicity-sensitive indices
The metallicity-dependent indices in the spectral region observed are associated principally with iron and magnesium dominated features. Since early-type galaxies generally exhibit non-solar abundance ratios of Mg relative to Fe [Peletier 1989, Worthey, Faber & González 1992, Weiss, Peletier & Matteucci 1995, Jørgensen 1999, Trager et al. 2000b, Kuntschner 2000] and probably also other elements (e.g., Vazdekis et al. 1997), metallicity estimates are dependent on which index or combination of indices is employed.
In order to suppress these metallicity biases, and to compare with theoretical model prediction of hierarchical galaxy formation models, we aim to measure a mean metallicity representing all elements. Observationally this is very difficult and can only be approximated. For example, González defined the [MgFe]-index222 , [González 1993] which combines the -element Mg with the contributions of Fe. Although the exact combination and relative abundances of -elements to Fe in early-type galaxies are not well determined (e.g., Vazdekis et al. 1997, Worthey 1998, Vazdekis et al. 2001), the [MgFe] index provides a good first-order estimate of the mean metallicity [Trager et al. 2000a, Kuntschner et al. 2001].
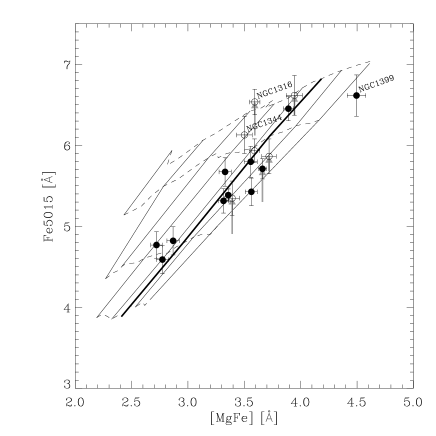
While the [MgFe]-index is a good mean metallicity indicator it also shows a significant dependence on age variations as we will see in Section 5.2. An index which is less dependent on age, while similarly being sensitive to a wide range of elements, is Fe5015. We show in Figure 11 the relation between [MgFe] and Fe5015. The indices show a good correlation and we conclude that Fe5015 can also be used as a good mean metallicity indicator.
The Fe5015 index is affected by [OIII] emission in its central bandpass, and by [OIII] emission in its blue continuum bandpass. By artificially adding [OIII] and [OIII] emission to galaxy spectra and examining the effects on the Fe5015 index, we have established that the emission contamination can be corrected by adding to the Fe5015 index. It is important to note that the error of this correction is dominated by the measurement error of [OIII] and not by the error in the correction factor of 0.61 (see also Figure 8). This is in contrast to the Balmer line correction based on [OIII], where the correction factor dominates the error since the true ratio varies greatly from galaxy to galaxy [Trager et al. 2000a].
Note that the C24668-index, which is perhaps also a good indicator of mean metallicity [Worthey 1994, Kuntschner & Davies 1998], is not used here, since the Jones (1999) library on which the Vazdekis (1999) models are based do not cover this region of the spectrum.
5 RESULTS
In our analysis of early-type galaxies in low-density regions we focus on three key stellar population diagnostics: (i) the Mg– relation, (ii) the luminosity-weighted ages and metallicities as inferred from line-strength diagrams and (iii) the abundance ratios as determined from Mg and Fe absorption lines. In this analysis we take a two-fold approach by comparing the observed quantities directly with a sample of early-type galaxies in the Fornax cluster and by analysing the observed quantities with respect to stellar population models.
Most of the Fornax cluster data was published in Kuntschner & Davies (1998) and Kuntschner (2000). However, we have re-observed four galaxies during this project and also added a further three early-type galaxies in the Fornax cluster (see Table 5). In order to make a fair comparison with the LDR sample we only select galaxies in the Fornax cluster with a central velocity dispersions of km s-1, yielding a sample of 17 cluster galaxies (11 Es and 6 S0s). The cut in velocity dispersion was chosen to match the faint end luminosity and mass distribution (as measured by the central velocity dispersion) of our sample of galaxies in low-density regions (see also Figure 7). We did not attempt to match the mass distribution for the bright galaxies since we did not select against these galaxies in the LDR sample. A velocity dispersion cut would remove only two galaxies from the Fornax sample (NGC 1399 and NGC 1404). The results presented in this section do not depend critically on the details of selecting the comparison sample; the small effects of matching cluster and field luminosity distributions are commented on, where relevant. We emphasize that in this study we re-analyse the Fornax sample at 4.1 Å (FWHM) spectral resolution and also correct the data to the nominal aperture of the LDR sample (see Appendix A).
5.1 Mg2– relation
Early-type galaxies in clusters show a tight relation between the absorption strength of the Mg feature at 5175 Å and their central velocity dispersion. This relation has been used to probe galaxy formation nearby (e.g., Colless et al. 1999, Kuntschner et al. 2001) and at medium redshift (e.g., Ziegler & Bender 1997; Ziegler et al. 2001). Although the interpretation of the Mg– relation is complicated by the degenerate effects that particular combinations of age and metallicity can have on the Mg line-strength, these studies have generally concluded that most of the stars in cluster E/S0s formed at .
The galaxies in the Fornax cluster show a tight Mg2– relation with an observed rms scatter of only 0.021 mag (see Figure 12b):
| (1) |
Note that the observed scatter is much larger than the typical observational error: the dominant source of dispersion is the intrinsic scatter in properties from galaxy to galaxy.
The observed scatter and slope are in good agreement with the results from recent studies of larger samples of mostly cluster early-type galaxies [Jørgensen 1997, Colless et al. 1999, Kuntschner et al. 2001]. NGC 1316 (Fornax A), the prominent merger galaxy in the Fornax cluster (Schweizer 1980, 1981), shows weaker than average Mg2 absorption for its velocity dispersion () consistent with the effects of young stellar populations. However, it is surprising that this merger galaxy doesn’t deviate more clearly from the mean relation as recent estimates of its luminosity-weighted mean age are around 2–3 Gyr [Kuntschner & Davies 1998, Mackie & Fabbiano 1998, Gómez et al. 2001, Goudfrooij et al. 2001]. Stellar population models [Vazdekis 1999] predict for a change in luminosity-weighted age from 10 Gyr to 2.5 Gyr at solar metallicity.

The galaxies in low-density regions (Figure 12a) follow an Mg2– relation very similar to that of the cluster sample. A formal straight line fit results in a slightly steeper relation (long dashed line). However, due to the small numbers of galaxies this difference in fitted slope is not significant. A fit to the LDR galaxies with a fixed slope of 0.216 (as found for the Fornax cluster) gives a difference ( of 0.0040.003 mag in the intercept, which is not significant. The observed rms scatter with respect to the slope of the Fornax galaxies is 0.012 mag. Surprisingly, this is significantly smaller than the scatter measured for the Fornax cluster (F-test significance ). However, when we use the Mg b– relation instead of the Mg2– relation, we find an observed scatter of the same size for the LDR sample as for the Fornax cluster.
In our small sample of galaxies we find no significant shift in the zero-point between the cluster galaxies and the LDR galaxies. Furthermore there is no evidence for increased scatter in the LDR sample, which might be expected if these have experienced more diverse formation histories. Taken at face value, the Mg– relation would suggest that the star-formation history of LDR and cluster galaxies is very similar. This test on its own, however, is not a conclusive test of the star-formation histories since an anti-correlation of age and metallicity effects can conspire to produce a tight Mg– relation while hiding a complex star-formation history [Colless et al. 1999, Trager et al. 2000b, Kuntschner et al. 2001]. NGC 1316 in the Fornax cluster is perhaps a good example of this scenario.
In the next section we will explore the luminosity-weighted ages and metallicities in a more direct approach.
5.2 Ages and metallicities
Luminosity-weighted ages can be inferred from an age/metallicity diagnostic diagram by plotting an age-sensitive index and a metallicity-sensitive index against each other. In order to make age and metallicity estimates, we use the Vazdekis (1999) models. We describe these models and their differences with respect to other models in Appendix B. In this section, we will present first a diagram of the [MgFe] index vs in order to demonstrate the nebular emission contamination which affects this combination, especially for our LDR sample. Then, by using a higher order Balmer line (), we will analyse diagrams with greater robustness against nebular emission.
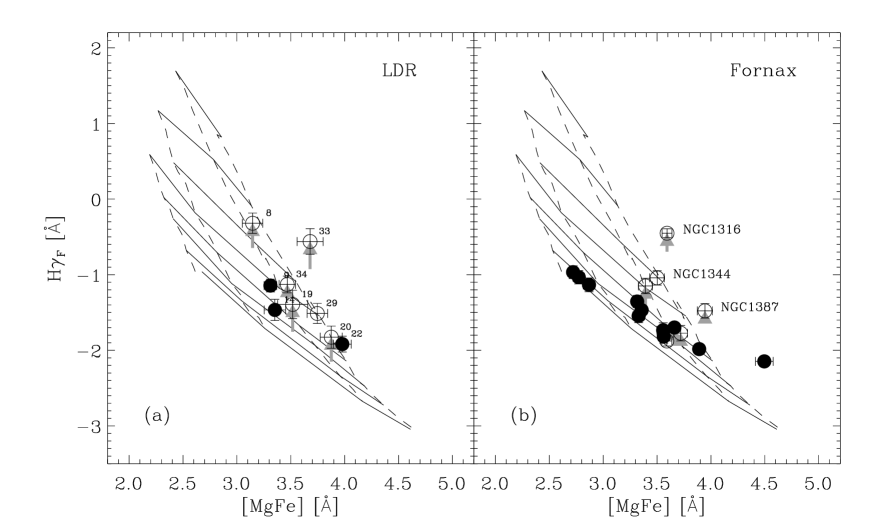
Figure 13 shows a diagram of [MgFe] against for the LDR sample as well as the Fornax cluster galaxies. The emission corrections for the index are indicated by grey arrows. Prior to any emission correction (see Section 4), the LDR sample spans a wide range in line-strength from 1.1 to 2.3 Å. However, the line-strength measurements below 1.4 Å are strongly affected by emission. After the emission correction, affecting five out of nine galaxies, all measurements are larger than 1.4 Å, which is consistent with the model predictions by Vazdekis (overplotted on Figure 13). Although the corrected values indicate a large luminosity-weighted age range from 2.5 to 18 Gyr it is difficult to draw any firm conclusions from this diagram due to the uncertainties in the emission correction, which can be as large as the correction itself for the -index. The distribution of galaxies in the vs [MgFe] diagram is reminiscent of the shell and pair galaxies observed by Longhetti et al. (2000).
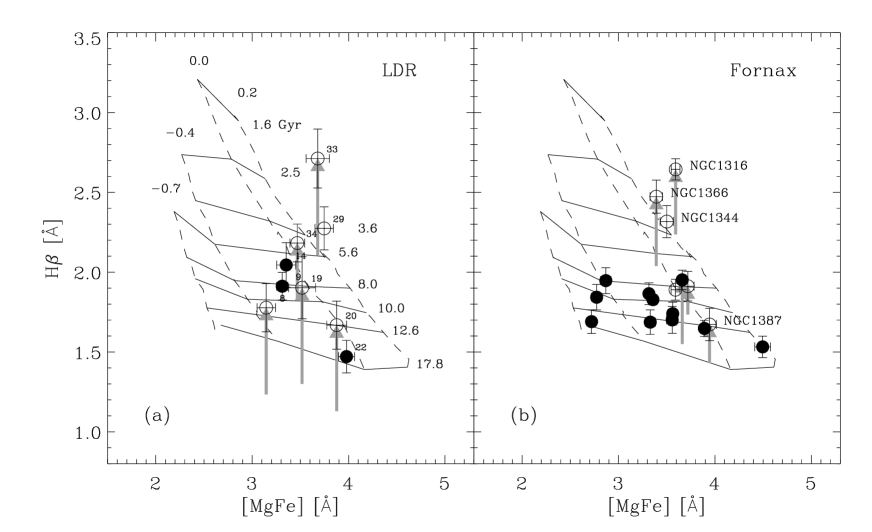
The Fornax sample of galaxies (Figure 13b) contains only five galaxies out of 17 with emission corrections. Furthermore the correction is, on average, slightly smaller than that of the galaxies in low-density regions. Therefore this diagram is much more useful to infer luminosity-weighted ages and metallicities for Fornax galaxies, than its counterpart for the LDR sample. In Fornax, we find mainly a sequence of metallicity at age 12 Gyr, with only three galaxies having clearly stronger line-strength and therefore younger ages (NGC 1316, NGC 1344 and NGC 1366). This re-analysis of the Fornax data is in excellent agreement with the earlier study by Kuntschner (2000).
We find that our LDR sample shows a marginally higher fraction of galaxies () with significant emission lines (e.g., [OII] and [OIII]) than our cluster sample (). When [OIII] emission is present it also tends to be slightly stronger for these galaxies (Fornax: Å, Field: Å). After the emission corrections, the galaxies in low-density regions show on average stronger absorption than the ellipticals in the Fornax cluster. We find approximately three galaxies which occupy the same region in the diagram as NGC 1316 and NGC 1344, which both show signs of a recent merger.
Figures 14a & b show the [MgFe] vs diagram for the LDR sample and the Fornax cluster galaxies. The reduced sensitivity against Balmer emission can be clearly seen in the reduced size of the emission corrections (grey arrows). By using the index as age indicator we are less sensitive to emission, but at the same time the sensitivity to age is reduced compared to the -index. This can be seen in Figure 14 where the lines of constant age and constant metallicity, as predicted by the stellar populations models, are not as well separated as in Figure 13. Again, the Fornax cluster shows a tight sequence of galaxies along roughly a constant age line with only three lenticular galaxies scattering towards younger luminosity-weighted ages. The LDR galaxies span a wide range in ages, from as old as the Fornax ellipticals to as young as NGC 1316.
In order to improve the separation of age and metallicity effects we plot in Figure 14c & d the vs Fe5015 diagram. Relative to [MgFe], the Fe5015 index shows reduced sensitivity to changes in the age of a stellar population. Clearly this new index combination disentangles the effects of age and metallicity more powerfully than the previous diagram. Emission corrections, which affect both indices, have been applied to the indices (grey arrows).
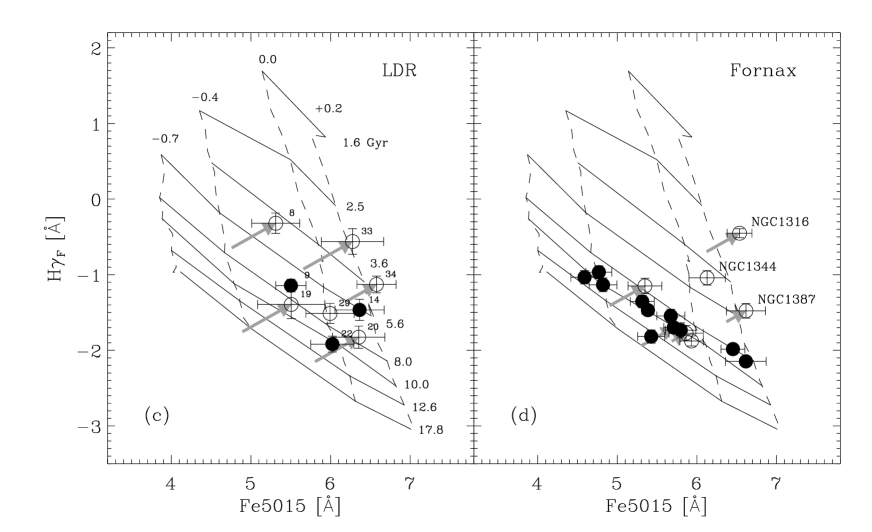
From the vs Fe5015 diagram we measured the ages and metallicities with respect to the Vazdekis (1999) models. For this purpose, we linearly interpolated between the model grid points and also linearly extrapolated the models to a metallicity of (necessary for two galaxies in each sample). We note that the resulting ages and metallicities are subject to systematic offsets. For example, had we used a different index combination, we would have determined slightly different absolute ages and metallicities. However, the relative ranking within the sample and between the samples would not be significantly different. For instance, the ages measured from the [MgFe]– diagram are on average 1 Gyr older than those obtained from the Fe5015– analysis. The metallicities show a negligible offset. These comparisons exclude galaxies with significant emission.
In Figure 15, we show the estimated ages and metallicities as a function of absolute -magnitude for both the LDR sample and the Fornax cluster sample. The Fornax cluster shows a tight sequence of elliptical galaxies with an average age of 10.2 Gyr (indicated by the dashed line in Figure 15b). The S0s show a large range in ages. The average age of elliptical and lenticular galaxies in low-density regions ( Gyr) is lower compared to the E/S0s in the Fornax cluster ( Gyr; errors are quoted as errors on the mean). If we select our comparison sample by applying an upper mass cut (velocity dispersion), the average age of Fornax galaxies is Gyr. Matching the luminosity range for the bright end of field and cluster samples gives for the Fornax cluster a mean age of Gyr. Thus, our result is not sensitive to the detailed selection of the comparison sample.
The age difference between cluster and low-density region sample can perhaps be partly explained by the higher relative fraction of lenticular galaxies in the low-density region. Unfortunately, given the very small sample size, it is not possible to determine whether environmental effects act to change the properties of certain subclasses of galaxies (e.g. S0s and ellipticals), or whether the overall effect is due to a change in the relative proportions of such subclasses in the population. It is quite possible that both mechanisms apply, and the distinction between them is not necessarily entirely clear.
For both the Fornax and LDR samples, our metallicity measurements show a correlation with absolute -magnitude in the sense that brighter galaxies are more metal rich. We note that the LDR sample does not contain any low metallicity ([Fe/H]-0.4) galaxies even at the faint end of our sample, whereas the Fornax cluster shows three elliptical galaxies in this metallicity range. In fact, at any given luminosity, the LDR sample shows on average a stronger metal content than the cluster sample ( dex, see Figure 15c, dotted line). The last statement is also true if we use the central velocity dispersion as x-axis in Figure 15, albeit with a smaller metallicity offset of dex.

The random and systematic errors affecting the age and metallicity estimates are correlated, such that an overestimation of the age leads to an overestimation of the metal content. Is it conceivable, then, that a systematic effect is responsible for the difference between LDR and Fornax samples in Figure 15? The analysis of the two samples is identical, with the same spectral resolution, stellar population models and measurement techniques, therefore minimizing systematic offsets between the samples. Clearly a potential source of error lies in the emission corrections, which are slightly larger and more frequent for the LDR galaxies than for the Fornax sample. Our principal results are, however, quite robust against the choice of index combination used for the age and metallicity estimates (i.e., the [MgFe]– and Fe5015– diagrams yield the same conclusions). We are therefore confident that the differences between the two samples in Figure 15 do indeed indicate that E/S0s in low-density regions harbour younger and more metal-rich stellar populations than cluster E/S0s of comparable luminosity.
5.3 Abundance ratios
In this section, we investigate the Mg-to-Fe abundance ratios in our sample of LDR galaxies. While, as shown in the previous section, one can obtain estimates of the luminosity-weighted ages and metallicities from line-strength indices, it is more difficult to extract information on the duration and strength of the star-formation process. The abundance ratios of certain elements, e.g., [Mg/Fe], however, can carry crucial information about the star-formation time-scales.
The chemical enrichment process in galaxies is predominantly driven by the ejecta of SN Ia (the main producer of Fe peak elements) and SN II (producing mainly alpha elements such as Mg). Because SN Ia (1 Gyr time-scale) are delayed compared to SN II which explode on short time-scales ( yr), the [Mg/Fe] ratio is determined by (i) the duration of the star-formation and (ii) the initial mass function (IMF, see e.g., Worthey, Faber & González 1992).
It is now well established that elliptical galaxies in clusters show non-solar abundance ratios of certain elements. For example [Mg/Fe] is generally positive in the range 0.1 to 0.3 [Peletier 1989, Worthey, Faber & González 1992, Weiss, Peletier & Matteucci 1995, Jørgensen 1999, Trager et al. 2000b, Kuntschner 2000, Kuntschner et al. 2001]. This is generally interpreted as evidence for a short star-formation time-scale (perhaps combined with a top-heavy IMF) in early-type galaxies, i.e., the star formation stopped before the products of SN Ia could be incorporated into the stars we observe today. In environments where star formation can continue for a longer time, e.g., the disc of our own galaxy, one expects solar abundance ratios for the younger, more metal rich stars, which indeed is the case [Edvardsson et al. 1993, McWilliam 1997].
Following Trager et al. (2000a), we estimate the [Mg/Fe] ratios with the help of a Fe vs Mg b diagram and stellar population models. For the detailed procedure see Kuntschner et al. (2001). The luminosity-weighted ages, which are needed to make the [Mg/Fe] estimates, were taken from the vs Fe5015 diagram. We note that for recent (i.e., 1 Gyr) star-bursts contributing only a small fraction in mass of the total galaxy, the above method of estimating the abundance ratios can lead to an overestimation of [Mg/Fe] [Kuntschner 2000]. Hence the abundance ratio measurements for the younger galaxies should be interpreted somewhat more cautiously.

Our estimates of [Mg/Fe] are shown in Figure 16, as a function of central velocity dispersion. In the Fornax cluster, most of the galaxies have ratios of [Mg/Fe] = 0.1 to 0.2, with a weak tendency towards larger [Mg/Fe] ratios for more massive galaxies. A straight-line fit, taking errors in both variables into account, is shown as solid the line. The relation found by Kuntschner et al. (2001) for a larger sample of mostly cluster elliptical galaxies, shown as plus signs in Figure 16, is slightly steeper (dashed line). However, the [Mg/Fe] values for Fornax are in good agreement with the Kuntschner et al. (2001) sample. Note that the Kuntschner et al. (2001) data was not corrected to the nominal aperture which we use in this study. However, preliminary investigations into the radial gradients of [Mg/Fe] in elliptical galaxies show that the abundance ratios are roughly constant at least out to one effective radius [Kuntschner 1998, Halliday 1999, Davies et al. 2001].
For the galaxies in our LDR sample, we estimate a range in to 0.3. These values are similar to the [Mg/Fe] ratios found for the cluster galaxies. Only LDR 09 and LDR 29 show roughly solar abundances, thus deviating significantly from the cluster galaxies. We note that the galaxies identified in Section 5.2 as having younger luminosity-weighted ages (LDR 08, 33, 34), are consistent with the cluster [Mg/Fe]– relation.
6 DISCUSSION
6.1 The number and luminosity distribution of early-type galaxies in low-density environments
In the introduction to this paper we already hinted at the problems concerned with the definition of a ‘field’ galaxy sample. This definition can range from selecting all galaxies, including systems in rich clusters [Benson, Ellis & Menanteau 2001], to the very strict isolation criteria applied in this paper and by Colbert et al. (2001). The definition chosen necessarily depends on the specific application for which the sample was designed. Furthermore, observational or computational restrictions may influence the sample construction. Evidently, therefore, when comparisons are made between different observations or with theoretical model predictions one has to account carefully for any differences in the definition of the samples. This caveat is especially true when, as in this section, we discuss parameters related to the number density of field E/S0s, or their luminosity distribution.
Do the LDR galaxies have the same luminosity function as early-type galaxies in general? In Figure 17, we show the luminosity function of the putative parent sample, specifically those FLASH survey galaxies with nominal types E or S0 lying within 7 000 km s-1. Overlaid as the hatched region is our sample of early-type galaxies in low-density environments. Although we do not find any galaxies in low-density environments brighter than , this is not surprising, since there are only few such galaxies in the parent sample. Specifically, 95% of the E/S0s in the parent sample have . In a random nine-galaxy subsample, the probability of selecting no galaxies above this luminosity threshold is therefore . At low luminosities, the LDR luminosity distribution seems to fall off much more rapidly than that of the parent catalogue. This discrepancy may be caused by our counting neighbours to a limiting apparent magnitude, rather than absolute luminosity. This results in the nearby galaxies (and consequently the low-luminosity galaxies) being subject to somewhat tighter selection criteria than more distant (luminous) candidates. It is also possible that many of the FLASH ‘early-type’ galaxies in this luminosity range are in fact spirals: Figure 7 shows that six out of seven LDR candidate galaxies with in fact exhibit spiral morphologies in the CCD imaging.
The total number of galaxies of all morphologies, which satisfy our isolation criteria, is 165. Thus, we estimate that the relative fraction of early-type galaxies, relative to all types, in low-density environments is . In this calculation we have corrected for the ten unobserved candidates, assuming the same confirmation rate as for the observed galaxies (37.5%). This fraction, which is of course sensitive to our specific selection criteria, could be interpreted as the asymptotic limit of the morphology-density relation (e.g., Dressler 1980, Dressler et al. 1997, Hashimoto & Oemler 1999, Tran et al. 2001). Note that even in the lowest-density bin of the Dressler (1980) cluster study, the fraction of E/S0s is still of order 50%. At face value, then, the morphological mix in the most isolated environments is dramatically different from that in the outskirts of clusters.
Our sample selection criteria are similar in spirit to those of Colbert et al. (2001), who compiled an all-sky sample of 30 early-type galaxies from the RC3 within 9 900 km s-1. Their isolation criteria are slightly more stringent than ours, since they require that their galaxies have no known neighbour within a radius of 1 Mpc and km s-1. It is interesting that this sample has no galaxies overlapping with ours. The Colbert et al. sample in principle probes a volume 150 times larger than the LDR sample, at least for the brightest galaxies where both catalogues are volume limited. Accounting for the different limiting magnitudes, we estimate that the galaxies in the Colbert et al. sample have a lower space density, by a factor of 40, than those of our sample. This difference can probably be explained by the stricter isolation criteria and by the brighter magnitude limit of the RC3, but there could also be contributions from incompleteness in the RC3 and available redshift data. The two samples have very different luminosity distributions, with the Colbert et al. galaxies spanning to mag, whereas our selection criteria produce a sample with to mag. As noted above, the lack of very luminous galaxies in the LDR sample is not inconsistent with the parent catalogue luminosity function. In the Colbert et al. sample, the brighter magnitude limit and much larger survey volume yield a final sample with more highly-luminous systems.
Together, the LDR and Colbert et al. samples indicate that there do exist bona-fide early-type galaxies in low-density regions (selected by criteria at least as stringent as ours), with luminosities brighter than mag. These galaxies are scarce in the nearby universe, although quantitatively the number density of such galaxies is clearly determined by the selection criteria imposed.
We note here that an alternative approach to defining a ‘field’ sample of early-type galaxies has been pursued by Grogin & Geller (1999, 2000). By smoothing the CfA2 redshift survey map on 5 Mpc scales, these authors define large-scale (30 Mpc) ‘void’ regions within the survey, and select galaxies from these voids for follow-up. The selection therefore differs from our method (and from that of Colbert et al.) in being less ‘local’: a galaxy would not be excluded by the presence of immediate neighbours, if its large-scale environment is of low galaxy density.

Finally, we conclude that the selection criteria of Bernardi et al. (1998), who compile a sample of 631 ‘field’ early-type galaxies (within 7 000 km s-1) must be very much less stringent than ours, and probably include galaxies which reside in small groups or clusters. This is probably also true for all studies at significant redshifts, where redshift catalogues are often very much incomplete, or where galaxies are selected only by projected distribution on the sky.
6.2 Morphological merger signatures
The pioneering work of Schweizer and collaborators (e.g., Schweizer et al. 1990, Schweizer & Seitzer 1992, see also Forbes 1991) has linked the occurrence of morphological disturbances in early-type galaxies such as ripples and shells, which are taken to be signs of merger events (Hernquist & Quinn 1988, 1989), to the presence of young stellar populations.
A visual inspection of our optical images (Smith et al., in preparation) reveals that the LDR sample shows a variety of morphological features indicative of recent merging and/or interaction events. In particular, disturbed interacting companions are seen in five cases (LDR 08, 09, 19, 20, 33), tidal debris in four (LDR 08, 09, 20, 33), and secondary intensity maxima along the major axis in two (LDR 20, 29)333These features could be interpreted as Lindblad or ultraharmonic resonances of an inner bar (see e.g., van den Bosch & Emsellem 1998) or as the inner cut-off points of a ‘Freeman type II’ disk [Freeman 1970].. There are prominently blue, and presumably star-forming, circumnuclear rings in two galaxies (LDR 08, 34). Combining these indicators, six sample members show some peculiarity (LDR 08, 09, 20, 29, 33, 34). The remaining three galaxies (LDR 14, 19, 22) seem to be comparatively undisturbed. Five galaxies (LDR 08, 09, 14, 22, 33) are listed in the Arp & Madore (1987) catalogue of peculiar galaxies. For detailed comments on individual galaxies, see Appendix C.
Taking the detection rate of shells and tidal tails of 41% from the Colbert et al. analysis, we should find 4 such galaxies in our sample of nine, which is in good agreement with the above. The fraction of galaxies in groups/clusters with shells or tidal tails is much lower (i.e., 8%, Colbert et al. 2001). However, the hostile cluster environment may destroy these morphological signs of merging very quickly and it is therefore difficult to compare either the intrinsic frequency of mergers, or when they happened.
We note that the lenticular galaxies in low-density regions have not necessarily experienced the same formation history as cluster S0s, despite their similar morphological appearance. In clusters it is possible to create S0s via tidal stripping by intra-cluster gas, a mechanism which does not affect galaxies in the field. In these low-density environments, it is more likely that S0s form by minor-mergers and/or accretion of gas which settles in a disk. LDR 08 (see Appendix C) may perhaps be an example of this latter process in action. Due to infall from the field, clusters are likely to contain galaxies of either formation type, or which have experienced both of these pressures towards S0 morphology.
6.3 Ongoing star-formation in LDR galaxies?
Compared to the cluster sample, the LDR sample shows both a higher fraction of galaxies with emission (field: 56%; cluster 29%) and slightly stronger emission lines. The average [OIII] equivalent width, for galaxies with significant emission, is Å and Å for the LDR and cluster sample respectively. This ‘enhanced’ emission in low-density regions is good evidence for a prolonged, or at least more recent, period of star-formation activity.
This result can be set in respect not only to a local cluster environment but also to higher redshifts. The [OII] emission strength for our nearby sample of LDR galaxies is in the range of 3 to 7 Å (equivalent width). This is much lower than Schade et al. (1999) found for their sample of field early-type galaxies at medium redshift (), where one third of the ellipticals show [OII] emission in excess of 15 Å. At face value, this indicates that the rate of star-formation in E/S0s outside clusters has declined between and the present day. The [OII] emission strengths for LDR galaxies translate into star formation rates of solar masses per year [Kennicutt 1992], which is small compared to the medium redshift sample.
Our observations probe only a nuclear region of each of the galaxies and so any star-formation at larger radii will not be included in our measurements. Although a good fraction of our galaxies show tails, rings and debris at large radii, the surface brightness of these features is very low. Only two galaxies (LDR 08, 34) show prominent circumnuclear rings in our U-band images, and the [OII] emission is indeed stronger where the slit intersects these rings. This means that ‘aperture corrections’ for [OII] equivalent widths may potentially be large, and highly unpredictable.
We conclude that our [OII] equivalent width measurements provide some evidence for a reduction in star formation rate between and the present time, but that this result may be sensitive to the distribution of star formation activity within the galaxies.
6.4 Luminosity-weighted age and metallicity distributions
The high frequency of disturbed morphologies, the existence of interacting neighbours and nebular emission lines in our low-density region sample are all good evidence for merger induced star-formation at low redshifts. Yet none of the galaxies currently exhibits a high level of star-formation.
In Section 5.2, we estimated luminosity-weighted ages and metallicities for the LDR galaxies. The luminosity-weighted ages range from as old as the elliptical galaxies in the Fornax cluster (10 Gyr) to as young as 3 Gyr, comparable with the merger galaxy NGC 1316 in Fornax. In the Fornax cluster, there is a clear distinction between elliptical galaxies being all old, and the lenticular galaxies showing a large spread in age. This separation is not seen so clearly in the LDR sample, as there are two ellipticals with luminosity-weighted ages smaller than 8 Gyr. The overall age distribution of the early-type galaxies in low-density regions is similar to the distribution of the Fornax S0s, while the average age of the LDR sample is 2–3 Gyr younger than the Fornax sample of early-type galaxies.
Bernardi et al. (1998) investigated the Mg2– relation in their sample of field early-type galaxies drawn from the ENEAR survey [da Costa et al. 2000]. They detected a small but significant offset of 0.007 mag in the zero-point between the field and cluster/group galaxies (the field having on average weaker Mg2 absorption). Using stellar population models, they translated this difference into an average luminosity-weighted age difference of 1 Gyr (the field being younger). We discussed already the difference in selection criteria, which complicates a direct comparison of these results with ours. However, we find no significant shift in the Mg2– zero-point, although we find a larger age difference between the low-density environment and the cluster. This can be explained by the young stars having also a higher metallicity, a so-called age–metallicity anti-correlation [Colless et al. 1999, Trager et al. 2000b]. This effect can be seen directly in panel c of Figure 15 where we demonstrate that the low-density region galaxies are on average more metal rich than their cluster counterparts. Anti-correlations between the age, or the metallicity with the abundance ratios can also contribute to the tightness of the Mg2– relation [Trager et al. 2000b, Kuntschner et al. 2001]. However, since we do not find a significant difference in the [Mg/Fe]– relation between the cluster and low-density environments, it seems unlikely that the [Mg/Fe] ratios play a major role in stabilising the Mg– relation. We conclude, that the analysis of the Mg2– relation can be quite ambiguous and even mis-leading if an anti-correlation of age and metallicity is present.
Trager et al. (2000b) note that early-type galaxies, regardless of their local environment, populate a two-dimensional plane in the four-dimensional space of [M/H], , , and [Mg/Fe] where, at a given velocity dispersion, galaxies with younger ages have higher metallicity. Considered jointly, our samples of galaxies in low-density regions and in the Fornax cluster follow a similar relation. Only LDR 08 deviates significantly from the relation.
Although the sample is too small to permit a detailed comparison of spectroscopic results with the presence of morphological peculiarities, we note that the youngest galaxies in the LDR sample (LDR 08, 33, 34) all show clear signs of interaction, or show blue rings near the nucleus. (see Section 6.2). The two oldest galaxies (LDR 19, 22), which also lie on the cluster [Fe/H] relation, are among the three most morphologically regular LDR galaxies.
6.5 Confrontation with semi-analytic models
Recent semi-analytic models are able to predict the distribution of luminosity-weighted age and metallicity in hierarchical galaxy formation scenarios, as a function of halo mass. In this section we compare our observational results with the models developed by the ‘Durham’ group [Baugh et al. 1996, Cole et al. 2000]. We discuss the predictions of the ‘Munich’ models [Kauffmann & Charlot 1998] where these differ from the Durham results. In Figure 18, we show -band weighted age, metallicity and velocity dispersion444The velocity dispersion is inferred from the predicted circular velocity of the bulge, i.e., predictions for field and cluster early-type galaxies, as a function of absolute blue magnitude . These predictions are from the so-called ‘reference’ model of Cole et al. (2000). The predicted luminosities, ages and metallicities of the model galaxies are derived from (-band weighted) superpositions of individual simple stellar population models. Thus, to first order, the parameters in Figure 18 should be directly comparable to the estimated age and metallicities derived from our observations. Only very recent bursts (1 Gyr) could introduce effects which would invalidate this comparison. In the models we have defined galaxies in low-density environments as those residing in dark-matter halos with mass , while ‘cluster’ members are located in halos of mass . The morphologies of the model galaxies are assigned based on the bulge-to-total B-band light ratio: ellipticals have 0.6 B/T 1.0, while lenticulars have 0.4 B/T 0.6.

6.5.1 Ages
The Durham models predict that ellipticals and lenticulars in clusters should have a mean luminosity-weighted age of Gyr with a small spread in age ( Gyr). Some of the cluster lenticular galaxies scatter towards younger ages. By contrast, the field E/S0s show a more evenly populated distribution of ages from 2–10 Gyr, and exhibit younger ages on average (mean age: Gyr, see Figure 1 & 18). The lower ages for field E/S0s result from the greater probability of low-redshift mergers where relative velocities are small (specifically, through the dependence of the dynamical friction timescale on halo mass: Equation 4.16 of Cole et al.). Younger ages are predicted for the more luminous field galaxies, which are the last to form in these models.
Comparing our observed luminosity–age relations (Figure 15a, b) with the semi-analytic predictions, we find good agreement, at least qualitatively: the LDR sample exhibits greater spread in age, and is offset to a mean luminosity-weighted age significantly smaller than that of the Fornax elliptical galaxies. While the Fornax sample does contain three lenticular galaxies (labelled in Figure 15) with measured age less than 8 Gyr, these represent only 18% of the sample; for the LDR galaxies, the equivalent proportion is 67%.
Our data therefore support the Cole et al. predictions in respect of the luminosity-weighted age vs luminosity relationships. Note that the Munich models by contrast predict a much smaller age difference between field and cluster (although in the same sense), and a strong age–luminosity correlation in clusters which is not observed in Fornax (Figure 4 of Kauffmann & Charlot 1998).
6.5.2 Metallicities
For the metallicity distributions, the situation is more complex. In the Durham models, a luminosity–metallicity relation is predicted both in the field and in clusters, but its shape, zero-point and scatter are sensitive to the environment. In the model, field galaxies with have typically lower metallicities (at fixed luminosity) than in clusters. The relation flattens in clusters, such that the field and cluster metallicity distributions are similar for the brightest galaxies (see Figure 18).
Contrary to these predictions, our observational results (Figure 15b, c) favour a higher metallicity (at fixed luminosity) in the field, by a factor of . All of our LDR galaxies are fainter than , where the models predict an offset in the opposite sense. Moreover, the predicted flattening of the cluster luminosity–metallicity relation at bright magnitudes is not observed in the Fornax data. The predicted luminosity–metallicity curvature also generates a flattening of the colour–magnitude relation for bright cluster ellipticals, which is not observed (see Figure 13 of Cole et al. 2000). In fact, the failure to match the observed slope and form of the colour–magnitude relation has been key difficulty in the development of semi-analytic galaxy formation models (e.g., Kauffmann, White & Guiderdoni 1993; Baugh et al. 1996). While an acceptable fit to the colour–magnitude data can be obtained by adjusting parameters regulating yield and supernova feedback (as in ‘Model A’ of Kauffman & Charlot 1998), this approach leads to unreasonable predictions for other observables, such as the luminosity function, and so seems not to be sustainable [Cole et al. 2000]. We note that the Kauffman & Charlot strong-feedback model predicts that field and cluster galaxies follow identical metallicity–luminosity relations, in contrast to our observations.
We may summarize that the metallicity predictions disagree with the data on two counts: (i) the predicted metallicity is too low for the most luminous galaxies in clusters, with respect to less-luminous members; and (ii) the models predict a metallicity for the field galaxies which is too low compared to cluster galaxies, especially at lower luminosities. These two effects could result from the same cause, if the models unduly suppress metal production in galaxies which are dominant within their dark-matter halo. Field galaxies and, progressively, the brighter members of clusters spend a greater fraction of their histories in this privileged status. We speculate that an excessive cooling of low-metallicity halo gas onto such galaxies555e.g., through the models’ neglect of energy injection from supernovae or AGN [Bower et al. 2001]. could be a cause of the poor agreement with observed luminosity–metallicity relations.
There are alternative explanations for the field versus cluster metallicity offset. In particular, there are several ways in which the models do not predict exactly the same quantity as is measured here. Firstly, the models predict total -band weighted metallicity, where our observations measure the metallicity only via the combination of metal lines which contribute to the Fe5015 or [MgFe] indices; the effects of non-solar abundance should be explicitly taken into account for a fair comparison. More seriously perhaps, our data probes only the central regions of the galaxies, while the semi-analytic models predict ‘global’ quantities for each galaxy. Hydrodynamical simulations of galaxy mergers (e.g., Mihos & Hernquist 1996) suggest that gas is driven to the centre of the remnant; star-formation is then likely to occur primarily in the nuclear region (perhaps in the central ‘blue rings’ observed in LDR 08 & LDR 34). It is possible therefore, that in galaxies which formed new stars during a recent merger, radial age and metallicity gradients may be stronger than systems which have long been undisturbed (e.g., in clusters). This effect would clearly act to exaggerate the differences between the field and the cluster samples.
Our results can perhaps be described through a simplistic argument based on the cosmological evolution of the average stellar metallicity. If all merging and star formation ceases in cluster ellipticals after some redshift , then the average stellar metallicity at that time [M/H] will be ‘frozen’ into the cluster population. In the field, the stellar metallicity continues to rise through the incorporation of processed material into new generations of stars, a process which continues to , so that the metallicity in the field is [M/H]. For an estimate of the rate of increase in stellar metallicity, we may take a factor of 1.2 per unit (taken from Figure 14 of Cole et al.). Then using our measured metallicity offset between field and cluster, we obtain the cluster ‘freezing’ redshift: . This estimate is similar to the formation redshifts implied by the homogeneity of the colour–magnitude relation [Bower, Lucey & Ellis 1992, Kodama et al. 1998, Terlevich, Caldwell & Bower 2001] and is consistent with an age of 9–11 Gyr for the cluster ellipticals, for reasonable cosmologies.
6.5.3 Abundance ratios
Thomas & Kauffmann (1999, see also Thomas 1999) presented preliminary results from their semi-analytic galaxy formation models (CDM universe) for the distribution of [Mg/Fe] in galaxies as a function of environment, morphology and luminosity. In these models, the most luminous ellipticals are the last to form, incorporating, at least for field galaxies, the ejecta of SN Ia, as well as SN II. Hence Thomas & Kauffmann find a trend that the [Mg/Fe] ratio decreases (to approximately solar values) with increasing galaxy mass. This is even more pronounced in low-density environments as the merging process and hence star-formation continues to take place up to the present day. Fainter galaxies are predicted to span a range in [Mg/Fe] in all environments. In essence, the hierarchical galaxy formation scenario predicts that present day early-type galaxies in low-density regions show on average lower [Mg/Fe] abundance ratios than their brethren in clusters.
As pointed out by Thomas & Kauffmann, the observed trends in cluster early-type galaxies are in stark contrast to the predictions of the hierarchical galaxy formation model. We have extended the observations to low-density regions and find an increasing trend of [Mg/Fe] with central velocity dispersion, similar to that shown by cluster galaxies, albeit with a larger scatter. Thus, our data further highlight the failure of existing hierarchical models in explaining the observed abundance ratios in E/S0s.
The super-solar values of [Mg/Fe] measured for the young galaxies in our sample are surprising, because in the merger of two disk galaxies with extended star-formation histories at low redshifts, one would expect to produce an early-type galaxy with solar abundance ratios. A possible explanation could be that the progenitor either harboured stars which already match the stellar composition of a typical early-type galaxy in clusters, or that the new stars, produced in a rapid star-burst yielding super solar abundance ratios, dominate the light of the galaxy as we see it today.
7 CONCLUSIONS
We have presented an analysis of a sample of nine nearby early-type galaxies (3 elliptical, 6 lenticular), selected from a redshift survey to reside in low-density regions. The sample is drawn from a sky-area of 700 deg2, to a redshift limit of 7 000 km s-1. Our stringent selection criteria allow only up to two neighbours within a search radius of 1.3 Mpc ( km s-1 Mpc-1, q) and km s-1. While the sample size is small, we emphasize that the multiple, well-defined selection criteria guarantee that these galaxies are of E/S0 morphology, and reside in large-scale environments of very low density. We have investigated the Mg2– relation, and the luminosity-weighted age, metallicity and abundance ratio distribution. Our results have been compared to early-type galaxies in the Fornax cluster and with the predictions for hierarchical galaxy formation.
The principal conclusions of our study are as follows:
-
•
Elliptical and lenticular galaxies are rare in the ‘field’, and account for only 8% of the galaxy population in the lowest-density environments. The existing small samples of early-type galaxies in low-density environments give no evidence for any significant departure from the luminosity function of E/S0 galaxies in denser environments.
-
•
Five out of nine (56%) sample galaxies show disturbed morphologies (i.e., tidal tails or debris, blue circumnuclear rings), which is interpreted as evidence of late merger events in these galaxies. Furthermore seven galaxies show close neighbours of which five exhibit signs of ongoing interaction with the main galaxy.
-
•
Compared to the cluster galaxies, our sample shows both a marginally higher incidence of [OIII] emission, and slightly stronger emission where present. However, we do not find galaxies with significant ongoing star-formation (e.g., [OII] Å). Relative to studies of early-type galaxies at intermediate-redshift, this indicates a significant decline in star-formation activity compared to the field population at a redshift of .
-
•
The Mg– relation in low-density regions is indistinguishable from that of cluster E/S0s. However, Mg– alone is a poor diagnostic tool for detecting differences in star-formation history: intrinsic (anti-)correlations between age, metallicity and abundance ratios have degenerate effects which can conspire to maintain the scatter and zero-point of the relation.
-
•
Early-type galaxies in low-density environments exhibit a broad distribution of luminosity-weighted ages, being on average younger than cluster ellipticals, while the distribution is more similar to that of lenticular galaxies in clusters. Taking the early-type galaxy population as a whole, the low-density regions harbour galaxies with 2–3 Gyr younger luminosity-weighted ages than their brethren in clusters. This result is robust against the specific selection of the comparison sample since imposing an upper limit does not change our result significantly while matching the luminosity distribution at the bright end increases the significance of our result. The younger ages of early-type galaxies in low-density regions is predicted by hierarchical galaxy formation, where the field population forms later and also experiences merger-induced star-formation episodes at lower redshifts. We note that the youngest galaxies in our sample (LDR 08, 33, 34) all show clear signs of interaction, or show blue rings near the nucleus, the latter being suggestive of gaseous accretion.
-
•
The luminosity-weighted metallicities of E/S0s in low-density environments are larger than for cluster members of similar luminosity. This effect ([Fe/H] 0.2 dex) is not seen in semi-analytic models, which predict an offset in the opposite sense, at least for the luminosity range probed by our data. Furthermore, the current generation of semi-analytic models cannot explain the observed mass-metallicity relation of bright cluster members without compromising the reproduction of other observables, such as the luminosity function. These disagreements between the observations and semi-analytic model predictions highlight important shortcomings in the detailed treatment of the star-formation processes in present models.
-
•
The E/S0 galaxies in our low-density sample exhibit mostly super-solar [Mg/Fe] ratios. The the non-solar [Mg/Fe] values rise with central velocity dispersion, following a trend similar to that of cluster members. By contrast, hierarchical galaxy formation models predict approximately solar abundance ratios, at least for the brightest galaxies in low-density regions.
In summary, this study, though for a small sample, finds results consistent with one of the central predictions of hierarchical galaxy formation models: the formation of early-type galaxies continues to in low-density environments, while those in clusters formed most of their stars at . On the other hand, our results underscore the models’ present failure to reproduce the observed luminosity–metallicity trends and their apparent dependence on environment. A future generation of models must also overcome the stiff challenge of generating super-solar [Mg/Fe] ratios, even in galaxies formed by late-time merging of potentially spiral galaxies with extended star-formation histories.
ACKNOWLEDGEMENTS
This research has made use of the NASA/IPAC Extragalactic Database (NED) which is operated by the Jet Propulsion Laboratory, California Institute of Technology, under contract with the National Aeronautics and Space Administration. The Cerro Tololo Inter-American Observatory (CTIO) is operated by the Association of Universities for Research in Astronomy, Inc. under a cooperative agreement with the National Science Foundation. Iraf is distributed by the National Optical Astronomy Observatories which is operated by the Association of Universities for Research in Astronomy, Inc. under contract with the National Science Foundation. HK acknowledges support from the PPARC grant ‘Extragalactic Astronomy & Cosmology at Durham 1998-2000’ and the ESO fellowship program. RJS acknowledges partial financial support from FONDECyT–Chile (Proyecto 3990025). RLD gratefully acknowledges the award of a Research Fellowship from the Leverhulme trust and a PPARC Senior Fellowship. We thank Carlton Baugh, Shaun Cole and collaborators, for providing access to their semi-analytic model predictions, and for helpful discussions concerning the interpretation of the models.
References
- [Abell, Corwin & Olowin 1989] Abell G. O., Corwin H. G., Olowin R. P., 1989, ApJS, 70, 1
- [Alonso, Arribas, Martinez-Roger 1999] Alonso A., Arribas S., Martinez-Roger C. 1999, A&AS, 140, 261
- [Aragon-Salamanca et al. 1993] Aragon-Salamanca A., Ellis R. S., Couch W. J., Carter D., 1993, MNRAS, 262, 764
- [Arp & Madore 1987] Arp H. C., Madore B. F., “A catalogue of southern peculiar galaxies and associations”, 1987, Cambridge Univ. Press
- [Barnes et al. 2001] Barnes D. G. et al., 2001, MNRAS, 322, 486
- [Baugh et al. 1996] Baugh C. M., Cole S., Frenk C., 1996, MNRAS, 283, 1361
- [Bender 1990] Bender R., 1990, A&A, 229, 441
- [Benson, Ellis & Menanteau 2001] Benson A. J., Ellis R. S., Menanteau F., 2001, submitted to MNRAS (astro-ph/0110387)
- [Bernardi et al. 1998] Bernardi M., Renzini A., da Costa L. N., Wegner G., Alonso M. V., Pellegrini P. S., Rité C., Willmer C. N. A., 1998, ApJL, 508, L143
- [Blair & Gilmore 1982] Blair M., Gilmore G., 1982, PASP, 94, 742
- [Blakeslee, Vazdekis & Ajhar 2001] Blakeslee J. P., Vazdekis A., Ajhar E. A., 2001, MNRAS, 320, 193
- [Bower, Lucey & Ellis 1992] Bower R. G., Lucey J. R., Ellis R. S., 1992, MNRAS, 254, 601
- [Bower et al. 2001] Bower R. G., Benson A. J., Lacey C. G., Baugh C. M., Cole S. M., Frenk C. S, 2001, MNRAS, 325, 497
- [Colbert, Mulchaey & Zabludoff 2001] Colbert J. W., Mulchaey J. S., Zabludoff A. I., 2001, AJ, 121, 808
- [Cole et al. 2000] Cole S., Lacey C. G., Baugh C. M., Frenk C. S., 2000, MNRAS, 319, 168
- [Colless et al. 1999] Colless M., Burstein D., Davies R. L., McMahan R. K., Saglia R. P., Wegner G., 1999, MNRAS, 303, 813
- [da Costa et al. 2000] da Costa L. N., Bernardi M., Alonso M. V., Wegner G., Willmer C. N. A., Pellegrini P. S., Rité C., Maia M. A. G., 2000, AJ, 120, 95
- [Davies et al. 2001] Davies R. L., Kuntschner H., Emsellem E., Bacon R., Bureau M., Carollo C. Marcella, Copin Y., Miller B. W., Monnet G., Peletier R. F., Verolme E. K., de Zeeuw P. T., 2001, ApL, 548, L33
- [de Carvalho & Djorgovski 1992] de Carvalho R. R., Djorgovski S., 1992, ApJL, 389, L49
- [de Vaucouleurs et al. 1991] de Vaucouleurs G., de Vaucouleurs A., Corwin, H. G., Jr., Buta R. J., Paturel G., Fouqué, P., 1991, Third Reference Catalogue of Bright Galaxies, Springer Verlag, (RC3)
- [Diaferio et al. 2001] Diaferio A., Kauffmann G., Balogh M. L., White S. D. M., Schade D., Ellingson E., 2001, MNRAS, 323, 999
- [Djorgovski & Davis 1987] Djorgovski S., Davis M., 1987, ApJ, 313, 59
- [Dressler 1980] Dressler A., 1980, ApJ, 236, 351
- [Dressler et al. 1997] Dressler A., Oemler A., Couch W. J., Smail I., Ellis R. S., Barger A., Butcher H., Poggianti, B. M., Sharples R. M., 1997, ApJ, 490, 577
- [Edvardsson et al. 1993] Edvardsson B., Anderson J., Gustafsson B., Lambert D. L., Nissen P. E., Tomkin J., 1993, A&A, 275, 101
- [[Ellis et al. 1997] Ellis R. S., Smail I., Dressler A., Couch W. J., Oemler A. J., Butcher H., Sharples R. M., 1997, ApJ, 483, 582
- [Faber et al. 1989] Faber S. M., Wegner G., Burstein D., Davies R. L., Dressler A., Lynden-Bell D., Terlevich R. J., 1989, ApJS, 69, 763
- [Forbes 1991] Forbes D. A., 1991, MNRAS, 249, 779.
- [Freeman 1970] Freeman K. C., 1970, ApJ, 160, 811
- [Girardi et al. 2000] Girardi L., Bressan A., Bertelli G., Chiosi C., 2000, A&AS, 141, 371
- [Gómez et al. 2001] Gómez M., Richtler T., Infante L., Drenkhahn G., 2001, A&A, 371, 875
- [González 1993] González J. J., 1993, Ph.D. thesis, Univ. California, Santa Cruz
- [Goudfrooij et al. 2001] Goudfrooij P., Mack J., Kissler-Patig M., Meylan G., Minniti D., 2001, MNRAS, 322, 643
- [Governato et al. 1999] Governato F., Gardner J. P., Stadel J., Quinn T., Lake G., 1999, AJ, 117, 1651
- [Grogin & Geller 1999] Grogin N. A., Geller M. J., 1999, AJ, 118, 2561
- [Grogin & Geller 2000] Grogin N. A., Geller M. J., 2000, AJ, 119, 32
- [Halliday 1999] Halliday C., 1999, PhD thesis, Univ. Durham
- [Hashimoto & Oemler 1999] Hashimoto Y., Oemler A. J., 1999, ApJ, 510, 609
- [Hernquist & Quinn 1988] Hernquist L., Quinn P. J., 1988, ApJ, 331, 682
- [Hernquist & Quinn 1989] Hernquist L., Quinn P. J., 1989, ApJ, 342, 1
- [Jørgensen 1997] Jørgensen I., 1997, MNRAS, 288, 161
- [Jørgensen 1999] Jørgensen I., 1999, MNRAS, 306, 607
- [Jørgensen, Franx & Kjærgaard 1995] Jørgensen I., Franx M., Kjærgaard P., 1995, MNRAS, 276, 1341
- [Jones 1999] Jones L. A., 1999, PhD Thesis, Univ. North Carolina
- [Kaldare et al. 2001] Kaldare R., Colless M. M., Raychaudhury S., Peterson B. A., 2001, MNRAS, submitted (astro-ph/0109415).
- [Katgert et al. 1998] Katgert P., Mazure A., den Hartog R., Adami C., Biviano A., Perea J., 1998, A&AS, 129, 399
- [Kauffmann & Charlot 1998] Kauffmann G., Charlot S., 1998, MNRAS, 294, 705
- [Kauffmann, White & Guiderdoni 1993] Kauffmann G., White S. D. M., Guiderdoni B., 1993, MNRAS, 264, 201
- [Kennicutt 1992] Kennicutt R. C., 1992, ApJ, 388, 310
- [Kodama et al. 1998] Kodama T., Arimoto N., Barger A. J., Arag’on-Salamanca A., 1998, AA, 334, 99
- [Kuntschner 1998] Kuntschner H., 1998, PhD thesis, Univ. Durham
- [Kuntschner 2000] Kuntschner H., 2000, MNRAS, 315, 184
- [Kuntschner & Davies 1998] Kuntschner H., Davies R. L., 1998, MNRAS, 295, L29
- [Kuntschner et al. 2001] Kuntschner H., Lucey J. R., Smith R. J., Hudson M. J., Davies R. L., 2001, MNRAS, 323, 615
- [Larson, Tinsley & Caldwell 1980] Larson R. B., Tinsley B. M., Caldwell C. N., 1980, ApJ, 237, 692
- [Lauberts 1982] Lauberts A., 1982, The ESO/Uppsala Survey of the ESO(B) Atlas (Munich: Europe)
- [Longhetti et al. 2000] Longhetti M., Bressan A., Chiosi C., Rampazzo R., 2000, A&A, 353, 917
- [Mackie & Fabbiano 1998] Mackie G., Fabbiano G., 1998, AJ, 115, 514
- [McWilliam 1997] McWilliam A., 1997, ARA&A, 35, 503
- [Maraston & Thomas 2000] Maraston C., Thomas D., 2000, ApJ, 541, 126
- [Mehlert et al. 2000] Mehlert D., Saglia R. P., Bender R., Wegner G., 2000, A&AS, 141, 449
- [Menanteau et al. 1999] Menanteau F., Ellis R. S., Abraham R. G., Barger A. J., Cowie L. L., 1999, MNRAS, 309, 208
- [Menanteau, Abraham & Ellis 2001] Menanteau F., Abraham R. G., Ellis R. S., 2001, MNRAS, 322, 1
- [Mihos & Hernquist 1996] Mihos J. C., Hernquist L., 1996, ApJ, 464, 641
- [Nilson 1973] Nilson P., 1973, Uppsala General Catalogue of Galaxies, Uppsala Astron. Obs. Ann., 6 (UGC)
- [Oke 1990] Oke J.B., 1990, AJ, 99, 1621
- [Osterbrock 1989] Osterbrock D. E., 1989, Astrophysics of Gaseous Nebulae and Active Galactic Nuclei, (Mill Valley, CA: University Science Books)
- [Peletier 1989] Peletier R. F., 1989, PhD thesis, Univ. Groningen
- [Perlmutter et al. 1999] Perlmutter S. et al., 1999, ApJ, 517, 565
- [Raychaudhury 1989] Raychaudhury S., 1989, Nature, 342, 251
- [Raychaudhury 1990] Raychaudhury S., 1990, PhD thesis, Univ. Cambridge
- [Riess et al. 1998] Riess A. G. et al., 1998, AJ, 116, 1009
- [Rodgers 1988] Rodgers A. W, Conroy P., Bloxham G., 1988, PASP, 100, 626
- [Schade et al. 1999] Schade D. et al., 1999, ApJ, 525, 31
- [Schlegel, Finkbeiner, Davis 1998] Schlegel D. J., Finkbeiner D. P., Davis M., 1998, ApJ, 500, 525
- [Schweizer 1980] Schweizer F., 1980, ApJ, 237, 303
- [Schweizer 1981] Schweizer F., 1981, ApJ, 246, 722
- [Schweizer & Seitzer 1992] Schweizer F., Seitzer P., 1992, AJ, 104, 1039
- [Schweizer et al. 1990] Schweizer F., Seitzer P., Faber S. M., Burstein D., Dalle Ore C. M., González J. J., 1990, ApJL, 364, L33
- [Silva & Bothun 1998] Silva D. R., Bothun G. D., 1998, AJ, 116, 85
- [Terlevich, Caldwell & Bower 2001] Terlevich A. I., Caldwell N., Bower R. G., 2001, MNRAS, 326, 1547
- [Thomas 1999] Thomas D., 1999, MNRAS, 306, 655
- [Thomas & Kauffmann 1999] Thomas D., Kauffmann G., 1999, PASP Conference Proccedings series of the Workshop “Spectrophotometric dating of stars and galaxies”, Annapolis, Maryland (USA), eds. I. Hubeny, S. Heap, and R. Cornett, astro-ph/9906216
- [Tonry et al. 2001] Tonry J. L., Dressler A., Blakeslee J. P., Ajhar E. A., Fletcher A., Luppino G. A., Metzger M. R., Moore C. B., 2001, ApJ, 546, 681
- [Trager et al. 1998] Trager S. C., Worthey G., Faber S. M., Burstein D., González J. J., 1998, ApJS, 116, 1
- [Trager et al. 2000a] Trager S. C., Faber S. M., Worthey G., González J. J., 2000a, AJ, 119, 1645
- [Trager et al. 2000b] Trager S. C., Faber S. M., Worthey G., González J. J., 2000b, AJ, 120, 165
- [Tran et al. 2001] Tran K. H., Simard L., Zabludoff A. I., Mulchaey J. S., 2001, ApJ, 549, 172
- [Treu et al. 2001] Treu T., Stiavelli M., Bertin G., Casertano S., Møller P., 2001, MNRAS, 326, 237
- [van den Bosch & Emsellem 1998] van den Bosch F. C., Emsellem E., 1998, MNRAS, 298, 267
- [van Dokkum et al. 1998] van Dokkum P. G., Franx M., Kelson D. D., Illingworth G. D., 1998, ApJL, 504, L17
- [van Dokkum et al. 2001] van Dokkum P. G., Franx M., Kelson D. D., Illingworth G. D., 2001, ApJL, 553, L39
- [Vazdekis 1999] Vazdekis A., 1999, ApJ, 513, 224
- [Vazdekis et al. 1996] Vazdekis A., Casuso E., Peletier R. F., Beckman J. E., 1996, ApJS, 106, 307
- [Vazdekis, et al. 1997] Vazdekis A., Peletier R. F., Beckman J. E., Casuso E., 1997, ApJS, 111, 203
- [Vazdekis et al. 2001] Vazdekis A., Kuntschner H., Davies R. L., Arimoto N., Nakamura O., Peletier R., 2001, ApJL, 551, L127
- [Weiss, Peletier & Matteucci 1995] Weiss A., Peletier R. F., Matteucci F., 1995, A&A, 296, 73
- [Willmer et al.1991] Willmer C. N. A., Focardi P., Chan R., Pellegrini P. S., da Costa N. L., 1991, AJ, 101, 57
- [Worthey 1994] Worthey G., 1994, ApjS, 95, 107
- [Worthey 1998] Worthey G., 1998, PASP, 110, 888
- [Worthey, Faber & González 1992] Worthey G., Faber S. M., González J. J., 1992, ApJ, 398, 69
- [Worthey et al. 1994] Worthey G., Faber S., González J., Burstein D., 1994, ApJS, 94, 687
- [Worthey & Ottaviani 1997] Worthey G., Ottaviani D.L., 1997, ApJS, 111, 377
- [Ziegler & Bender 1997] Ziegler B. L., Bender R., 1997, MNRAS, 291, 527
- [Ziegler et al. 2001] Ziegler B. L., Bower R. G., Smail I., Davies R. L., Lee D., 2001, MNRAS, 325, 1571
Appendix A Aperture corrections for Fornax galaxies
In this section we describe briefly the aperture corrections applied to the Fornax cluster galaxies in order to match our nominal aperture of at 5 000 km s-1. This is equivalent to 1.08 kpc diameter (H km s-1 Mpc-1, q).
At the distance of Fornax (, Tonry et al 2001) the 1.08 kpc diameter is equivalent to 112. Extracting an equivalent aperture from our slit observations (23 slit width) yields prohibitively long extraction. In order to overcome this problem we extract an aperture of (equivalent to 55 diameter aperture) for all Fornax galaxies and correct the remaining aperture difference by using the line strengths gradients for individual galaxies (see Kuntschner 1998 for line-strengths gradients).
Here we first transformed the “atomic” indices measured in Å onto a magnitude scale like the “molecular” index Mg2. The conversion between an index measured in Å and magnitudes is
| (2) |
where is the width of the index bandpass (see e.g., WO97 and Trager et al. 1998 for a list of bandpass definitions). Following Jørgensen (1997) we then correct the indices for aperture effects in the following way:
| (3) |
where is the slope of the radial gradient index [mag] . For the Fornax cluster . After the correction the “atomic” indices are converted back to Å scale. This somewhat complicated procedure was performed because of two reasons: (i) the gradients for the Fornax galaxies where available only for indices on the magnitude scale, and (ii) indices such as which can show values close to zero, and indeed negative values, are not suitable for a multiplicative correction such as successfully used by Jørgensen (1997) for other atomic indices.
We emphasize that for each galaxy we have used the individually determined line-strength gradients in order to provide the aperture corrections. However, for the reader’s guidance and future reference we list in Table 8 the average gradients of elliptical galaxies in our sample for a set of key line-strength indices. The gradients are derived from data covering the range up to 1.5 effective radii.
| index | |
|---|---|
| G4300 | |
| Fe4383 | |
| C24668 | |
| Fe5015 | |
| Mg1 | |
| Mg2 | |
| Mg b | |
| Fe5270 | |
| Fe5335 | |
| Fe5406 | |
Note: The gradients are given for all indices measured in magnitudes (see Equation 2) and as a function of .
The gradients given here for Mg1 and Mg2 are similar to the one used by Jørgensen (1997, ) for both indices. The aperture corrections of the velocity dispersions were performed using the following formula:
| (4) |
where . This is the same correction strength as used by Jørgensen, Franx & Kjærgaard (1995).
Appendix B New stellar population models
In order to make age and metallicity estimates, we use the Vazdekis (1999) models, which utilize the empirical stellar library of Jones (1999) to predict line-strengths for a single-burst stellar population as a function of age and metallicity. These models have recently been updated (Vazdekis 2002, in preparation) incorporating the new isochrones of Girardi et al. (2000) and extensive empirical photometric libraries, such as Alonso et al. (1999). For some more detailed descriptions see also Blakeslee, Vazdekis & Ajhar (2001). The model predicts, among other parameters, spectral energy distributions (SEDs) in two regions in the optical wavelength range (3856-4476 Å and 4795-5465 Å) for simple stellar populations (SSPs), with a range of metallicities () and ages (1 to 17 Gyr). We use a Salpeter IMF (corresponding to the unimodal option with in the Vazdekis models). The spectral resolution of the models is 1.8 Å (FWHM). If model predictions of lower spectral resolutions are required, then the spectra can be simply broadened. For this paper we smoothed the spectra to the spectral resolution given by our data, i.e., 4.1 Å. Predictions for line-strength indices as a function of age and metallicity are easily obtained by measuring the indices directly on the predicted SEDs. Previous models (e.g., Worthey 1994; Vazdekis et al. 1996) used mostly the Lick polynomial fitting functions [Worthey et al. 1994, Worthey & Ottaviani 1997] to relate the strengths of selected absorption features to stellar atmospheric parameters. The fitting functions are based on the Lick/IDS stellar library (FWHM 9 Å, Worthey et al. 1994), this limits the application of the models to strong features.
The Lick stellar library has not been flux calibrated, so offsets had to be applied to data obtained with different spectrographs [Worthey & Ottaviani 1997]. The new Vazdekis models provide flux calibrated spectra, hence offsets should be small or zero.
The interpretation of our line-strength measurements for the field early-type galaxies depends sensitively on the model predictions and their accuracy. Since we are here using the predictions of the new Vazdekis models which will be described in a later paper (Vazdekis 2002, in preparation) we present in the following paragraphs a short comparison between the new models and the well established stellar population predictions by Worthey (1994). For the comparison we have chosen to use the vs [MgFe] diagram 666 , [González 1993], since it is one of the key diagrams in this paper.
Firstly, we compare the Worthey (1994) models with a version of the Vazdekis models [Vazdekis et al. 1996] which also uses the Lick/IDS fitting functions to predict index strength but has otherwise its own stellar population prescriptions (Figure 19a). Overall the models agree very well in this parameter space. The most important difference is seen in the strength of which shows a systematic offset (0.15 Å) towards smaller values at a given age in the Vazdekis models. This shift is most likely caused by differences in the isochrone temperatures (see Vazdekis et al. 1996). We also note that for ages larger than 8 Gyr and the lowest metallicity step () the models show systematically larger differences. This is caused by the uncertainties involved in the treatment of the horizontal branch. In summary the model predictions agree well when the Lick/IDS fitting functions are used to calculate the line-strength indices. Only small offsets in the absolute age/metallicity predictions for a given index strength are present.
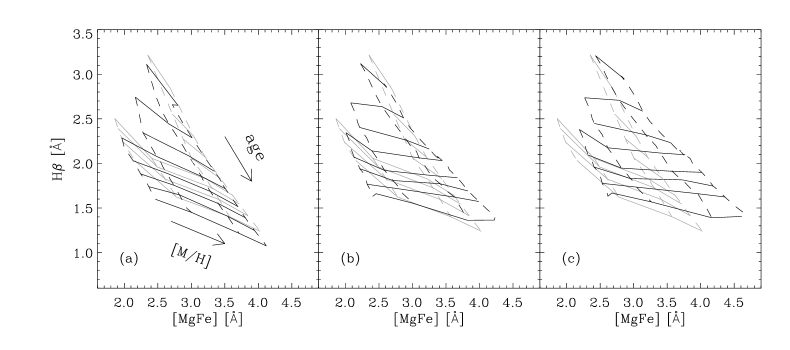
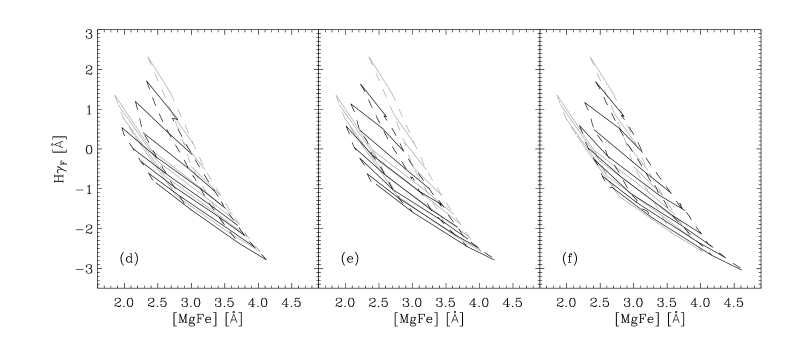
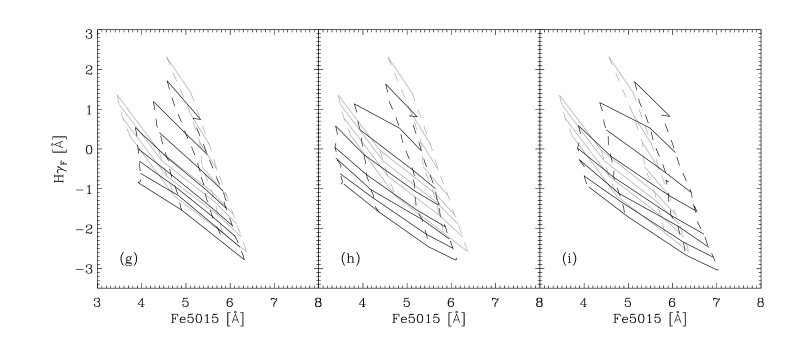
Secondly, we use the Vazdekis models to predict line-strength indices for a given age and metallicity in combination with the new spectral library by Jones (1999). In model terms this is a replacement of the Lick/IDS fitting functions. Other stellar population parameters are untouched. We emphasize, however, that we broadened the SEDs produced by the Vazdekis models to the Lick/IDS spectral resolution [Worthey & Ottaviani 1997] and measured the Lick/IDS indices directly on the spectra. The models are shown in Figure 19b. Overall the models occupy the same parameter space in the diagram and agree well on a general level. In detail, however, the new models show a better separation of age and metallicity effects in these coordinates than is indicated by the Worthey (1994) models using the Lick/IDS fitting functions. In other words, the lines of constant age (black solid lines) are almost horizontal. Furthermore, the new models predict for a given strength of [MgFe] lower metallicities compared to Worthey (1994). This effect increases towards greater ages and higher metallicities.
Although the differences in Figure 19b appear to be small we note that they can change the predicted ages and metallicities for a given line-strength significantly. For example, the predicted line-strength for solar metallicity and an age of 12.6 Gyr in the Vazdekis models corresponds to an age of 9 Gyr and in the Worthey (1994) models.
In the last diagram (Figure 19c) we show the new Vazdekis models, using the Jones (1999) spectral library, at a resolution of 4.1 Å (FWHM). Here, the overall shape of the models does not change very much compared to Figure 19b, but the whole model grid is shifted towards higher values of [MgFe]. This is mostly a reflection of the spectral resolution sensitivity of the Fe lines which contribute to the [MgFe] index. This last diagram demonstrates clearly the importance of using the right models when working at a higher spectral resolution.
In this paper we use two other important age-metallicity diagnostic diagrams which are presented in the following. Figures 19d-f and Figures 19g-i show the model comparisons for the vs [MgFe] and the vs Fe5015 diagrams, respectively. The differences between the models in the vs [MgFe] are very small and do not lead to significantly different conclusions about the luminosity-weighted ages and metallicities. In the vs Fe5015 diagram we find good agreement when the Lick/IDS fitting functions are used. However, when we use the Vazdekis models with the Jones (1999) library broadened to the Lick/IDS resolution, the predictions for the Fe5015 index differ significantly. At a given strength of Fe5015 the Vazdekis models predict higher metallicities compared to Worthey (1994). This effect slightly increases for larger ages.
In summary we conclude that the relative ordering of an age or metallicity sequence is mostly preserved whatever stellar population model is used. The absolute ages and metallicities vary substantially and remain insecure. The most significant differences in the line-strength predictions between the Worthey (1994) and Vazdekis (1999) models are caused by the change from the Lick/IDS fitting functions to the Jones (1999) library and/or by measuring the indices directly on the spectra rather than creating new fitting functions. The differences in the stellar evolution prescriptions seem to have only minor effects in the considered metallicity and age range.
We emphasise that the model predictions are based on the assumption of a single metallicity and single age stellar population. Real galaxy spectra most likely show a range in these parameters, due to stellar population gradients and projection effects (e.g., Maraston & Thomas 2000). Furthermore, none of the models treats the effects of non-solar abundance ratios which undoubtedly can influence the predictions for line-strength indices and therefore the resulting age and metallicity estimates. We are also measuring luminosity-weighted properties, which means that the presence of a young (i.e., bright) stellar component will disproportionally affect the mean age and therefore will be detected more easily.
Appendix C Comments on individual galaxies
Below we collate some miscellaneous notes on individual galaxies. Where available we list other names from the NGC catalogue [Nilson 1973], the ESO/Uppsala survey [Lauberts 1982] or the Arp & Madore (1987, hereafter AM87) catalogue of peculiar galaxies. Projected distances are calculated for H km s-1 Mpc-1 (q), assuming homogeneous Hubble flow.
LDR 08 – (ESO 503-G005, AM 1112-272): Listed in AM87 under code 15 (Galaxies with tails, loops of material or debris) with comment “E + faint irregular ring”. Our imaging shows that the galaxy presents an elliptical-like core, but has two prominent irregularities: an outer system of tidal tails (extending to 60″, 16 kpc radius) and a slightly elliptical inner ‘ring’, at a radius of 5″(1.2 kpc). The brightest part of the tidal tail is conspicuously blue, and has a knotty structure, suggesting ongoing accretion of a gas-rich, star-forming companion. This galaxy is detected in H I by the ‘The H I Parkes All-Sky Survey’ (HIPASS, Barnes et al. 2001).
LDR 09 – (NGC 3617, ESO 503-G012, AM 1115-255): Listed in AM87 under code 23 (Close pairs, not visibly interacting) with comment “Close pair (#2: LSB spiral)”. LDR 09 has boxy outer isophotes. The companion (ESO 503-G011) is located at a distance of (48 kpc projected distance), the redshift is km s-1, , morphology: Sa-b. Our imaging shows a faint companion closer in (at 90″= 13 kpc), this object is clearly interacting with the galaxy, producing a narrow linear tidal feature, easily traced over 3.5 kpc. The satellite itself is of unusual appearance, apparently having three distinct nuclei.
LDR 14 – (ESO 379-G026, AM 1203-354): Listed in AM87 under code 23, (Close pairs, not visibly interacting) with comment “Close pair (E + spiral)”. The companion, a spiral galaxy, is located at a distance of (21 kpc projected distance; J2000 , ). The redshift is unknown, . No clear signs of interaction.
LDR 19 – (ESO 442-G006) S0 with no significant peculiarities. There is a late-type spiral companion to the west. There are two faint galaxies embedded in the outer isophotes, of which one shows signs of tidal interaction.
LDR 20 – (ESO 381-G004) Our images show that this galaxy is clearly undergoing interaction with a companion, which may have passed through the centre of the galaxy. The companion, an elongated arc-like structure (J2000 , ), at a distance of (22 kpc projected distance) is of similar colour to the dominant galaxy. Several broad streams of tidal debris are visible. The galaxy shows symmetric secondary intensity maxima along the major axis (see also LDR 29).
LDR 22 – (ESO 382-G016, AM 1310-362): Listed in AM87 under code 8 (Galaxies with apparent companion(s)) & 14 (Galaxies with prominent or unusual dust absorption) with comment “E with peculiar linear companion + dust”. The S0 companion (ESO 382-G017) is located just outside our images, at a distance of (38 kpc projected distance), and has km s-1, . In contrast to the AM87 study we do not find evidence for significant dust in this galaxy.
LDR 29 – (ESO 445-G056) Possible cluster member, but very large relative velocity. The galaxy is highly elongated, with ellipticity 0.6–0.7 in the outer regions. The isophote shapes are disky, in part due to two symmetric intensity peaks similar to those seen in LDR 20, which could be interpreted as Lindblad or ultraharmonic resonances (see e.g., van den Bosch & Emsellem 1998), or as the inner cut-off points of a ‘Freeman type II’ disk [Freeman 1970]. There are no signs of ongoing interaction.
LDR 33 – (AM 1402-285): Listed in AM87 under code 2 (Interacting doubles (galaxies of comparable size)) with comment “Interacting double”. The companion (J2000; , ) is located at a distance of (27 kpc projected distance). The redshift and magnitude are unknown. LDR 33 appears slightly asymmetric, and seems to have broad tidal streams similar to (but much weaker than) those in LDR 20. The companion (spiral?), with a dust-lane, shows evidence of tidal stripping.
LDR 34 – (ESO 446-G049) The galaxy has a narrow blue ring (radius 10″, 2.5 kpc) like that seen in LDR 08 and a peculiar outer disk/halo. No close, bright companions.