The missing M dwarfs.
Abstract
We present evidence which indicates the luminosity functions of star forming regions, open star clusters and the field dips between spectral types M7-M8. We attribute this to a sharp local drop in the luminosity-mass relation and speculate that this is caused by the beginning of dust formation in the atmospheres of objects in this effective temperature regime. This effect is not predicted by the current generation of low mass stellar/substellar evolutionary models. If our interpretation is correct then this result has important implications for investigations concerned with the mass functions of star forming regions and young open star clusters. For example, it suggests that some brown dwarfs have higher masses than previously thought.
keywords:
stars: late-type, low-mass, brown dwarfs, atmospheres – infrared: stars.1 Introduction
Over the last few years deep far-red optical and infrared surveys of young open clusters and star forming regions have revealed large populations of brown dwarfs (e.g Bouvier et al. 1998, Pinfield et al. 2000, Magazzu et al. 1998, Luhman et al. 1999, 2000, Lodieu et al. 2002). Indeed, several of the most recent investigations may have unearthed significant numbers of free-floating objects with masses less than the deuterium burning limit (MM⊙; e.g Orionis, Zapatero-Osorio et al. 2000, Orionis, Lucas & Roche 2000, Muench et al. 2002), some possibly having masses as low as MM⊙ (Lucas & Roche 2001). The form of the initial mass function (IMF; dN/dm) in star forming regions, young open clusters and in the field, across and below the stellar/substellar boundary and down to at least 0.03M⊙, is found to be well matched by a slowly rising powerlaw model with an index in the range (e.g Bouvier et al. 1998, Luhman et al. 1999, Hambly et al. 1999, Reid et al. 1999, Bejar et al. 2001, Dobbie et al. 2002).
However, there is now some evidence to suggest that below MM⊙ the IMF departs from this simple description. Two independent studies of the Orionis star forming region appear to show a significant secondary peak in the IMF close to the deuterium burning limit (Muench et al. 2002, Lucus & Roche 2000). The IMF of Orionis may also rise steeply at these masses (Bejar et al. 2001). We note that standard star formation theories (e.g Boss 1998, Low & Lynden-Bell 1976) predict that the minimum mass of gas which is unstable against collapse to stellar densities is of the order 0.01M⊙ (e.g Silk 1977). Muench et al. (2002) have suggested that another formation mechanism may contribute to the IMF at these very low masses to produce the observed secondary peak.
Of course, derivations of the IMF are dependent on the robustness of the conversion from the observational to the theoretical plane. Studies focusing on the very youngest star clusters and star forming regions are undoubtedly complicated by residual dust and gas along the lines of sight and the presence of T-Tau disks (e.g Lucas & Roche 2000). There are also uncertainties in the theoretical models, particularly at these youngest ages. For example, at ages of less than a few Myrs, predicted Teffs and luminosities are found to be highly sensitive to the choice of initial conditions and the adopted treatment of convection (e.g Baraffe et al. 2002). Furthermore, there is now little doubt that the spectral energy distributions of the coolest stellar and substellar objects are strongly influenced by the presence of dust grains in their atmospheres (e.g Tsuji et al. 1996, Jones & Tsuji 1997, Chabrier et al. 2000, Marley et al. 2002). While the observed trends in colours of the late-M dwarfs through the L dwarfs to the T dwarfs can now be qualitatively reproduced by the latest model atmospheres which incorporate a treatment for both the condensation and sedimentation of species such as Al2O3, MgSiO3 and Fe (e.g Tsuji et al. 2001), the theory of dust grain formation and gravitational settling in stellar photospheres is still very much in its infancy. The effects of these processes on the evolution of substellar objects have not yet been investigated in a fully self-consistent manner.
In the next section of this work we present evidence for a dip in the luminosity function (LF) between spectral types M7-M8. In Section 3 we attribute this to a sharp local change in the form of the luminosity-mass relation. We construct semi-empirical magnitude-mass relations for the Pleiades and Orionis clusters using the available observational data. In Section 4 we speculate that the change is due to the onset of dust formation in the atmospheres of cool stellar and substellar objects and discuss the implications of our result for current investigations concerned with determining the form of the IMF of star forming regions and young open clusters. It should be noted that throughout this work, we refer to as .
2 Evidence for the missing M dwarfs
2.1 The Pleiades
In our recent work concerned with placing stringent constraints on the core radius of the substellar members of the Pleiades and on the shape of the cluster mass function across and below the stellar/substellar boundary we have compiled a large, complete, magnitude limited sample of candidate brown dwarfs (Jameson et al. 2002). As part of this effort we have constructed an colour-magnitude diagram (CMD) using 48 candidate substellar Pleiads which has revealed an apparent sparsity of cluster members with colours (or from a comparison with the colours of field dwarfs). Using data from Pinfield et al. (2002, in prep) and Tables 2 and 3 of Jameson et al. (2002) we replot the relevant section of the CMD in Figure 1 where candidate single and unresolved binary low mass members are shown as filled and open circles respectively. The location of the 125Myr NEXTGEN isochrone (Baraffe et al. 1998) for solar metalicity and the corresponding equal mass binary track, after correcting for extinction, reddening and a distance of A, E() and (m-M) (Crawford & Perry 1976) respectively are also shown (dashed and dotted lines respectively; see arguments in Dobbie et al. 2002 for our choice of cluster distance). It can be seen that the region of the cluster sequence which we find to be sparsely populated (highlighted by the gray shading) spans magnitudes at . Available infrared data (Jameson et al. 2002; Pinfield et al. 2002, in prep.) reveal it to extend over magnitudes at , and respectively, suggesting it spans magnitudes in bolometric luminosity.
The band LF over the interval for the 7.6 sq. degrees of the Pleiades included in the Jameson et al. (2002) study is shown in Figure 2. Note that those candidates lying close to the binary sequence have been excluded from this determination (see later). Excluding the magnitude bin which has an obvious deficit of members, we have modelled log N versus with a powerlaw (see Muench et al. 2002 for justification), represented in Figure 2 by the dashed line. A test indicates that the observed LF, including the bin with the deficit of members, is inconsistent with this model at a level of confidence % (for the adopted bin width of 0.45 magnitudes). We note that the colour, , at the midpoint of the LF dip corresponds to a spectral type of M7-M8 (Leggett 1992) and an TK (NEXTGEN model).

2.2 and Orionis
Both the Orionis star cluster and the Orionis (Trapezium) star forming region, which lie at pc (e.g Blaauw 1991, Warren & Hesser 1978), are considerably younger than the Pleiades with estimated ages of 1.7-7 Myrs and 0.3-2 Myrs respectively (e.g Ali & Depoy 1995, Hillenbrand 1997, Brown, de Geus & de Zeeuw 1994, Warren & Hesser 1978). Bejar et al. (2001) present the results of a 847 square arcmin band survey of the Orionis region, which is complete to and has unearthed 64 candidate members. Their Figure 1, the CMD for the candidates, shows a sparsity of objects with , virtually coincident in colour with the LF dip observed in the sequence of the Pleiades. Lucas & Roche (2000) present the results of an , and band survey of Orionis complete to , in which 515 sources were detected in a 33 sq. arcminute region. The vast majority of these are believed to be members of the Trapezium. A , colour-colour plot of these sources, constructed using dereddened photometry, also reveals a sparsity of objects in the range (see their Figure 3). Their band LF for the Trapezium region is falling into the substellar regime but appears to rise again towards a secondary peak at M (, ). The band LF derived from an independent near-IR survey of the region similarly displays such a fall in the substellar regime, before apparently rising towards a secondary peak at . Muench et al. (2002), who argue that the theoretical luminosity-mass relation is reasonably robust in the substellar regime, interprete this apparent secondary peak as a rise in the IMF near the deuterium burning limit.


2.3 Other clusters and the field
Further evidence for drops in LFs in this Teff regime can be found elsewhere. For example, Barrado y Navascués et al. (2001) present the results of a VRIZ survey, complete to , of the 53Myr old open cluster IC2391. In a 2.5 square degree area, they identify 132 probable and possible cluster members, although as follow-up data are available for only a limited number of these % are likely to be non-members. From their Figure 3, the CMD, it can be seen that the number of candidates drops dramatically just above the completeness limit of their survey, before increasing once again at . The 50Myr NEXTGEN model of Barraffe et al. (1998) indicates that at the cluster distance of 155 pc (Barrado y Navascués et al. 2001) a member of magnitude has TK. This is consistent with the theoretical Teff of the top edge of the sparsely populated region in the Pleiades sequence. The band LF of the 90Myr old -Per cluster similarly shows a dip centered around M (Barrado y Navascués, private comm.; Stauffer et al. 1999), while Figure 9 of Luhman (1999), a luminosity-Teff plot, hints at a sparsity of objects between spectral types M7-M8 in IC348. Reid & Cruz (2002) have derived colour-absolute magnitude diagrams for a sample of field dwarfs lying within 20pc of the Sun. Examination of their Figure 11, the MI, plot, also reveals a sparsity of objects in the range . It is clear that with the small number of late-M type stellar/substellar objects in each of these studies, and in the IC2391 work the potential level of contamination and the location of completeness limit of the data with respect to our claimed dip, individually these results are of low statistical significance. Nevertheless, when all the available evidence is taken together we believe the case for a drop in the bolometric LF between M7-M8 is compelling.
3 Masses across and below the gap
We have argued above for the existence of a dip in the bolometric LF of star forming regions, young clusters and the field near TK. These populations span a wide range of ages, hence the dip covers a large range of masses, arguing against it being related to fine structure in the IMFs. Instead, the obvious way to explain this is a sharp fall in the luminosity-mass relation between spectral types M7-M8. The LF can be written as in Equation 1, where is the MF and is the slope of the luminosity-mass relation where M is the bolometric magnitude and m the mass.
| (1) |
Logically, if increases, the LF will drop. Indeed, we believe that what has recently been interpreted as structure in the Trapezium IMF (Meunch et al. 2002) in fact arises from the feature in the luminosity-mass relation reported here. An qualitative estimate of the form of the band magnitude-mass relation for the Pleiades can be derived from the observations. For example, we start with the magnitude-mass relation from the 125Myr NEXTGEN model of Baraffe et al. (1998) and assume this holds true as far as the top of the gap in the sequence. We could equally use the models of Burrows et al. (1997) or D’Antona & Mazzitelli (1997), but for reasons outlined in our previous work (e.g Jameson et al. 2002) we prefer the calculation of the Lyon group. Equation 2 can be readily derived by integrating the MF from a mass m1 to a lower mass m2 and again from m2 to an even lower mass m3, where is the index of a powerlaw model MF and N12,N23 the number of brown dwarfs in the mass intervals m1 to m2 and m2 to m3 respectively.
| (2) |
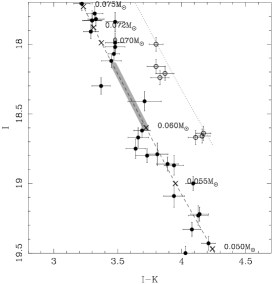
The ratio N23/N12 is determined from observation and m1 and m2 are taken from the NEXTGEN model just above the dip. Assuming a MF for the Pleiades, dN/dm m-α, , as recently derived by Jameson et al. (2002) over a broad mass range (0.3MmM⊙), Equation 2 can be solved for m3. Thus masses can be estimated down through the dip region and below as a function of , and hence the magnitude-mass relation derived. We find our estimates to be relatively insensitive to the assumed index unless mm2. The result for the Pleiades, using only those candidate members with photometry consistent with them being single objects, is shown in Figure 3 (open circles). Since the component masses of the unresolved binary candidates are not known, a robust treatment of these is difficult. However, if we assume all of these to be equal mass binaries and the binary fraction above the gap, where the data are incomplete, to be the same as below, then the magnitude-mass relation is found to be nearly identical to that obtained by considering only the single brown dwarfs, as above. We choose not to proceed beyond as the survey is complete over only a small area of sky at fainter magnitudes and the statistics are poor. The overall result, as illustrated in Figure 3 by the dotted line, is that beyond the beginning of the gap any brown dwarf mass may be greater than predicted by either the NEXTGEN or the DUSTY models.
This procedure has been repeated for the Orionis cluster, using the band LF data reported in Bejar et al. (2001). Following our argument above and since the single and binary sequences are not well resolved in the Bejar et al. work, we have ignored the influence of unresolved binarity, treating all their candidate members as single. As the models of Burrows et al. (1997) are widely used to predict the magnitudes of planetary mass objects we opt here to use, in turn, both the 5Myr NEXTGEN model and the 5Myr evolutionary track of the Arizona group as the starting points for this calculation. The latter model has been transformed onto the observational plane using the bolometric corrections and Teff-colour relation of the former. As shown in Figure 4 we have derived the magnitude-mass relation down to , although due to the completeness limit of the survey, the point below provides only an upper limit on mass. Except at the lowest masses where the models and our semi-empirical estimates appear to be reasonably consistent, we find once again that beyond the beginning of the gap the mass of any brown dwarf may be greater than predicted by the theoretical calculations.
4 Discussion
Careful scrutiny of the evidence cited above suggests that the width of the LF dip is greater in the younger and Orionis clusters than in either the Pleiades or the field populations. This is consistent with our interpretation in which the luminosity-mass relation undergoes a sharp change in form between spectral types M7-M8. For a population older than 100Myrs, radius is virtually independent of mass right across the planetary/brown dwarf mass regime. However, in a population with an age of only a few Myrs, radius decreases rapidly with mass. Therefore, as one moves to lower masses and Teffs, luminosity decreases more rapidly in younger populations, and one should find a wider dip in the LF, representative of the dip spanning a constant range in Teff. From Figure 11 in Burrows et al. (1997) we estimate that the dip in the LF should be wider (in magnitudes) in a 5 Myr population than in a 125Myr population, in agreement with the observations.
We now speculate on the possible cause of a sharp local change in the form of the luminosity-mass relation in this Teff regime. We note that a dip in the LF observed in the sequences of both open clusters and the field at M (the Wielen gap; e.g Wielen, Jahreiss & Kruger 1983; Belikov at al. 1998), has been attributed to a local steepening of the luminosity-mass relation due to strong H- opacity in the atmospheres of objects in this Teff regime (Kroupa, Tout & Gilmore 1990). Theoretical cool model atmospheres predict that dust grains of Al2O3, Fe and MgSiO4 begin to condense in the outermost layers of a brown dwarf (or very low mass star) at TK, corresponding to a Teff consistent with the M7-M8 LF dip (e.g Allard et al. 2001, Tsuji 2001). Indeed, spectroscopic observations of late-M field dwarfs lend support to these predictions (Jones & Tsuji 1997). However, the DUSTY evolutionary models of Chabrier et al. (2000) which include a treatment for the formation of dust, do not predict any discontinuity in the luminosity-mass relation here. In the synthetic atmospheres of Allard et al., which provide the outer boundary conditions for the DUSTY calculations, dust is treated as grains with sizes in the range m. In this case, dust does not contribute significantly to the opacities in the near-infrared where the water bands are dominant (Allard et al. 2001). However, as illustrated by Figure 4 of Allard et al. if the grain size is increased into the regime described by Mie scattering theory, the opacity provided by dust is dramatically enhanced (we note that the opacity of dust increases with decreasing wavelength). While current observations argue against grains as large as m, the most detailed current cloud formation models predict sizes in the range m (Cooper et al. 2002). It might well be possible to reproduce the observed dips in the LFs with a moderate increase in the model grain size.
With the recent advent of wide-field near-infrared imagers (e.g FLAMINGOS) and the ever increasing availability of wide-field optical imagers (e.g WFI) the results of deeper, larger area surveys for low mass members of rich young clusters such as NGC2547, NGC2516 and IC2391 should soon become available. The improved statistics of these surveys will confirm or otherwise the reported dip in the LF between M7-M8 and allow a more thorough examination of its implications for mass determinations at TK.
5 Summary
1. We have presented evidence for a deficit of very-low mass stars/brown dwarfs between spectral types M7-M8 and have argued that this arises from a sharp local change in the shape of the luminosity-mass relation.
2. Structure near the bottom end of the Trapezium IMF recently proposed by Muench et al. (2002) is more likely a manifestation of the feature in the luminosity-mass relation reported here.
3. We find that brown dwarfs with spectral types later than M7-M8 may have masses greater than predicted by current theoretical models.
4. We speculate that the onset of dust formation in the upper atmosphere of objects in this Teff regime is responsible for the change in the shape of the luminosity-mass relation. This might be modelled by assuming larger grain sizes than are currently used in the DUSTY calculations.
Acknowledgments
PDD, DJP and STH acknowledge the financial support of PPARC. We thank Gilles Chabrier and Isabelle Baraffe for useful discussions on their evolutionary models, David Barrado y Navascu s for making his latest results available to us and the referee, Nigel Hambly, for a swift and useful response.
References
- [2001] Allard, F., Hauschildt, P.H., Alexander, D.R., Tamanai, A., Schweitzer, A., 2001, ApJ, 556, 357
- [1995] Ali, B., Depoy, D.L., AJ, 109, 709
- [1998] Baraffe, I., Chabrier, G., Allard, F., Hauschildt, P.H., 1998, A&A, 337, 403
- [2002] Baraffe, I., Chabrier, G., Allard, F., Hauschildt, P.H., 2002, A&A, 382, 563
- [2001] Barrado y Navascués, D., Stauffer, J.R., Briceno, C., Patten, B., Hambly, N.C., Adams, J.D., 2001, ApJS, 134, 103
- [1] Bejar, V.J.S., et al., 2001, ApJ, 556, 830
- [2] Belikov, A.N., Hirte, S., Meusinger, H., Piskunov, A.E., Schilbach, E., 1998, A&A, 332, 575
- [3] Blaauw, A., 1991, in Physics of Star Formation and Early Stellar Evolution, eds. C.J. Lada and N.D. Kylafis, NATO ASI Ser. C, 342, Kluwer, Dordrecht
- [4] Boss, A.P., 1998, ApJL, 501, 77
- [5] Bouvier, J., Stauffer, J.R., Martín, E.L., Barrado y Navascues, D., Wallace, B. and Bejar, V.J.S., 1998. A & A, 336, 490.
- [6] Brown, A.G., de Geus, E.J., de Zeeuw, P.T., 1994, A&A, 289, 101
- [1997] Burrows, A., et al., 1997, ApJ, 491, 856
- [2000] Chabrier, G., Baraffe, I., Allard, F., Hauschildt, P., 2000, ApJ, 542, 462
- [2002] Cooper, C.S., Sudarsky, D., Milsom, J.A., Lunine, J.L., Burrows, A., 2002, astro-ph/0205192
- [1976] Crawford, D.L., Perry, C.L., 1976, AJ, 81, 419
- [1997] D’Antona, F., Mazzitelli, I., 1997, Memorie della Societa Astronomia Italiana, 68, 807
- [2002] Dobbie, P.D., Kenyon, F., Jameson, R.F., Hodgkin, S.T., Pinfield, D.J., Osborne, S.L., 2002, MNRAS, in press
- [7] Hambly, N.C., Hodgkin, S.T., Cossburn, M.R. and Jameson, R.F., 1999. MNRAS, 303, 385.
- [8] Hillenbrand, L.A., 1997, AJ, 113, 1733
- [2002] Jameson, R.F., Dobbie, P.D., Hodgkin, S.T., Pinfield, D.J., 2002, MNRAS, in press
- [1996] Jones, H.R.A., Tsuji, T., 1997, ApJL, 480, 39
- [1990] Kroupa, P., Tout, C.A., Gilmore, G., 1990, MNRAS, 244, 76
- [1992] Leggett, S.K., 1992, ApJS, 82, 351
- [2002] Lodieu, N., Caux, E., Monin, J.-L., Klotz, A., 2002, A&A, L15
- [1976] Low, C., Lynden-Bell, D., 1976, MNRAS, 176, 367
- [2000] Lucas, P.W., Roche, P.F., 2000, MNRAS, 314, 858
- [2001] Lucas, P.W., Roche, P.F., Allard, F., Hauschildt, P.H., 2001, MNRAS, 326, 695
- [1999] Luhman, K.L., Rieke, G.H., 1999, ApJ, 525, 440
- [2000] Luhman, K.L., Rieke, G.H., Young, E.T., Cotera, A.S., Chen, H., Rieke, M.J., Schneider, G., Thompson, R.I., 2000, ApJ, 540, 1016
- [1998] Magazzu, A., Rebolo, R., Zapatero Osorio, M.R., Martín, E.L., Hodgkin, S.T., 1998, ApJL, 497, 47
- [2002] Marley, M.S., Seager, S., Saumon, D., Lodders, K., Ackerman, A.S., Freedman, R.S., Fan, X., 2002, ApJ, 568, 335
- [2002] Muench, A.A., Lada, E., Lada, C., Alves, J., 2002, ApJ, 573, 366
- [9] Pinfield, D.J., Hodgkin, S.T., Jameson, R.F. Cossburn, M.R., Hambly, N.C. and Devereux, N., 2000. MNRAS, 313, 347.
- [10] Reid, I.N., et al., 1999, ApJ, 521, 613
- [11] Reid, I.N., Cruz, K., 2002, AJ, 123, 2806
- [12] Silk, J., 1977, ApJ, 214, 152
- [13] Stauffer, J.R., et al., 1999, ApJ, 527, 219 103
- [14] Tsuji, T., Ohnaka, K., Aoki, W., Nakajima, T., 1996, A & A, 308, L29
- [15] Tsuji, T., 2001, in Ultracool Dwarfs: new spectral types L and T, eds. H.R.A. Jones and I.A. Steele, Springer-Verlag, Berlin Heidelberg
- [16] Warren, W.H., Hesser, J.E., 1978, ApJ, 36, 497
- [17] Wielen, R., Jahreiss, H., Kruger, R., 1983, In: The Nearby Stars and the Stellar Luminosity Function, Proc. IAU Colloq. 76, Middletown, CT, USA; A.G. Davis Philip, A.R. Upgren (eds.), L. Davis Press, Schenectady, N.Y., p. 163-170
- [2000] Zapatero-Osorio, M.R., Béjar, V.J.S., Martín, E.L., Rebolo, R., Barrado y Navascués, D., Bailer -Jones, C.A.L., Mundt, R., 2000, Science, 290, 103