Exploring Brown Dwarf Disks in Oph ††thanks: Partly based on observations collected at the Italian Telescopio Nazionale Galileo (TNG) operated on the island of La Palma by the Centro Galileo Galilei of INAF (Istituto Nazionale di Astrofisica) at the Spanish Observatorio del Roque de los Muchachos of the Instituto de Astrofisica de Canarias, and at the European Southern Observatory, La Silla and Paranal, Chile.
Abstract
This paper discusses evidence for and properties of disks associated to brown dwarfs in the star-forming region Oph. We selected nine objects from the ISOCAM survey of Bontemps et al. Bonea01 (2001) that have detections in the two mid-infrared bands (6.7 and 14.3 m), relatively low extinction and low luminosity. We present low-resolution near-infrared spectra in the J, H and K bands, and determine for each source spectral type, extinction, effective temperature and luminosity by comparing the spectra to those of field dwarfs and to the most recent model stellar atmospheres. The results indicate that eight objects have spectral types M6–M7.5, effective temperature of 2600–2700 K, one has a later spectral type (M8.5) and lower temperature (about 2400 K). The derived extinctions range between AV2 and 8 mag. The location of the objects on the HR diagram, in spite of the uncertainties of the evolutionary tracks for young objects of substellar mass, indicates that all the objects are very young and have masses below about 0.08 M⊙. The coolest object in our sample has mass in the range 8-12 MJ (0.008–0.012 M⊙). In all cases, the mid-infrared excess is consistent with the predictions of models of disks irradiated by the central object, showing that circumstellar disks are commonly associated to young brown dwarfs and planetary-mass objects. Finally, we discuss possible variations of the disk geometry among different objects, as well as the possibility of using these data to discriminate between various formation scenarios.
Key Words.:
Circumstellar matter – Stars: formation – Stars: atmospheres – stars: low-mass, brown dwarfs1 Introduction
A large number of objects with sub-stellar mass are now known, with masses ranging from the hydrogen burning limit that divides stars from brown dwarfs (BDs; M⋆ M⊙) to values comparable to the mass of giant planets and below the deuterium burning limit ( 0.013 M⊙). Their discovery in regions of star formation has provoked an intense debate on the formation mechanism of such objects. Do they form, as solar mass stars do, from the collapse of a molecular core (Shu et al. Shu87 (1987))? Are they stellar embryos, whose further growth is prevented by dynamical ejections from small stellar systems (Reipurth & Clarke RC01 (2001); Bate et al. Bate02 (2002))? Or are they “planets”, i.e., objects that form in gravitationally unstable regions of circumstellar disks (Papaloizou & Terquem PT01 (2001); Lin et al. Linea98 (1998))? Is there a single formation process for all substellar objects? What is the lowest mass for the gravitational collapse mechanism?
A crucial contribution to this debate is expected from studies of the circumstellar disks (if any) associated with sub-stellar objects, since different theories make very different predictions. Disks are a necessary step in any formation mechanism that involves accretion from a parental core. If BDs form from core collapse, they should be associated to disks similar in properties to those found around low mass pre-main–sequence stars (T Tauri stars; TTS). A prediction of the stellar embryo theory is that the disks should be truncated by the ejection mechanism, so that they should be small and short-lived. In the “planetary” hypothesis, any circumstellar disk should be even less substantial.
In some young BDs, emission in excess of that due to the photosphere has been detected in the near (Oasa et al. OTS99 (1999); Muench et al. MLAL01 (2001); Wilking et al. WGM99 (1999)) and mid-infrared (Persi et al. Pea00 (2000); Comerón et al. Comea98 (1998), CNK00 (2000); Bontemps et al. Bonea01 (2001)), and has been interpreted, by analogy with TTS, as evidence for circumstellar disks. In an earlier study (Natta & Testi NT01 (2001); Paper I), we discussed the properties of three objects in Chamaeleon I for which we could find in the literature ground-based spectroscopy and photometry as well as ISOCAM measurements at 6.7 and 14.3 m (Comerón et al. CNK00 (2000); Persi et al. Pea00 (2000)). One of these objects is a bona-fide BD, while the two others are close to the threshold between stars and BDs. We found that the excess emission was clearly detectable only in the mid-infrared, because the stellar photosphere overwhelms the disk emission in the three near-infrared bands. The observed SEDs are well described by disk models similar to those of TTS, assuming that the heating is due to irradiation from the central star.
This first result provides strong support for the idea that BDs form like stars, from the contraction of a molecular core. Hence, we decided to extend our study of disk properties to a larger number of substellar mass objects in regions of star formation, possibly down to objects of few Jupiter masses. With this in mind, we selected a small but well defined sample of nine objects in the Oph region, that were detected by ISOCAM at both 6.7 and 14.3 m (Bontemps et al. Bonea01 (2001)). We obtained near-infrared spectra for all of them (see §2), which we used to derive the basic parameters of the central objects, namely effective temperature, luminosity and mass (§3). Because of the adopted selection criteria, all of these objects have excess emission in the mid-IR. We model the expected disk emission for each object and show the results in §4. We discuss the implications of our findings in §5 and present conclusions in §6.
2 Observations and data reduction
2.1 Selection criteria
We chose nine BD candidates from the sample of Class II objects detected at both 6.7 and 14.3 m by Bontemps et al. (Bonea01 (2001)). We selected all objects with visual extinction less than 8.5 mag and luminosity less than 0.04 L⊙ according to Bontemps et al. (Bonea01 (2001)). The first criterion ensures the possibility of obtaining high signal to noise specta across the entire near infrared range. The low luminosity was required to increase the chance of selecting objects in the range of masses we are interested in.
The location of the selected objects in the ISOCAM color-magnitude diagram is shown in Figure 1 (filled circles).
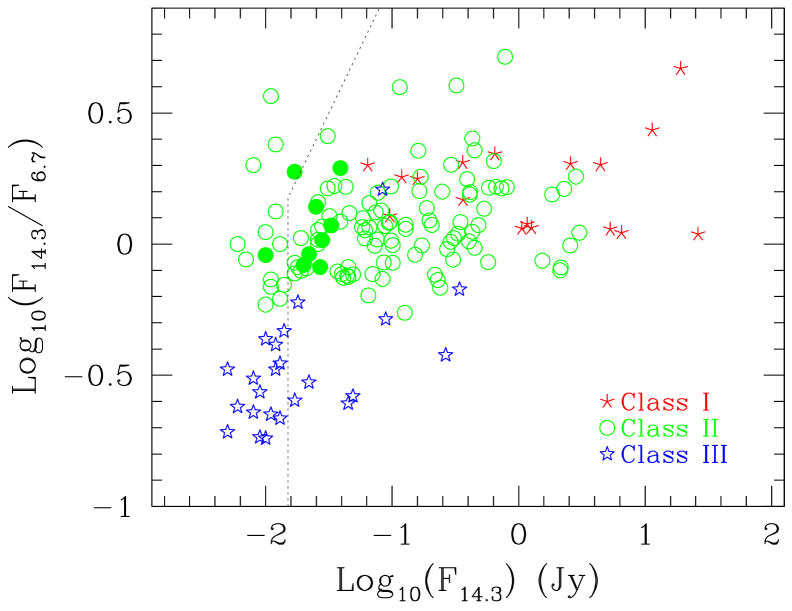
We note that all the objects are close to or below the completeness limit of the ISOCAM survey, as expected for such low luminosities. In colors, our sample span the whole range covered by the Class II objects (essentially classical TTS).
Some of the selected sources were known from previous studies to be very low-mass objects. In Table 1 we give the ISO source number, the J2000 coordinates, other designations and references to previous studies. Finding charts are provided in Appendix A. We will comment on the comparison between the literature source parameters and those derived in this paper in Section 5.1. The results on one of the sources in our sample (#033) have been already presented in Testi et al. (2002a , hereafter Paper II); they have been re-analyzed and reported again here for an easier comparison with the rest of the sample.
2.2 Near-infrared spectroscopy
Near-infrared spectra for the objects in our sample were acquired in the period July 4–9, 2001 at the Telescopio Nazionale Galileo (TNG), using the multi-mode Near-Infrared Camera Spectrograph (NICS; Baffa et al. Bea01 (2001)). The Amici device (Oliva O00 (2000)), a prism based, high-throughput optical element unique to NICS, was used as disperser, coupled with a 0.5″ wide, 4.2′ long slit; the resulting effective resolution is approximately 100, approximately constant across the entire spectral range (0.85–2.45 m). An identical instrumental configuration was used for the observations of field dwarfs of known spectral type (Testi et al. Tea01 (2001); 2002b ). Data reduction and calibration was performed as described in Testi et al. (Tea01 (2001); 2002a ).
2.3 Broad-band photometry
On August 1 and 3 2001, we obtained moderately deep Gunn-i integrations using DFOSC and the Danish 1.54 m telescope at the ESO La Silla observatory. Following standard bias, flat fielding and sky subtraction, typically 6 individual 15 min dithered frames were coadded to produce the final images. Photometric calibration was achieved by observing a set of stars from the Landolt (L92 (1992)) catalogue, for which i-band AB magnitudes were computed using the transformations given in Fukugita et al. (Fea96 (1996)). Given the uncertainties in the transformations and the non perfect observing conditions, the uncertainties in the photometry are rather large.
For all sources near-IR J,H,Ks photometry is available from the 2MASS second incremental data release. Additional L’ and R-band photometry were taken from Comerón et al. (Comea98 (1998)).
3 Spectral classification and stellar properties
| (1) | (2) | (3) | (4) | (5) |
|---|---|---|---|---|
| Object | Coordinates | i-band | Other | |
| (ISO#) | (J2000.0) | (AB mag) | Names | |
| 023 | 16 26 18.8 | -24 26 09 | 20.34 0.15 | SKS1-10 |
| 030 | 16 26 21.4 | -24 25 59 | 16.50 0.10 | SKS1-13 |
| GY5 | ||||
| 032 | 16 26 21.7 | -24 44 43 | 16.26 0.10 | – |
| 033 | 16 26 22.2 | -24 24 05 | 21.73 0.20 | SKS3-13 |
| GY11 | ||||
| 102 | 16 27 06.5 | -24 41 50 | 15.75 0.10 | GY204 |
| 160 | 16 27 37.4 | -24 17 58 | – | – |
| 164 | 16 27 38.6 | -24 38 39 | 18.18 0.10 | SKS1-49 |
| GY310 | ||||
| 176 | 16 27 46.3 | -24 31 41 | – | GY350 |
| 193 | 16 28 12.2 | -24 11 37 | – | – |
| (1) | (2) | (3) | (4) | (5) | (6) |
|---|---|---|---|---|---|
| Object | ST | Teff | L⋆ | AV | M⋆ |
| (ISO#) | (K) | (L⊙) | (mag) | (MJ) | |
| 023 | M7 | 2650 | 0.04 | 8.0 | 3050 |
| 030 | M6 | 2700 | 0.07 | 3.0 | 4080 |
| 032 | M7.5 | 2600 | 0.06 | 2.0 | 3050 |
| 033 | M8.5 | 2400 | 0.008 | 7.0 | 812 |
| 102 | M6 | 2700 | 0.08 | 3.0 | 4080 |
| 160 | M6 | 2700 | 0.04 | 6.0 | 3060 |
| 164 | M6 | 2700 | 0.09 | 6.0 | 4080 |
| 176 | M6 | 2650 | 0.07 | 7.0 | 3070 |
| 193 | M6 | 2650 | 0.1 | 7.5 | 4080 |
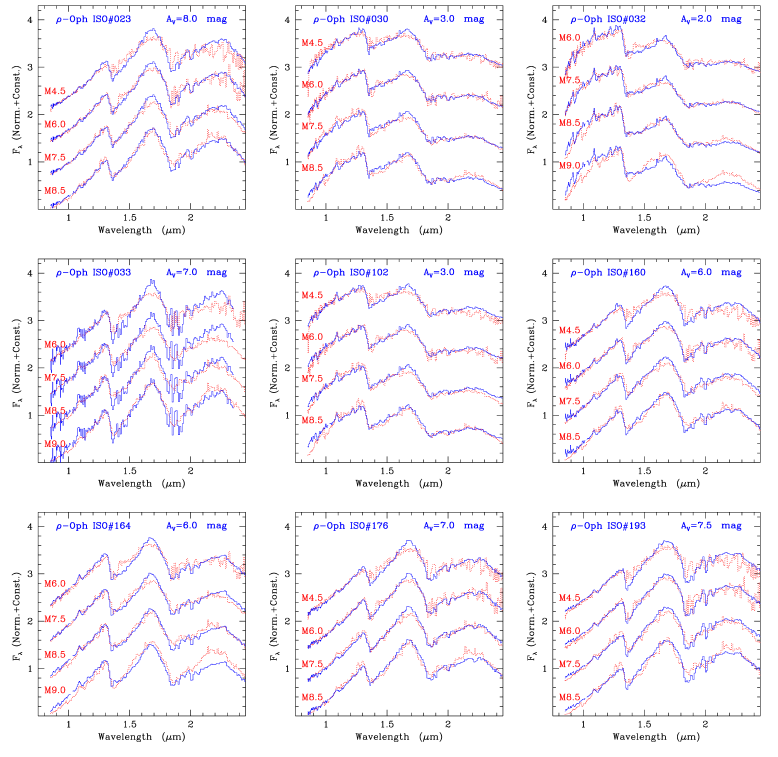
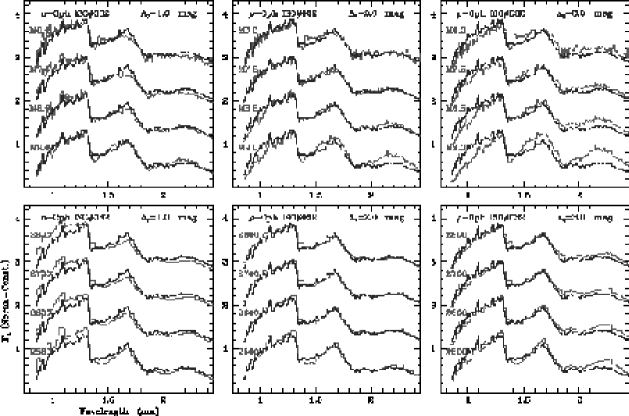
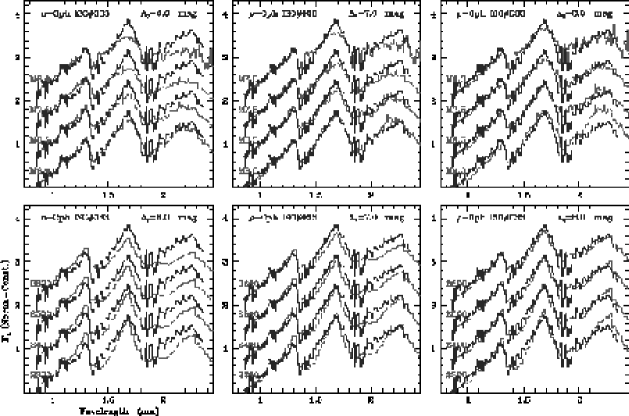
The observed near-infrared spectra obtained at the TNG, normalized to the mean flux in the interval 1.1 – 1.75 m, are shown in Fig. 2 and 3. We derive for each object effective temperature and luminosity in the following manner. We first obtain the extinction and spectral type by comparing the source spectra to those of field dwarfs. We then use the derived extinction value to obtain the effective temperature through the comparison with reddened model atmospheres. The luminosity is computed from the dereddened J-band magnitude using the appropriate bolometric correction derived from the model atmosphere.
The first step is illustrated in Figure 2, where we compare the observed spectra with a set of reddened field dwarfs, also obtained at the TNG with the same instrumentation (Testi et al. Tea01 (2001), 2002b ). We adopt the extinction law appropriate for Oph (R=4.2; Cardelli et al. CCM89 (1989)).
The overall shape of the spectrum from 1 to 2.4m depends strongly on the spectral type of the object and extinction along the line of sight. There is, however, a degree of degeneracy, so that a cooler, less reddened object looks similar to a hotter, more reddened one. Therefore, we have also considered other features, such as the shape of the H band, the drop due to water absorption at the red edge of the J band and the intensity of some of the features visible in the J band.
Although some of these characteristics depend somewhat on the gravity, so that we cannot expect a perfect match between the young BDs and the field dwarfs, the fits are very good for most objects. Of the nine targets, three have extinction AV 3 mag, and six 6.0 mag; eight out of nine objects have a spectral type M6–M7, with one subclass uncertainty, while #033 has a later spectral type (M8.5). We give the results in Table 2, Columns 2 and 5. Note that even if the extinction is determined in the wavelength range 0.8-2.4 m, for convenience we express it in terms of AV, the extinction in the visual, (AV= AJ/0.313; Cardelli et al. CCM89 (1989)).
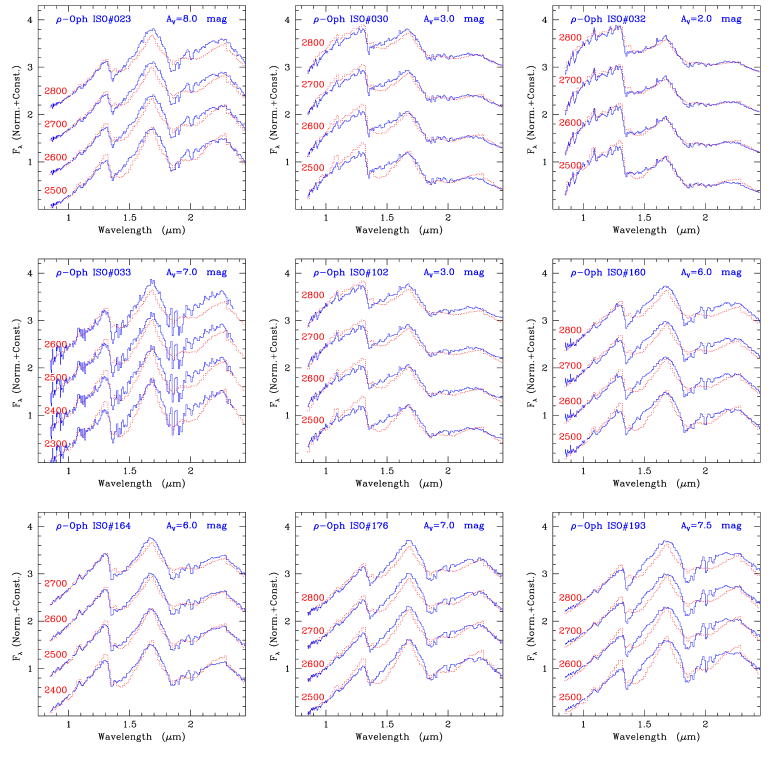
In Fig. 3, the same TNG spectra are compared to low gravity, , model stellar atmospheres (Allard et al. Aea00 (2000); Aea01 (2001)), smoothed to the appropriate resolution and reddened using the value of AV derived above. We obtain from this comparison the best value of the effective temperature Teff, as well as a check on the adopted value of AV. Our estimates of Teff have an uncertainty of typically K; we assign values of 2600–2700 K to all the objects of spectral type M6–M7.5, while #033 is definitely cooler (Teff 2400). The vales of Teff are given in Table 2, Column 3. The robustness of these results and the uncertainties in the derivation of AV and Teff are described in more detail in Appendix B.
Since all the objects in our sample have a mid-infrared excess, we have considered the possibility that excess emission is present also in the near-infrared, and is affecting our determination of the stellar parameters. We have therefore subtracted the maximum contribution expected from an irradiated disk (flared, seen face-on; see §4) from the observed spectra. We found no significant change in the derived stellar parameters.
The luminosity of the objects is shown in Table 2, Column 4. It has been computed from the dereddened J flux, and the ratio of the J to the total flux given by the appropriate stellar atmosphere model. These bolometric corrections are virtually identical to those of Wilking et al. (WGM99 (1999)) and Leggett et al. (Lea02 (2002)). For all stars, the adopted distance is D=150 pc. The uncertainties on L⋆ are difficult to determine accurately. We estimate that they probably range from 20% to 30%, mostly due to uncertainties on AV. The bolometric correction for the J band changes very little with the atmospheric parameters, but an additional uncertainty (the same for all stars) may come from the uncertainty in the assumed distance.
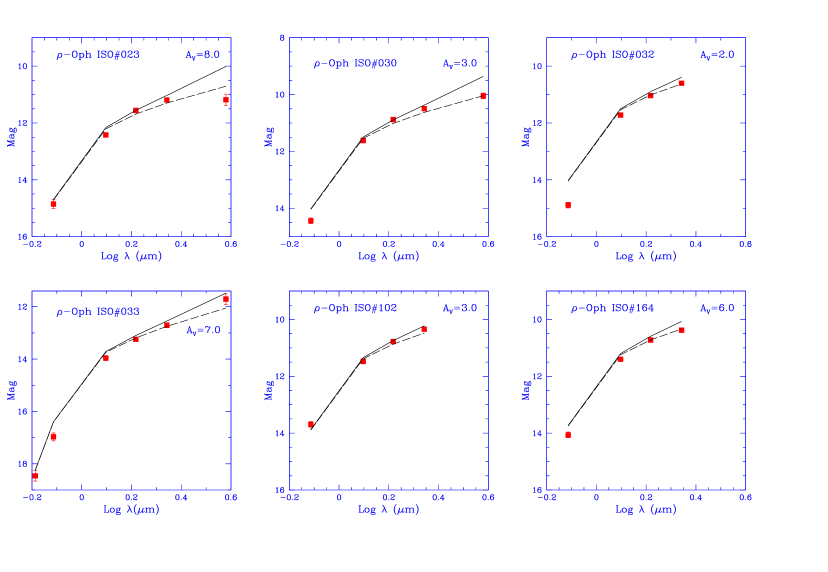
Finally, we have performed a last check on the reliability of our estimated parameters using our i-band photometry. For each star, we computed from model atmospheres and extinctions theoretical values of the magnitude in the i, J, H, K and L bands by convolving the flux distribution with the appropriate filter responses. The results are shown in Fig.4, where we compare model predictions and observations for the 6 stars for which i-band photometry was obtained. 111 Note that in Paper II, Fig.4 shows in the inset broad-band fluxes of #033 (GY 11) dereddened by AV=7.5 mag, rather than 7.0 as quoted. The agreement of the i-band observed and predicted magnitudes is generally rather good, given the extreme sensitivity of the model predictions to the exact shape of the i-band filter, with the possible exception of #032, which would need AV=3 mag, rather than the 2 mag determined from the comparison with field dwarfs. The corresponding change in luminosity would be of 35%.
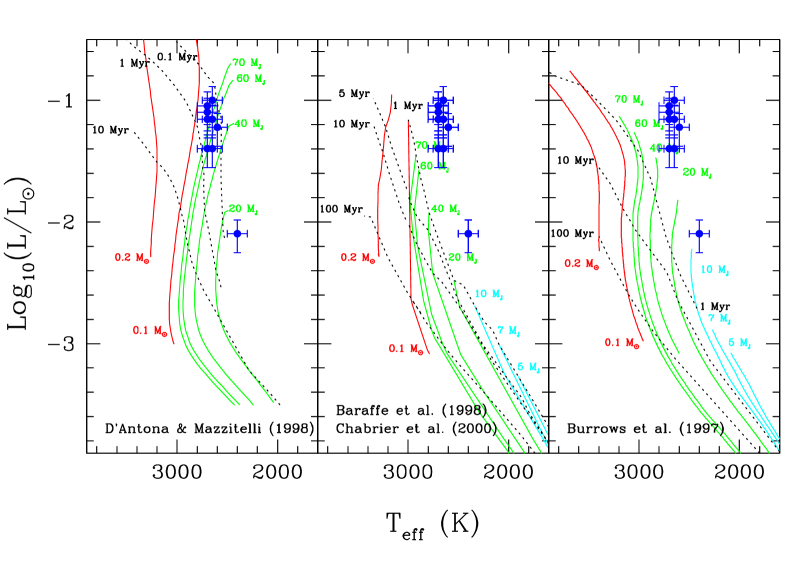
Fig. 5 shows the location of the nine Oph objects in the HR diagram. In the three panels, we overlay them to three different sets of evolutionary tracks, computed by D’Antona & Mazzitelli (DM97 (1997)), Chabrier et al. (Chea00 (2000)) and Burrows et al. (Bea97 (1997)), respectively. The derived masses (Table 2, Column 6) depend on the adopted tracks, hence we report the corresponding range of values. All objects appear to be very young, with ages lower than 1 Myr and probably of the order of a few yr. It is well known that at such ages evolutionary tracks are not very reliable (Baraffe et al. Bar02 (2002)), and that the parameters derived from the location on the HR diagram are only indicative. However, in spite of the uncertainties in both tracks and observations, we estimate that our sample contains one very low mass object (#033), with a mass of only 8–12 MJ (Paper II), and a group of objects with masses in the BD range, of which about half (#023, #032, #160 and #176) are very likely BDs.
The clustering of eight out of nine of our objects in a narrow region of the HR diagram is a result of our selection criteria and can be understood as follows. TTS in Oph have typical ages of 1 Myr, with very few stars as old as 3 Myr (Palla & Stahler PS00 (2000)). The lack of older BDs in the sample is easy to understand, since the limited sensitivity of the ISOCAM survey (especially at 14.3 m) strongly biases towards the highest luminosity, hence the youngest sources, and we expect to find in our sample only BDs younger than the average TTS. Older, more massive objects could, in principle, fall in our sample. In practice, we found that this was not the case, given Oph typical age. We have applied the procedure adopted by Bontemps et al. (Bonea01 (2001)) to a “theoretical” star with mass 0.2 M⊙ and age of 2 Myr, using model-predicted J, H, K magnitudes (Baraffe et al. Bea98 (1998)) and AV9 mag; such a star would have a computed luminosity higher than our selected upper limit (L⋆ 0.04 L⊙), and would therefore not be included in our sample. Younger stars would be even more luminous.
4 Disk models
All nine objects have mid-infrared fluxes measured with ISOCAM in at least two bands (centered at 6.7 and 14.3 m; Bontemps et al. Bonea01 (2001)). In three cases, there are additional ISOCAM observations in three narrower bands, centered at 3.6, 4.5 and 6.0 m; Comerón et al. Comea98 (1998)). The ISOCAM points are shown for each object in Fig. 6, together with our calibrated and de-reddened TNG spectra.
For each system we compute the SED predicted by disk models, assuming that the disk is heated by the radiation of the central object. We ignore in this paper any possible viscous heating within the disk (see §6 for a brief discussion). We follow as in Paper I and II the method outlined by Chiang & Goldreich (CG97 (1997); CG97), with some improvements and modifications (Natta et al. Nea01 (2001); Chiang et al. Cea01 (2001)). CG97 consider a disk in hydrostatic equilibrium in the vertical direction (flared), and describe at each radius the vertical temperature structure of the disk in terms of two components: the disk surface, i.e., the external layer of the disk which is optically thin to the stellar radiation, and the disk midplane. These models allow a quick and reasonably accurate description of the expected SED, more than adequate for the purposes of this paper.
The disk is a scaled-down version of TTS typical disks. It extends inward to the stellar radius, and outward to RD= cm (67 AU). The total mass is MD0.03 M⋆, and the surface density varies as R-1. The dust in the disk midplane has opacity cm2 g-1 (Beckwith et al. BSCG90 (1990)). For the dust on the disk surface, we take the mixture of carbonaceous materials and silicates that provides a good fit to the SEDs of several pre-main–sequence stars (Natta et al. Nea01 (2001)), i.e., a MRN distribution of graphite and astronomical silicates with , =100 Å, =1 m, 30% of cosmic C and all Si into grains.
The results of the model calculations are shown in Fig. 6. The stellar parameters (Teff, L⋆, M⋆) are taken from Table 2. As pointed out in Paper I, most of the disk parameters are irrelevant for the calculation of the mid-infrared disk emission, or appear in combinations, and cannot be determined individually (see also Chiang et al. Cea01 (2001)). As long as the disk midplane remains optically thick to mid-infrared radiation, the only parameters that affect the SED in the near and mid-infrared are the geometrical shape of the disk (i.e., the flaring angle), the inclination to the line of sight and, to some degree, the disk inner radius . There is also some dependence of the shape of the SED on the surface dust model; however, since the luminosity intercepted and re-radiated by the optically thin surface layers is fixed, variations due to (reasonable) changes of the grain properties are well within the uncertainty of the existing observations.
The upper solid curves in Fig. 6 show the SEDs of flared disks with =R⋆, seen face-on. They all have strong silicate emission at 10 m and a rather flat spectral slope between the two ISO bands at 6.7 and 14.3 m, of order (). If, rather than extending all the way to the stellar surface the disk is truncated further out, as predicted by magnetospheric accretion models in TTS, at each radius the surface of a flared disk intercepts and reprocesses a larger fraction of the stellar radiation. The disk emission increases correspondingly at all wavelengths but in the near-infrared, where one is sensitive to the lack of the hottest disk dust. A model with 3R⋆ is shown (dashed line) for #033, where, as discussed in Paper II, the inner hole may account for the large observed mid-infrared excess.
Large variations of the predicted SED occur if the disk shape changes. On each panel, we show the predictions of geometrically thin, “flat” disks (lower solid lines), i.e., disks where the grains are not well mixed with the gas, but have collapsed onto the disk midplane. Also for these models, we have adopted the CG97 formalism, which remains adequate in all the cases where the disk heating is dominated by the stellar irradiation. If the surface contribution to the SED were negligible, one would recover for these disks the well known temperature profile and the power-law slope of the SED (Adams and Shu AS86 (1986)). Our calculations show that also in flat disks the surface contributes to the mid-infrared flux, as shown by the presence in the SED of the silicate feature in emission; however, the midplane emission is larger than the surface contribution at all wavelengths but in the region 8–12 m, where the silicate feature dominates, so that the spectral slope between the two ISO points is always very close to 4/3. At all wavelengths larger than 2.5 m, the emission of a flat disk is significantly lower than that of a flared one.
Finally, we show on three Panels of Fig. 6 the predictions of tilted flared disks, seen by the observer with inclinations of 69o (#102), 80o (#164) and 86o (#193) respectively (0o for face-on disks).
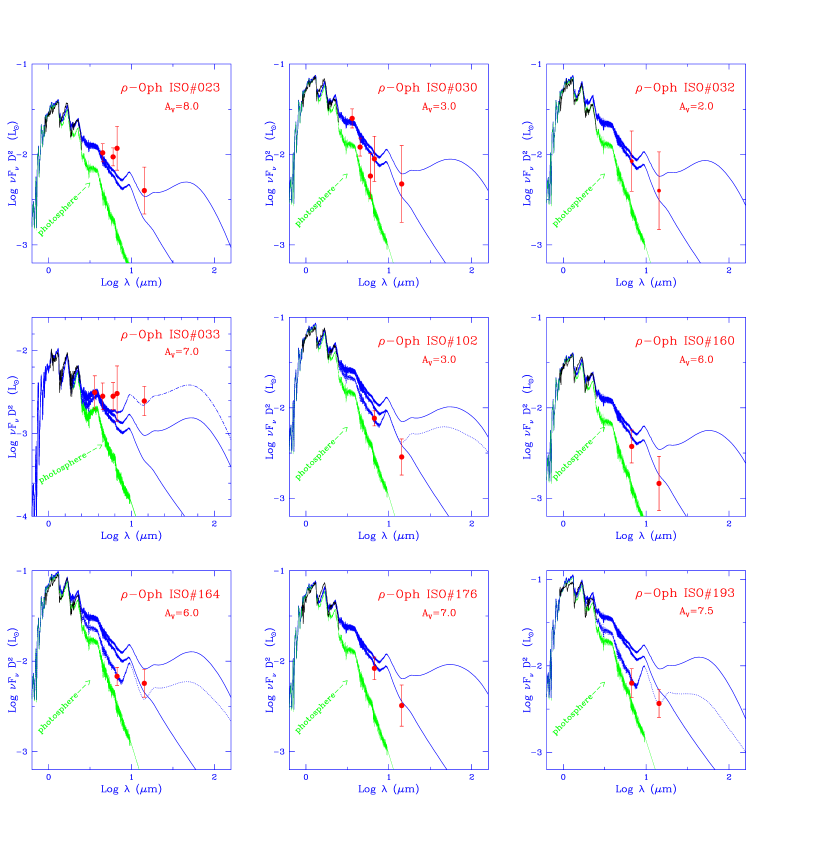
The comparison of the ISO observations to the model predictions shows that irradiated disk models can account for the observed mid-infrared excess. More precisely, and in spite of the large uncertainties of the ISO data, inspection of Fig. 6 shows that there are five stars out of nine (#030, #032, #102, #160, #176) that are extremely well fit by flat disk models. Two objects (#023 and #033) seem to require flared, face-on disks, while two others have a lower mid-infrared excess, consistent with disks seen rather edge-on. However, given the large error bars and the model uncertainties, most objects with flat disks are also consistent with flared disk models with large inclination, as shown for the case of #102.
5 Discussion
5.1 Photospheric Parameters
The agreement between the object spectra and those of field dwarfs is good beyond our expectations. The largest differences are of 20% at most, generally at the peak of the H band, with no systematic difference between objects with large or low extinction, nor between stronger and weaker sources. Even the relatively narrow features that appear in the spectra around 1.1 m are often well matched in the two sets of spectra. This indicates that, at the resolution of our observations, one should not expect strong gravity effects. We have checked that this is indeed the case by comparing model atmosphere spectra smoothed to the observed resolution for stars of different gravity (Allard et al. Aea01 (2001)), ranging from 3.5 to 6.0. All the models with gravity in the interval 3.5–5.0 are practically identical, at our spectral resolution and in this temperature range.
The comparison of our spectra with model atmosphere predictions is somewhat less satisfactory, especially in the H band, where the shape of the feature peaked at about 1.7 m (resulting from water absorption features at shorter and longer wavelengths) is narrower in the models than observed, and around 1.3 m, where the models tend to predict more emission than is observed. Note, however, that this is not always the case (see, for example, #032 and #164). Still, the agreement is in general rather good, with differences that never reach more 30%, again with no dependence on the extinction nor on the observed signal.
The comparison of our determinations of the photospheric parameters of individual objects with previous spectroscopic determinations in the literature shows that in some cases there is good agreement, while in others there are discrepancies that are not easily understood. For example, Wilking et al. (WGM99 (1999)) assign similar spectral types to #023, #030, but a significantly later one (M8.5) to #164, based on K band R300 spectroscopy. For the same object, Luhman & Rieke (LR99 (1999)) estimate a spectral type M7, based on intermediate resolution K band spectroscopy, similar to our classification M6. The same authors, on the other hand, attribute to #030 a somewhat earlier spectral type (M5-M6). The case of #033 (GY 11) has been discussed in detail in Paper II. A likely reason for differences in the spectral classification is that our scheme is based on the overall spectral shape, while the others rely on fitting individual spectral features, which in the infrared show large scatter for late M objects (e.g., Luhman & Rieke LR98 (1998)).
On the more general issue of the effective temperature scale of young BDs, we attribute temperatures in the range 2600-2700 K to our group of objects with spectral types M6–M7.5. Our only object with later spectral type (M8.5) has Teff=2400100 K. In a preliminary analysis of our sample field dwarfs (Testi et al. 2002b ), we derive a similar effective temperature-spectral type correspondence. This is not significantly different from the scale used by Wilking et al. (WGM99 (1999)) in their study of candidate BDs in Oph. It is, however, at odds with some recent results, that tend to attribute to young BDs of similar spectral types temperatures higher than our values (Lucas et al. Lucea01 (2001); Lodieu et al. Lodea02 (2002)). Further work, on larger samples of BDs in young star forming regions is clearly required.
5.2 The disk hypothesis
The comparison between models and observations, discussed in the previous section, proves that the mid-infrared excess associated to many young BDs can be accounted for by the emission of circumstellar disks heated by the radiation of the central object.
Few disk properties are constrained by the existing observations, and we do not want to overinterpret our results, given the large uncertainties of the observed fluxes, and the simplicity of the adopted models. However, in our limited sample of nine stars we find disks of different flavours, and, in particular, an indication that many BDs may have flat disks. If we consider also the three objects in Cha I studied in Paper I, we have three objects with clear evidence of flared disks, and nine where flat disks seem more appropriate, although we cannot rule out almost edge-on flared disks for some of them (see also Apai et al. apai02 (2002)). This is potentially an interesting result, since it seems natural to associate flat disks with dust sedimentation toward the midplane. In our selection of ISO sources, we have an obvious strong bias against objects with flat disks, since we required that the sources were detected by ISO in both bands. So, the fact that our objects with the lowest 6.7 m fluxes (Cha H1 and #033) have flared disks is not surprising. However, there is no bias against selecting flared disk objects of higher luminosity, and we find only one (#023). The possibility of dust settling in these very young low-mass objects is intriguing. However, it needs to be confirmed by high-quality photometric observations at longer wavelengths, before entering into further speculations.
The ejected embryos hypothesis does not exclude that BDs may have a small, and therefore short-lived, circumstellar disk. Estimates by Bate et al. (Bate02 (2002)) give disk radii of about 20 AU or less. The existing infrared data do not allow us to rule out such possibility, since the SED of a model with RD=20 AU will differ from the SED of a disk with RD=75 AU only at wavelengths 40 m. The mass of the disk is not predicted by the Bate et al. (Bate02 (2002)) calculations, nor constrained by the existing observations, since the only constraint we can set is that the disk has to be optically thick in the mid-infrared. This, however, only requires a disk mass of 10-5–10-6 M⊙(or MD/Mstar), which is still consistent with a typical disk (having MD/Mstar 0.03, RD=75 AU), truncated at RD=20 AU. Until far-infrared and millimeter data become available, the only way to validate these models is to determine the fraction of disks in unbiased samples of BDs of known age.
Finally, one should remember that our analysis relies on the assumption that the ISO sources coincide with the objects we identify in the near-infrared. In some cases, this is likely to be true (see Appendix A and the discussion of #033 in Paper II). In other cases, it is impossible to check the validity of this assumption, given the large ISO beam and the presence of other red objects in the near-infrared images. However, the good agreement between the observations and the model predictions, which depend essentially only on the stellar properties we derive from the spectroscopy, is encouraging. Further tests of the association of the observed mid-infrared excess with the identified stars could be obtained by accurate images in the L and M bands, where we predict that the disk emission should be dominant (see Fig. 6).
6 Conclusions
We have discussed in this paper a sample of nine very low-mass objects in the Oph star forming region that have evidence for circumstellar warm dust. We selected from the ISOCAM sample of Bontemps et al. (Bonea01 (2001)) those objects that have mid-infrared detections in both the 6.7 and the 14.3 m bands, relatively low extinction and low luminosity. We determined first if these BD candidates were indeed bona-fide BDs, and then we checked if the observed infrared excess was consistent with the predictions of disk models, similar in properties to those associated to T Tauri stars.
Our strategy was very successfull. The low-resolution near-infrared spectra obtained at the TNG allowed us to determine for each object spectral type and extinction, by comparison with field dwarfs observed with the same instrumental set-up, as well as effective temperature and luminosity, by comparison with model atmosphere predictions. The comparison with various sets of evolutionary tracks on the HR diagram shows that all the nine sources are very young, low-mass objects. In particular, one (#033 or GY 11, already discussed in Paper II) has a mass of 8-12 MJ, while the others have masses in the BD mass range; four of them are very likely bona-fide BDs.
In all objects, the mid-infrared excess is consistent with the predictions of disks irradiated by the central object. We find no evidence of strong accretion occurring in these systems, based on the fact the observed near-infrared fluxes are dominated by the emission of the photospheres, and there is very little contribution (if any) from hot dust. However, it is not clear to which degree the near-infrared excess in very low-luminosity objects is a sensitive indicator of accretion (see, for an example of an actively accreting object with no near-infrared excess, Fernández & Comerón FC01 (2001)), and this issue should be explored more quantitatively in the future.
The existing data indicate that the disks must be optically thick at mid-infrared wavelengths; in some cases they must be flared (i.e., gas-rich with well-mixed dust and gas), while in others it is possible that they are geometrically flat, i.e., that dust has settled to the disk midplane. However, data at longer wavelengths are necessary to further investigate this point, and we do not want to put too much weight on this rather weak evidence.
In the same sobering vein, we want to point out that our results do not discriminate yet between different formation mechanisms, namely between the possibility that BDs form from the gravitational collapse of individual, very low-mass cores, and the ejected embryo theory. We fit the observed mid-infrared excess with a scaled-down version of disks around the more massive TTS. This, however, just implies that “normal” disks can account for the existing observations, since few parameters are actually constrained. As already pointed out in Paper I and II, only observations at long wavelengths can measure the disk radius and mass, since the lower limits that we can derive from the conditions that the disk is optically thick in the mid-infrared are hardly significant.
Having stressed all the limitations of our results, let us now point out that this is the first sample of very low mass objects in a star forming regions where evidence for circumstellar disks has been found and investigated in detail. Our accurate near-infrared spectroscopy, which allows us to estimate a reliable value of the mass of the objects, proves that disks exist around low mass objects, well into the range of brown dwarfs. In one case, #033, our data provide strong indications that an object with mass close to or below the deuterium burning limit also has a circumstellar disk. In addition to providing the beginning of a census of disk properties around BDs, our models indicate that the excess due to the cold disks irradiated by a central BD can only be detected by deep photometry in the L and M bands. We expect that major progress in our understanding of BD formation will be obtained by combining near-infrared low resolution spectroscopy with photometry in J,H,K,L,M of unbiased (i.e., not a-priori selected because they have a mid-infrared excess, as here) samples of BD candidates in star forming regions of different age.
Acknowledgements.
We thank Carsten Dominik and Michael Meyer for useful discussions. It is a pleasure to acknowledge the TNG and ESO staff for their excellent support during observations. This publication makes use of data products from the Two Micron All Sky Survey, which is a joint project of the University of Massachusetts and the Infrared Processing and Analysis Center/California Institute of Technology, funded by the National Aeronautics and Space Administration and the National Science Foundation. This work was partly supported by ASI grant ARS 1/R/27/00 to the Osservatorio di Arcetri.Appendix A Ks or K’ finding charts
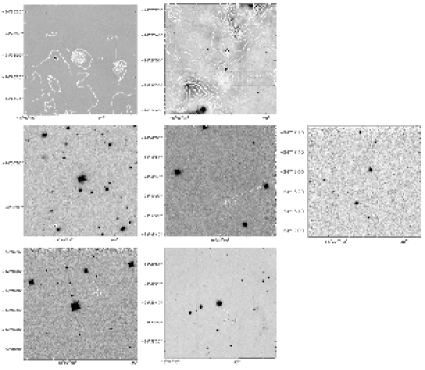
Fig. 7 shows 2.2 m finding charts for eight of the nine sources discussed in this paper. The grey scale images have been obtained at the TNG with NICS (#023, #030, #032) by us on July 2001, at ESO/UT1 with ISAAC (#033) and at ESO/NTT with SOFI (#102, #160, #164, #176). The ISAAC and SOFI data have been extracted from the ESO Science Archive; they have been originally obtained for ESO proposals 63.I–0691, 65.I–0576, 67.C–0325 and 67.C–0349. Finding chart for #193 can be obtained from the 2MASS database at http://irsa.ipac.caltech.edu. For sources #023, #030 and #033, contours show the ISOCAM-LW1 emission (Comerón et al. Comea98 (1998)).
Appendix B Accuracy in the determination of the photospheric parameters: AV, Spectral Type, and Teff
In this appendix we discuss the accuracy of the method used to derive extinction, spectral types and effective temperatures from the low-resolution near infrared spectra. For this purpose we will discuss the derivation of the parameters for three extreme cases, the source with the highest extinction (#023), the source with the lowest extinction (#032), and the later spectral type source (#033).
The procedure starts with the determination of the extinction and spectral type based on the comparison with field dwarfs spectra obtained with the same instrumental setup (Testi et al. Tea01 (2001); 2002b ). For each source we compare the observed spectrum with those of the field dwarfs reddened by different amounts, the value of the extinction is varied until the best match is found with some of the field dwarfs. In practice, we varied the value of AV in steps of 0.5 mags, since smaller variations cannot be significantly distinguished in the comparison.
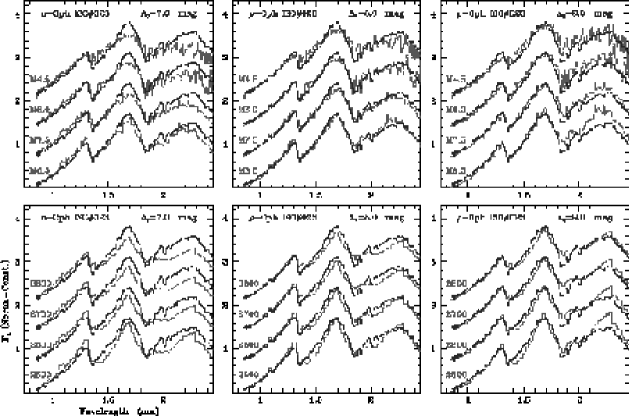
In the top panels of Figure 8 we show this comparison for source #023 and for three values of A7, 8, and 9. The best matches, based on the shapes of the J and H bands, and the fact that the source spectrum at K cannot be lower than the field dwarfs, to allow for a possible contribution from disk emission, are found for A8 mags and spectral types between M6 and M7.5.
Once the spectral type and extinction have been estimated, the source spectrum is compared with appropriate surface gravity (Log(g)=3.5) model atmospheres (Allard et al. Aea00 (2000)), which provide an estimate for the effective temperature and an additional check on the extinction. In the bottom panels of Figure 8 we present this comparison for source #023. The comparison with the atmospheres confirms that the estimate of A8 mags provides the best match, and show that the two models that match more closely the observed spectrum are those with temperature 2600 and 2700 K, hence the best estimate that we derive is Teff=2650 K, with an uncertainty of K.
In Figure 9 we show the procedure for the source in our sample with the lowest value of the extinction (#032). Given the lower extinction, the spectrum clearly shows some features in the J-band that correspond to the combination of several blended photospheric absorption lines and bands. Also in this case we show the comparison with field dwarfs for three values of AV spaced by 1 magnitude. In this case, it is possible to obtain a good match with a later spectral type and a lower extinction (A, M8.5); however, the match with M7.5 and A2 mags is the best. This choice of the extinction is confirmed by the comparison with the model atmospheres in the bottom panels of Fig. 9. The effective temperature is estimated to be 2600100 K, as for the previous source.
The source for which the derivation of the parameters is most complicated is #033 (Fig. 10) because of the high extinction and the lower signal to noise of the spectrum. In this case good matches can be obtained for the lower extinction and later spectral type, A6 mag M9.0, as well as higher extinction and earlier spectral type, A8 mag M7.5. The comparison with model atmospheres would favor the higher extinction. Thus, also considering the uncertainties in the model atmospheres at these spectral types (see e.g. Leggett et al. Lea01 (2001)), our best estimates are: A7.51 mag, M8.5 with one subclass uncertainty and Teff=2400100 K.
References
- (1) Adams F.C., Shu F.H. 1986, ApJ, 308, 836
- (2) Allard F., Haushildt P.H., Schweitzer A. 2000, ApJ, 539, 366
- (3) Allard F., Haushildt P.H., Alexander D.R., Tamanai A., Schweitzer A. 2001, ApJ, 556, 357
- (4) Apai I., Pascucci I., Henning Th., et al. 2002, ApJ, submitted
- (5) Baffa C., et al. 2001, A&A 378, 722
- (6) Baraffe I., Chabrier G., Allard F., Hauschildt P.H. 2002, A&A, 382, 563
- (7) Baraffe I., Chabrier G., Allard F., Hauschildt P.H. 1998, A&A, 337, 403
- (8) Bate M.R., Bonnell I.A., Bromm V. 2002, MNRAS, 332, L65
- (9) Beckwith S.V.W., Sargent A.I., Chini R.S., Guesten R. 1990, AJ, 99, 924
- (10) Bontemps S., André P., Kaas A.A., et al. 2001, A&A, 372, 173
- (11) Burrows A., Hubbard W.B., Lunine J.I., Liebert J. 2001, Rev. Mod. Phys., 73, 719
- (12) Burrows A., Marley M., Hubbard W.B., et al. 1997, ApJ, 491, 856
- (13) Cardelli J.A., Clayton G.C., Mathis J.S. 1989, ApJ, 345, 245
- (14) Chabrier C., Baraffe I., Allard F., Hautschild P. 2000, ApJ, 542, 464
- (15) Chiang E.I. , Goldreich P. 1997, ApJ, 490, 368
- (16) Chiang E.I., Joung M.K., Creech-Eakman M.J., et al. 2001, ApJ, 547, 1077
- (17) Comerón F., Rieke G.H., Claes P., Torra J., Laureijs R.J. 1998, A&A, 335, 522
- (18) Comerón F., Neuhäuser R., Kaas A.A. 2000, A&A, 359, 269
- (19) D’Antona F., Mazzitelli I. 1997, Mem.Soc.Astr.It., 68, 807
- (20) Fernández M., Comerón F. 2001, A&A, 380, 264
- (21) Fukugita M., Ichikawa T., Gunn J.E., et al. 1996, AJ, 111, 1748
- (22) Greene T.P., Young E.T. 1992, ApJ, 395, 516
- (23) Landolt A.U. 1992, AJ, 104, 340
- (24) Leggett S.K., Allard F., Geballe T.R., Hauschildt P.H., Schweitzer A. 2001, ApJ, 548, 908
- (25) Leggett S.K., Golimowski D.A., Fan X. et al. 2002, ApJ, 564, 452
- (26) Lin D.N.C., Laughlin G., Bodenheimer P., Rozyczka M. 1998, Science, 281,2025
- (27) Lucas P.W., Roche P.F., Allard F., Hauschild P.H. 2001, MNRAS, 326, 695
- (28) Lodieu N, Caux E., Monin J.-L., Klotz A. 2002, A&A, 383, L15
- (29) Luhman K.L., Rieke G.H. 1998, ApJ, 497, 354
- (30) Luhman K.L., Rieke G.H. 1999, ApJ, 525, 440
- (31) Muench A.A., Alves J.A., Lada C.J., Lada E.A., 2001, ApJ, 558, L51
- (32) Natta A., Prusti T., Neri R., Wooden D., Grinin V.P. 2001, A&A, 371, 186
- (33) Natta A., Testi L. 2001, A&A, 367, L22 (Paper I)
- (34) Oasa Y., Tamura M., Sugitani K. 1999, ApJ, 526, 336
- (35) Oliva E. 2000, Mem. Soc. Astron. Italiana, Vol. 71, p. 861
- (36) Palla F., Stahler S.W. 2000, ApJ, 540, 255
- (37) Papaloizou J.C.B., Terquem C. 2001, MNRAS, 325, 221
- (38) Persi P., Marenzi A.R., Olofsson G., et al. 2000, A&A, 357, 219
- (39) Reipurth B., Clarke C.J. 2001, AJ, 122, 432
- (40) Shu F.H., Adams F.C., Lizano S. 1987, ARA&A, 25,23
- (41) Strom K.M., Kepner J., Strom S.E. 1995, ApJ, 438, 813
- (42) Testi L., D’Antona F., Ghinassi F., et al. 2001, ApJ, 552, L147
- (43) Testi L., Natta A., Oliva E., et al. 2002a, ApJ, 571, L155 (Paper II)
- (44) Testi L., et al. 2002b, A&A in preparation
- (45) Wilking B.A., Greene T.P., Meyer M.R. 1999, AJ, 117, 469