Pulsar Wind Nebulae and Particle Acceleration in the Pulsar Magnetosphere
Abstract
This paper is originally intended to give a comprehensive review of the pulsar wind nebulae and magnetosphere, but it has been moved to a poster paper so that we have changed the aim of the paper and focused on the Crab Nebula problem to suggest that particle acceleration takes place not only at the inner shock but also over a larger region in the nebula with disordered magnetic field.
Kennel and Cornoniti (1984) constructed a spherically symmetric model of the Crab Nebula and concluded that the pulsar wind which excites the nebular is kinetic-energy dominant (KED) because the nebula flow induced by KED wind is favorable to explain the nebula spectrum and expansion speed. This is true even with new Chandra observation, which provides newly the spatially resolved spectra. We have shown below with 3D modelling and the Chandra image that pure toroidal magnetic field and KED wind are incompatible with the Chandra observation.
1 Introduction
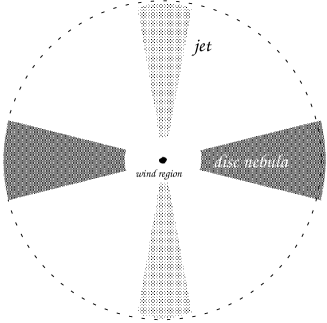
KC model (Kennel and Coroniti 1984) assumes that a super fast MHD wind from the central pulsar terminates at a shock, and the shocked wind radiates in synchrotron radiation, which is observed as the nebula. The central cavity is identified as the wind region.
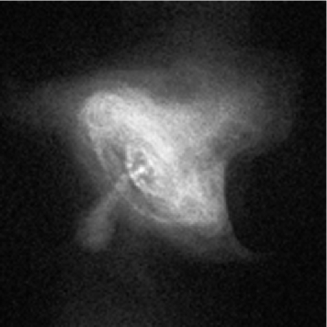
The pulsar wind is originally Poynting energy dominant deep in the pulsar magnetosphere, but by MHD acceleration the energy is converted into kinetic energy of the plasma outflow. How efficient the acceleration is a main problem in the theory of relativistic centrifugal wind. It is known that this problem is coupled with the jet-disc formation, which is clearly observed with Chandra (Fig. 4).
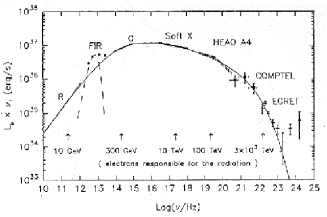
The acceleration efficiency is parameterized by so-called -parameter which is the ratio of the Poynting energy to kinetic energy of the terminal flow just before the shock. KC find that determins the expansion speed of the nebula and in turn spectrum of the nebula. It was a great success that KC model reproduces the nebula spectrum (Fig. 1). KC found that (kinetic energy dominant) and the Lorentz factor of the wind is .
On the other hand, no wind theory explains such a high acceleration. It must be noted that the observed image suggest that the wind has jet-disc structure, which is not explained, either.
The aim of this paper is to apply the picture of KED wind to the new Chandra data and examine whether the model still describes the nebula well or it needs some modification.
2 Model
Nebula Flow is based on the KC model:
- toroidal magnetic field
- ideal MHD radial flow
- confined in a disc and jet (opening angles 20 degree)
- erg/s, ,
- power law spectrum just after the shock
Given flow pattern , we solve evolution of distribution function and magnetic field in the flow with
| (1) | |||||
| (2) | |||||
| (3) | |||||
| (4) |
and
| (5) |
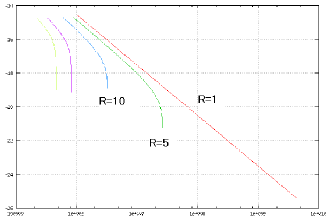
where adiabatic and synchrotron losses are taken into account (Fig 3); is the radial distance of the fluid elecment, is the proper time, and other notations are as usual. Since the distribution function is obtained in the flow proper frame, the specific emissivity is first obtained in the proper frame. Given the observer’s direction, in use of Lerentz transformation, the emissivity is evaluated for the observer and integrated along the line-of-sight to obtain the observed brightness.
3 Results
-
1.
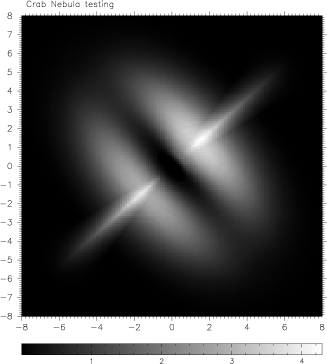
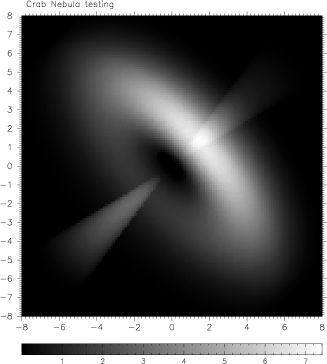
Reproduced X-ray image is not a ring but ‘lip’-shaped (Fig. 5). This is due to the assumption that the magnetic field is pure toroidal. We suggest that some important fraction must be in turbulent field.
-
2.
Intensity contrast between fore and back sides is obtained to be 1.3, while an observed value is about 5. Inconsistency is due to deceleration of the nebula flow, which is a result of small sigma value.
-
3.
Spatial variation of the spectra is well explained by the model with small sigma (not shown here in a form of fiugre).
-
4.
The above points 2. and 3. are incompatible under a small-sigma model, suggesting some important ingredient is missing.
4 Concluding Remarks
A simple extension of the KC model to the Chandra observation lead us to incompatible results: On one hand the model with a small sigma value gives a spectrum in agreement with the observation, on the other hand the same model gives inconsistent intensity contrast. Together with the suggestion of turbulent field, the nebula flow may probably be in non-ideal MHD, which means particles are accelerated not only at the shock but also in a larger region in the nebula by, say, magnetic reconnection. The value of is not constrained to be as small as .
references
Atoyan, A. M. & Aharonian, F. A. 1996, MNRAS 278 525
Kennel, C. F. & Coroniti, F. V. 1984, ApJ 283 694
Kennel, C. F. & Coroniti, F. V. 1984, ApJ 283 710
Mori, K., 2002 PhD thesis, Ohsaka University
Wiesskopf, M. C., et al. 2000, ApJ 536 L81