Soft X-ray Spectra of Seyfert 2 Galaxies
Abstract
High resolution spectroscopic observations of Seyfert galaxies with Chandra and XMM-Newton allows us to study the detailed ionization and thermal structures of the X-ray absorbing/emitting material in the circumnuclear environment. The vast improvement in the spectral resolving power by more than an order of magnitude enables us, for the first time, to unambiguously distinguish the dominant line emission mechanisms and to measure its dynamical properties as well. The X-ray band harbors spectral transitions from a wide range of ionization states, including valence-shell transitions in K-shell and L-shell ions from most cosmically abundant elements, as well as inner-shell transitions of iron and other mid- elements, which can be probed through absorption measurements. The X-ray spectrum, therefore, provides simultaneous velocity and column density constraints of highly ionized to only slightly ionized gas harbored in many of these systems.
We summarize recent results that have emerged from observations of Seyfert 2 galaxies with the grating spectrometers onboard Chandra and XMM-Newton. We give particular emphasis to an empirical physical model that we have developed based on the observed spectra, and how it can be used for comparative studies with Seyfert 1 galaxies to test the AGN unification scenarios.
1 Introduction
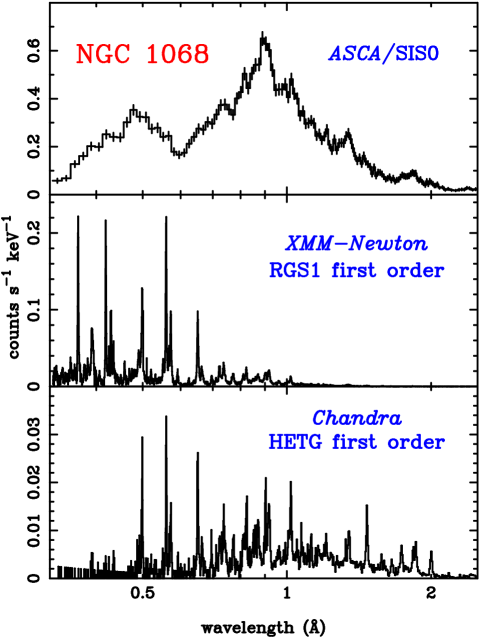
In the past several years, X-ray observations have played an important role in the development of a “unified model” of AGN, in which the observational properties of the various classes (BL Lac objects, Seyfert 1 and 2, etc.) are explained solely in terms of their inclination angle with respect to the observer (Miller & Antonucci 1983; Antonucci & Miller 1985; Miller & Goodrich 1990; Antonucci 1993). Such issues are naturally related to the understanding of the structure of matter immediately surrounding the central engine, where a variety of physical processes are expected to take place. Spectral modeling and observations both suggest that the soft X-ray band should contain a wealth of information about the circumnuclear environment, which harbors regions ranging from relatively cool absorbing and reflecting media to hot and tenuous ionized regions. X-ray spectra of many AGN exhibit strong emission lines, especially in Seyfert 2 galaxies where the central continuum source is blocked by a torus of obscuring material and emission lines of large equivalent width are produced, both in the hard (2 – 10 keV) and soft X-ray bands (0.3 – 2 keV). However, owing to the low spectral resolution spectra available prior to the deployment of Chandra and XMM-Newton, physical parameters that may, in principle, be derived from the soft X-ray spectrum were not well-constrained.
ASCA and Beppo-SAX observed strong soft X-ray line emission in many Seyfert 2 galaxies. The nature of this line emission, however, has remained rather controversial, and models involving both photoionized and collisionally ionized plasmas yielded acceptable fits to the data (see, e.g., Ueno et al. 1994; Iwasawa et al. 1994; Netzer & Turner 1997; Turner et al. 1997; Griffiths et al. 1998; Sako et al. 2000a).
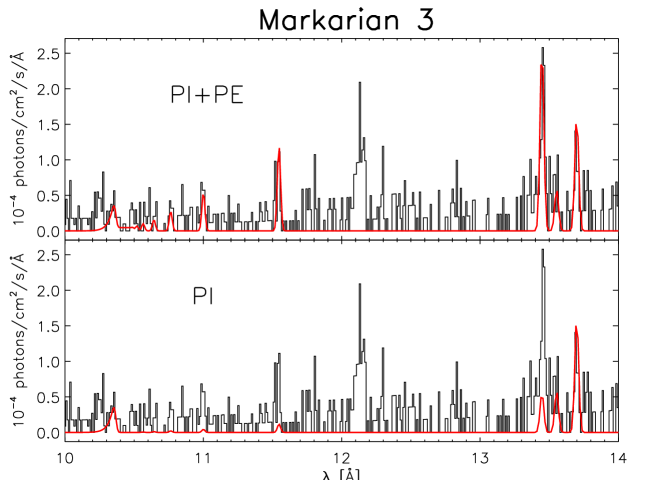
Chandra and XMM-Newton spectroscopic observations of Seyfert galaxies have provided us with a better understanding of the physical nature of the circumsource medium. Sako et al. (2000b) have shown using Chandra HETG data of Mrk 3 that the soft X-ray emission line spectrum is consistent with that produced in a warm absorbing medium seen in re-emission, providing further evidence that support the unified picture of AGN. Kinkhabwala et al. (2002a); Brinkman et al. (2002a) and Ogle et al. (2002a) have performed quantitative analyses of the X-ray spectra of the archetypal Seyfert 2 NGC 1068, and placed tight constraints on the column density and velocity distibution of the circumnuclear medium, as well as strict upper limits on the amount of collisionally ionized gas in this object.
Although the X-ray spectra of Seyfert 2 galaxies look very different from those of Seyfert 1, there is much overlap in the observable parameter space that characterize the physical nature of the circumsource medium. In Seyfert 1, the central continuum source is used as a back-lighter to study the properties of the medium along the line of sight through absorption spectroscopy. In Seyfert 2, on the other hand, where the direct view to the continuum source is blocked by the putative molecular torus, the properties of the absorbing medium can be studied by detailed investigation of light that is reprocessed and scattered into our line of sight.
As mentioned above, absorption spectroscopy provides information pertaining to only a particular line of sight along which the observer happens to be looking. This line of sight may or may not be representative of the entire circumnuclear region, and, as a consequence, it is not clear whether the derived parameters are representative of the global properties of the AGN. In principle, detection of emission lines superimposed on the background continuum provide some rough estimates of the covering fraction, since, unlike absorption lines, they are produced in regions that lie outside the line of sight as well, but a detailed investigation of the distribution of material is extremely difficult. A similar complication exists in interpreting the spectra of Seyfert 2. In these sources, the observed emission lines are produced in the entire circumsource medium, and the resulting spectrum is a sum over all the possible lines of sight from the central continuum source along the ionized medium. The derived column densities are, therefore, biased towards regions of high covering fraction and column density (for reasons to be discussed in detail below).
However, even given these complications, the information content of high-resolution X-ray spectra is certainly revolutionary. In the remaining sections, we discuss what we can measure from the spectrum and the assumptions that go into the modeling and interpretation. We identify and compare the parameter space spanned by spectra of both Seyfert 1s and 2s, and discuss how X-ray observations can be used to test the unified model of AGN. Since much of the results on the X-ray spectral analyses of Seyfert 1 galaxies are discussed elsewhere in this Proceedings, here I will focus mainly on high resolution spectral data of Seyfert 2 galaxies and its relation to those of Seyfert 1.
2 Observations
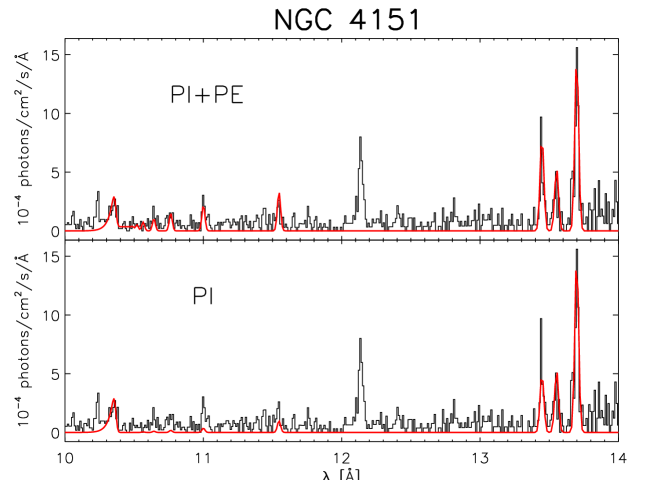
Almost all of the X-ray bright, emission line dominated Seyfert 2 galaxies have already been observed by the grating spectrometers on both Chandra and XMM-Newton. These include the following sources: Mrk 3 (Sako et al. 2000b), NGC 4151111Throughout this article, we simply refer to Seyfert 1 galaxies as objects in which the direct continuum radiation is visible in the soft X-ray region (), and Seyfert 2 as those in which the continuum below is highly attenuated. NGC 4151 was originally classified as a Seyfert 1.5 galaxy based on the optical emission line properties. However, here we simply refer it as a Seyfert 2 based on the X-ray continuum properties observed recently by Chandra. (Ogle et al. 2000), the Circinus Galaxy (Sambruna et al. 2001), NGC 1068 (Kinkhabwala et al. 2002a; Brinkman et al. 2002a; Ogle et al. 2002a), and NGC 4507. Since these objects were selected based on their soft X-ray brightnesses, their energy output is naturally dominated by AGN activity, and contamination from the host galaxy, e.g., from starburst activity, is expected to be relatively small. As shown below, the data also require that most, if not all, of the X-ray line emission is produced by AGN activity in all of the systems studied so far. In lower-luminosity Seyfert 2, the amount of starburst emission is expected to be more substantial. High-resolution spectroscopic observations of such objects, however, still do not exist.
In at least one object (NGC 1068), detailed imaging spectroscopy is possible with the Chandra grating spectrometers and the results are presented in Brinkman et al. (2002a) and Ogle et al. (2002b), as well as in this Proceedings (Brinkman et al. 2002b; Ogle et al. 2002b). In most of the other cases (Mrk 3, NGC 4151, and the Circinus Galaxy), some information regarding the spatial distribution is available as well. High-resolution images show that the ionized media in Seyfert 2 galaxies extend out to several hundred parsecs. The minimum spatial scale that can be resolved by the Chandra telescope corresponds to approximately 20 pc at the distance of the closest Seyfert 2 in the sample (the Circinus Galaxy – at ).
| Object name | RGSa | HETGa | LETGa |
|---|---|---|---|
| NGC 1068 | |||
| Mrk 3 | |||
| Circinus | |||
| NGC 4151 | |||
| NGC 4945 | |||
| NGC 4507 |
a the observation exists and the results are already
published; the observation exists but the results are not
yet in press at the time of writing (June 2002); observation
does not exist at the time of writing
b The EPIC data of a 24 ksec XMM-Newton observation is presented in
Schurch, Roberts, & Warwick (2002), but the RGS data have not yet been published.
3 Spectroscopic Diagnostics and the Observables
In this section, we discuss some of the spectroscopic diagnostics useful for analyzing and interpreting high-resolution Seyfert 1 and 2 spectra.
3.1 Seyfert 1
Most of the spectroscopic features observed in Seyfert 1 galaxies are absorption features that are produced through either photoexcitation (bound-bound) or photoionization (bound-free) of ions by the background continuum. From an atomic physics point of view, absorption spectroscopy is relatively simple compared to emission spectroscopy since, in most practical cases, it only requires the knowledge of transition wavelengths, oscillator strengths, and radiative decay rates of resonance transitions, all of which are relatively easy to calculate. Accurate laboratory wavelength measurements for the strongest lines are also available for most important ions.
One of the unique characteristics of the X-ray band is that absorption lines of most H-like and He-like ions can be detected up to the series limit. In an optically thin case, the absorption line equivalent width () ratios correspond to their oscillator strength ratios. As the column density increases, the Ly (or He; ) line saturate first, then the Ly (and He; ) line, and so forth. At a much higher column density, continuum absorption start to become important. Therefore, by measuring the of multiple lines and using the curve-of-growth method, the X-ray spectrum is capable of probing an extremely wide range in column densities and turbulent velocities simultaneously.
Velocity shifts can also be measured with high-resolution spectrometers. With the high energy transmission gratings onboard Chandra, for example, velocity shifts as low as can be measured for single isolated lines. When multiple lines from a single ionic species are present, velocities can be constrained to higher accuracy.
In practice, the thermal state of the irradiated medium is very difficult to discern from a Seyfert 1 spectrum. First of all, an absorption spectrum is completely insensitive to the dominant excitation/ionization mechanism that maintain the observed level of ionization. Although it is true that photoionization/photoexcitation contribute to some level in populating the excited states of ions (because we see it), there may also be a large thermal heat source, which could dominate the total energy budget. Another reason is that the spectral signatures of photoionization-dominated plasma (e.g., narrow radiative recombination continua – RRC – and strong forbidden lines relative to resonance lines in He-like ions) are difficult to discern in the presence of a bright underlying continuum, especially when absorption lines are also superimposed. In at least one source for which an extremely high signal-to-noise spectrum is available (NGC 3783 – Kaspi et al. 2002), however, there are clear detections of a number of RRC from different ions, thereby demonstrating the dominance of photoionization over collisional ionization.
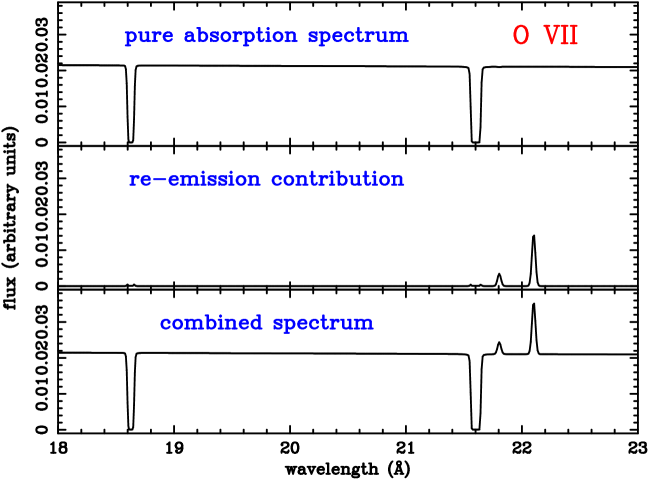
The covering fraction can also be estimated by measuring the relative amount of absorption and emission observed in a given ion. A model absorption spectrum of O VII at a column density of is shown in the top panel of Figure 2. The two absorption lines at Å and Å are He and transitions, respectively. The middle panel shows the amount of re-emitted line emission that escapes a uniformly-filled ionization cone with a covering fraction of . The forbidden line at Å is produced solely through recombination cascades, and, in addition, almost always escapes the nebula because its oscillator strength is essentially zero. Therefore, by measuring the absorption column density and the forbidden line intensity, one can estimate the total covering fraction of the absorbing medium.
| Parameter | Measurement Method |
|---|---|
| X-ray luminosity () | – direct measurement of continuum brightness |
| ion column density ()a | – absorption line equivalent widths, and their ratios; curve-of-growth analysis |
| turbulent velocity width ()a | – absorption line equivalent widths, and their ratios; curve-of-growth analysis |
| – line profile analysis of individual lines or by stacking (requires high signal) | |
| covering fraction () | – comparison of emission line intensities and absorption column densities |
| line of sight velocity () | – direct measurement of individual absorption line centroids or by stacking |
aThese two parameters are somewhat coupled. See text for details.
| Parameter | Measurement Method |
|---|---|
| X-ray luminosity () | – direct measurement is possible if the intervening medium is Thomson thin |
| effective X-ray luminosity ()a | – emission line intensities |
| ion column density ()a | – relative line intensities; curve-of-growth analysis |
| average turbulent velocity width ()a | – relative line intensities; curve-of-growth analysis |
| average bulk velocity field () | – direct measurement of individual absorption line centroids or by stacking |
| size of ionized region () | – direct measurement of spatial extent |
aThese parameters are somewhat coupled. See text for details.
In addition to valence shell transitions of H-like and He-like ions and L-shell iron, the X-ray band is capable of probing material of lower charge states through inner-shell absorption spectroscopy. For example, an unresolved transition array (UTA) of inner-shell transitions of M-shell iron (Fe I – Fe XVI) lie in the X-ray band between Å and 17.5 Å. These features have been clearly detected in at least two objects – an infrared quasar IRAS 13349+2348 (Sako et al. 2001) and a Seyfert 1 galaxy NGC 3783 (Kaspi et al. 2001) – as well as in the laboratory (Chenais-Popovics et al. 2000). Theoretical calculations of wavelengths and transition probabilities are presented in Behar et al. (2001).
3.2 Seyfert 2


Most of the features in the spectra of Seyfert 2 galaxies are produced through cascades following recombination and photoexcitation, which are inverse processes of those that produce absorption features in Seyfert 1 spectra.
As discussed in Kinkhabwala et al. (2002a), careful measurements of emission line ratios provide simultaneous constraints on the column density and turbulent velocity, as in the case of Seyfert 1. The method is analogous to the curve-of-growth method used in absorption spectroscopy, where the column density – turbulent velocity degeneracy can be broken by measuring absorption equivalent widths of multiple lines from the same ionic species with different oscillator strengths and/or by measuring the depth of the photoelectric edge in cases where the column density is sufficiently high.
When the direct view to the central continuum source is blocked by an obscuring medium, as in the case of Seyfert 2 galaxies, these processes produce emission lines. By computing photoionization and photoexcitation rates self-consistently, emission line intensities resulting from recombination cascades and cascades following photoexcitation can be calculated. The predicted total emission line intensity ratios can then be compared with the data to yield column density and velocity width measurements.
In H- and He-like ions, for example, approximately half of the total oscillator strength is in the lines and the other half in the continuum. This means that, in the optically thin limit, half of the total number of photons absorbed by the ion result in photoexcitations, while the other half result in photoionizations. However, since the absorption cross section of strong resonance lines are several orders of magnitude larger than that of the continuum, they saturate at much lower column densities. For example, the Ly and He lines saturate at a column of and the continuum edge saturates at . This is illustrated in Figure 3, where we plot O VII model spectra at three different column densities. At a low column density (top panel), the intensity ratios of the resonance line series are roughly equal to their oscillator strength ratios. As the column density is increased, the lines saturate while the continuum is still optically thin. Recombination line intensities increase roughly linearly with column density, while the photoexcitation intensities of the saturated lines increase only logarithmically (see also Behar et al. 2002). It is important to note that the He-like triplet line ratios at intermediate column densities look very similar to those in collisional ionization equilibrium, and need to be handled with caution. Measurements of the higher order line intensities and the detection of the RRC provide a more robust diagnostic for distinguishing the dominant emission mechanism (Kinkhabwala et al. 2002a).
Similar diagnostics are possible with iron L ions (Fe XVII – Fe XXIV) as well. In Fe XVII, for example, the lowest lying level above the ground state produces the strongest recombination line at Å(Liedahl et al. 1990). This transition has an extremely low oscillator strength. The transition at Å is a strong resonance line and is efficiently excited via photoexcitation (or collisional excitation). The and lines are analogous to the forbidden and resonance lines in He-like ions, respectively, and their line intensity ratio, therefore, provides constraints on the column density of Fe XVII. As in the He-like triplet, however, the line ratio alone cannot be used to determine the emission mechanism unambiguously, but careful modeling/measurements of the weak lines provide robust discrimination. The identification of an elaborate set of spectral diagnostics with iron L ions is in progress, and will be presented in Gu (2002) and Kinkhabwala et al. (2002b).
Since the amount of line emission depends on the amount of reprocessed continuum radiation, the observed line intensities provide a measure of the X-ray continuum luminosity intercepted by the absorbing medium; i.e., the quantity , where is the covering fraction and is the X-ray luminosity. In principle, careful measurements of line ratios can be used to infer the continuum shape as well, since photoexcitation line intensities are directly proportional to the local monochromatic continuum intensity. This is, however, difficult in practice because the exact absorption column density is usually not known and radiative transfer effects may alter the model line ratios.
Direct temperature estimates are also possible in Seyfert 2 spectra by measuring the width of the RRC. The RRC of C V and Si XIV are in isolated regions of the spectrum, while those of O VII and O VIII suffer from severe blending with several iron L lines. Most of the other RRC lie close to bright emission lines and may sometimes be difficult to measure the temperature with a spectrum of moderate statistical quality. The temperature of the H-like and He-like CNO emission region in NGC 1068 is measured to be (Kinkhabwala et al. 2002a).
Inner-shell absorption lines observed in Seyfert 1 galaxies are extremely difficult to detect in re-emission, since the upper levels of many of these transitions are strongly autoionizing (i.e., low fluorescent yield). A well-known exception is the ubiquitous iron K line complex near , which has an average fluorescent yield of . Fluorescent line emission from other mid- elements (Si, S, Ar, and Ca) has also been observed in several sources. Inner-shell emission lines from low- elements (C, N, O, and Ne) are probably too weak to be detected because of the dependence of the fluorescent yields.
There is one important caveat in interpreting the measured column densities from a Seyfert 2 spectrum. As mentioned above, the emission line intensities are proportional to the quantity . The line intensities are also monotonic functions of the column density, but the dependence is non-linear. Therefore, in reality, the resulting spectrum is a complicated weighted sum over the entire ionized medium. This implies that a measured ionic column density roughly corresponds to where the quantity is a maximum; regions of small covering fraction and/or column density do not contribute significantly to the total X-ray line intensity. This may not be a serious problem, since one can argue that those regions of extremely low column are of no particular interest. It could, however, be detrimental for comparative studies with Seyfert 1, since absorption column densities are based on a single, unrepresantitive, line of of sight.
4 Comparisons and Future Work
Although a detailed uniform spectral analysis of the Seyfert 2 sample is in progress (Kinkhabwala et al. 2002c), rough comparisons of the derived physical parameters with Seyfert 1 galaxies can already be made.
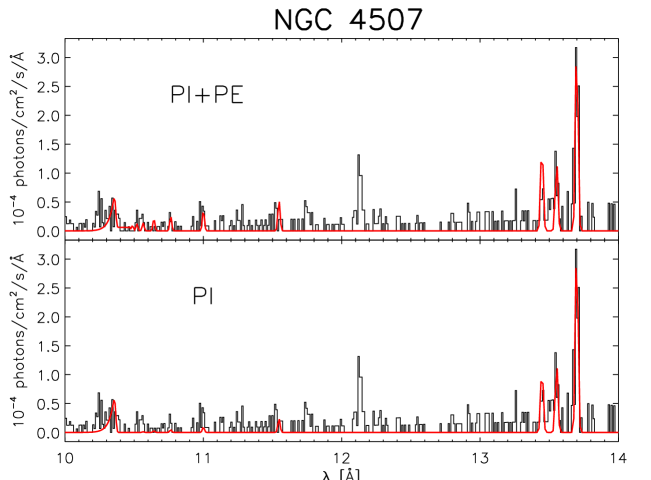
NGC 3783 harbors, by far, the largest column density warm absorber observed to date. From several Chandra HETG observations, the total equivalent hydrogen column density in this object is estimated to be (Kaspi et al. 2002). Among the sources in the Seyfert 2 sample, NGC 4507 appears to have a warm absorber with comparable column density. The observed Ne IX triplet line ratios (see Figure 6) imply an ionic column density of or an equivalent hydrogen column density of assuming solar abundances.
An example of an object with a small, but a detectable amount of absorption is Mrk 509, where we estimate the column density to be (Pounds et al. 2001). This is similar to the column density estimated by Sako et al. (2000b) for the Seyfert 2 galaxy Mrk 3 (see, also Figure 5). A detailed investigation and comparisons of the sources listed in Table 3 will be presented in Kinkhabwala et al. (2002c).
There are numerous other Seyfert 1 objects with observed column densities that are much lower than . These objects are much more difficult to detect from the Seyfert 2 view, since, in these cases, the amount of reprocessed continuum radiation is small. Deep exposures of X-ray faint Seyfert 2 galaxies may allow us to place constraints on the column densities and to increase the parameter space in which detailed comparisons of Seyfert 1 and 2 spectra are possible.
Acknowledgements.
MS and MFG were partially supported by NASA through Chandra Postdoctoral Fellowship Award Number PF1-20016 and PF1-10014, respectively, issued by the Chandra X-ray Observatory Center, which is operated by the Smithsonian Astrophysical Observatory for and behalf of NASA under contract NAS8-39073. AK acknowledges support from an NSF Graduate Research Fellowship and NASA GSRP fellowship. The Columbia University team is supported by NASA through the XMM-Newton mission support and data analysis. We gratefully acknowledge the permission by the Springer Verlag to use their A&A LaTeX document class macro.References
- Antonucci & Miller (1985) Antonucci, R. R. J., & Miller, J. S. 1985, ApJ, 297, 621
- Antonucci (1993) Antonucci, R. R. J. 1993, ARA&A, 31, 473
- Behar et al. (2001) Behar, E., Sako, M., & Kahn, S. M. 2001, ApJ, 563, 497
- Behar et al. (2002) Behar, E., Kinkhabwala, A., Sako, M., Paerels, F., Kahn, S. M., Brinkman, A. C., Kaastra, J., & van der Meer, R. 2002, in ASP Conf. Ser. 255: Mass Outflow in Active Galactic Nuclei: New Perspectives, ed. D. M. Crenshaw, S. B. Kraemer, & I. M. George (San Francisco: ASP), p. 43
- Brinkman et al. (2002a) Brinkman, A. C., Kaastra, J. S., van der Meer, R. L. J., Kinkhabwala, A., Behar, E., Paerels, F., Kahn, S. M., & Sako, M. 2002, A&A, in press
- Brinkman et al. (2002b) Brinkman, A. C., et al. 2002, this proceedings
- Chenais-Popovics et al. (2000) Chenais-Popovics, C., Merdji, H., Missalla, T., Gilleron, F., Gauthier, J., Blenski, T., Perrot, F., Klapisch, M., Bauche-Arnoult, C., Bauche, J., Bachelier, A., & Eidmann, K. 2001, ApJS, 127, 275
- Collinge et al. (2001) Collinge, M. J., Brandt, W. N., Kaspi, S., Crenshaw, D. M., Elvis, M., Kraemer, S. B., Reynolds, C. S., Sambruna, R. M., Will, B. J. 2001, ApJ, 557, 2
- Griffiths et al. (1998) Griffiths, R. G., Warwick, R. S., Georgantopoulos, I., Done, C., & Smith, D. A. 1998, MNRAS, 298, 1159
- Gu (2002) Gu, M. F. 2002, in preparation
- Iwasawa et al. (1994) Iwasawa, K., Yaqoob, T., Awaki, H., & Ogasaka, Y. 1994, PASJ, 46, L167
- Kaastra et al. (2000) Kaastra, J. S., Mewe, R., Liedahl, D. A., Komossa, S., & Brinkman, A. C. 2000, A&A, 354, L83
- Kaspi et al. (2000) Kaspi, S., Brandt, W. N., Netzer, H., Sambruna, R., Chartas, G., Garmire, G., & Nousek, J. A. 2000, ApJ, 535, L17
- Kaspi et al. (2001) Kaspi, S., Brandt, W. N., Netzer, H., George, I. M., Chartas, G., Behar, E., Sambruna, R., Garmire, G., & Nousek, J. A. 2001, ApJ, 554, 216
- Kaspi et al. (2002) Kaspi, S., Brandt, W. N., George, I. M., Netzer, H., Crenshaw, D. M., Gabel, J. R., Hamann, F. W., Kaiser, M. E., Koratkar, A., Kraemer, B., Kriss, G. A., Mathur, S., Mushotzky, R. F., Nandra, K., Peterson, B. M., Shields, J. C., Turner, T. J., & Zheng, W. 2002, ApJS, in press
- Kinkhabwala et al. (2002a) Kinkhabwala, A., Sako, M., Behar, E., Kahn, S. M., Paerels, F., Brinkman, A. C., Kaastra, A. C., Gu, M. F., & Liedahl, D. A. 2002a, ApJ, in press
- Kinkhabwala et al. (2002b) Kinkhabwala, A., et al. 2002b, in preparation
- Kinkhabwala et al. (2002c) Kinkhabwala, A., et al. 2002c, in preparation
- Liedahl et al. (1990) Liedahl, D. A., Kahn, S. M., Osterheld, A. L., & Goldstein, W. H. 1990, ApJ, 350, 37
- Miller & Antonucci (1983) Miller, J. S., & Antonucci, R. R. J. 1983, ApJ, 271, 7
- Miller & Goodrich (1990) Miller, J. S., & Goodrich, R. W. 1990, ApJ, 355, 456
- Netzer & Turner (1997) Netzer, H., & Turner, T. J. 1997, ApJ, 488, 694
- Ogle et al. (2000) Ogle, P. M., Marshall, H. L., Lee, J. C., Canizares, C. R. 2000, ApJ, 545, L81
- Ogle et al. (2002a) Ogle, P. M., et al. 2002, in preparation
- Ogle et al. (2002b) Ogle, P. M., et al. 2002, this proceedings
- Pounds et al. (2001) Pounds, K., Reeves, J., O’Brien, P., Turner, M., & Nayakshin, S. 2001, ApJ, 559, 181
- Sako et al. (2000a) Sako, M., Kahn, S. M., Paerels, F., & Liedahl, D. A. 2000a, ApJ, 542, 648
- Sako et al. (2000b) Sako, M., Kahn, S. M., Paerels, F., & Liedahl, D. A. 2000b, ApJ, 543, L115
- Sako et al. (2001) Sako, M., Kahn, S. M., Behar, E., Kaastra, J. S., Brinkman, A. C., Boller, Th., Puchnarewicz, E. M., Starling, R., & Liedahl, D. A., Clavel, J., & Santos-Lleo, M. 2001, A&A, 365, 168
- Sambruna et al. (2001) Sambruna, R. M., Netzer, H., Kaspi, S., Brandt, W. N., Chartas, G., Garmire, G. P., Nousek, J. A., & Weaver, K. A. 2001, ApJ, 546, L13
- Schurch, Roberts, & Warwick (2002) Schurch, N. J., Roberts, T. P., & Warwick, R. S. 2002, MNRAS, in press
- Turner et al. (1997) Turner, T. J., George, I. M., Nandra, K., & Mushotzky, R. F. 1997, ApJ, 488, 164
- Ueno et al. (1994) Ueno, S., Mushotzky, R. F., Koyama, K., Iwasawa, K., Awaki, H., & Hayashi, I. 1994, PASJ, 46, L71