On-Axis Orphan Afterglows
Abstract
In many GRB inner engine models the highly relativistic GRB jets are engulfed by slower moving matter. This could result in different beaming for the prompt -ray emission and for the lower energy afterglow. In this case we should expect that some observer will see on-axis orphan afterglows: X-ray, optical and radio afterglows within the initial relativistic ejecta with no preceding GRB; The prompt -ray emission is pointing elsewhere. We show that the observations of the WFC on BeppoSAX constrain with high certainty the prompt X-ray beaming factor to be less than twice the prompt -ray beaming. The results of Ariel 5 are consistent with this interpretation. The RASS from ROTSE and HEAO-1 constrain the X-ray beaming factor at 400 and 20 minutes after the burst respectively to be comparable and certainly not much larger than the -ray beaming factor. There is no direct limit on the optical beaming. However, we show that observations of several months with existing hardware could result in a useful limit on the optical beaming factor of GRB afterglows.
keywords:
Gamma-Ray Bursts, ††thanks: E-mail: udini@phys.huji.ac.il ††thanks: E-mail: tsvi@phys.huji.ac.il
1 Introduction
The realization that Gamma-Ray bursts (GRBs) are beamed changed our understanding of the phenomenon in many ways. The first and most dramatic is the drastic revision of the bursts’ energy. The enormous ergs, turned out, after beaming corrections, to be a “modest” ergs. Naturally the actual GRB rate increased by the inverse factor. Even more surprising was the discovery (Frail et al., 01; Panaitescu & Kumar, 01; Piran et al., 01) of the rather narrow total energy distribution. Currently, the evidence for beaming is the ’jet break’ in the afterglow’s light curve. The jet angle is determined from the time of the break in the light curve, that is interpreted as a jet break (Sari, Piran & Halpern, 99). However, even if this interpretation is correct it corresponds to the jet opening angle when most of the emission is in the optical or IR bands. There is no direct evidence for the beaming factor during the GRB phase, or even during the early afterglow phase when the emission is mostly in X-rays. It is not clear whether the -ray, X-ray, optical and radio emissions have similar initial (before the jet spreading) beaming factors. There are good physical reasons to question whether there is a common beaming factor in different wavelengths. Different parts of the spectrum dominate the emission at different times and correspond to different physical conditions within the relativistic flow. It is possible, and some will argue even likely, that emission in different energy bands will have different beaming factors.
The origin of the problem in determining the different beaming lies in two related relativistic phenomena, casual connection and relativistic beaming. Regions more than apart within the relativistic flow are casually disconnected. Additionally, the light emitted from a relativistic source moving with a Lorentz factor is beamed into an angle of along the line of motion. The first phenomenon implies that regions that are more than apart could have different physical conditions. The second one implies that an observer could see only one such region at a time and won’t know about the other. Both phenomena imply that the -rays, that are emitted when , could have come from a jet with an opening angle of 1/100 and the observer would have no way of telling the difference from a spherical source. The later X-ray (as well as optical and radio) afterglow is emitted from a slower moving material with a lower Lorentz factor. Hence, the X-ray beam could be larger than the -rays beam. Similarly the region observed by a given observer is larger as well (see fig 1).
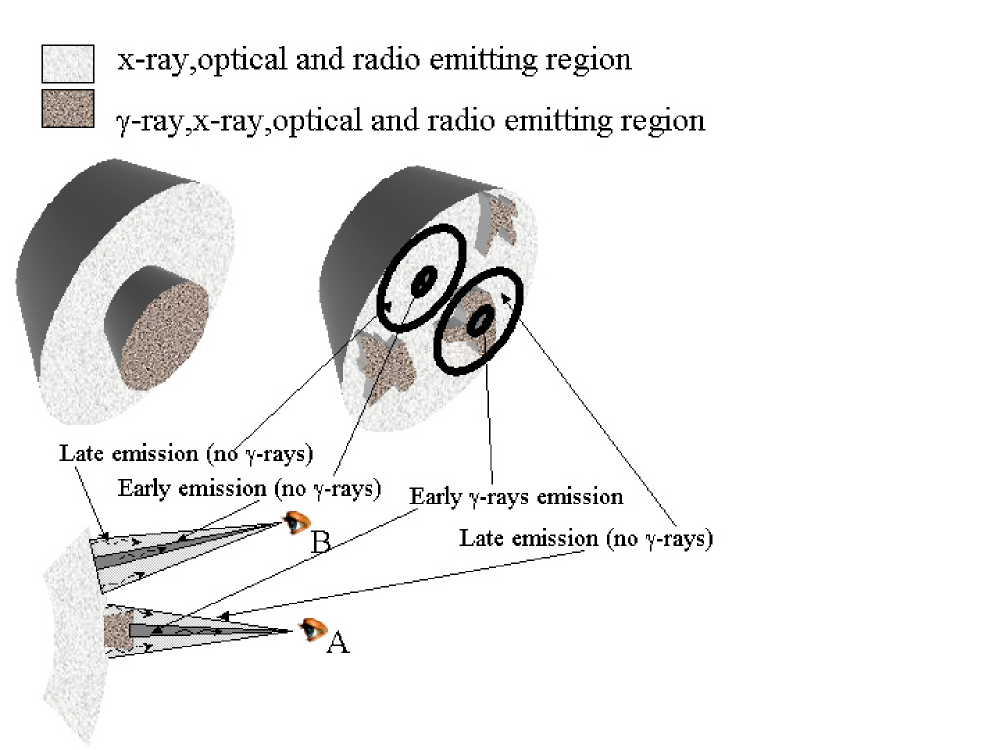
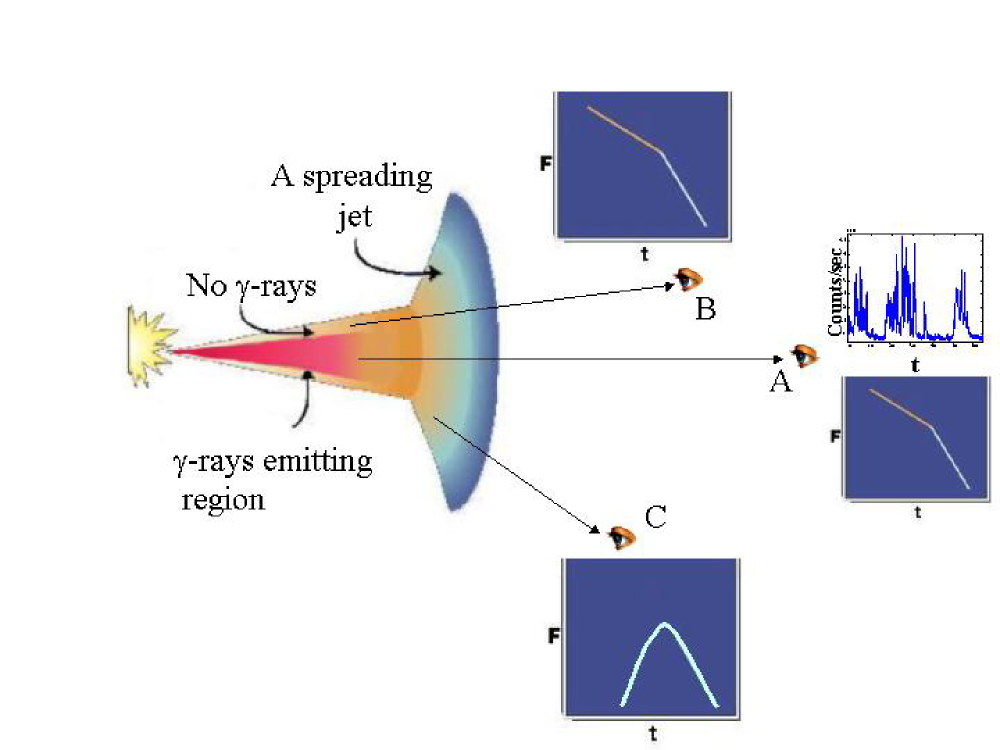
These relativistic effects allow configurations with narrow -ray beams, wider X-ray and even wider optical and radio beams. This will produce orphan afterglows - events in which X-ray, optical and radio afterglow is observed while the prompt GRB is pointing elsewhere. There are two types of orphan afterglows: (i) On-axis orphan afterglows (which we introduce and discussed here, see fig. 1) are observed within the initial relativistic jet by observers that miss the narrower -ray beam. These afterglows follow the light curves of the standard afterglows (observed following regular GRBs). (ii) Off-axis orphan afterglows (see fig. 2) are the “traditional” orphan afterglows (Rohads, 97; Perna & loeb, 98; Dalal, Griest & Pruet 2001, Granot et al. 2002, Nakar, Piran & Granot 2002, Totani & Panaitescu 2002) that are observed outside the initial jet. Off-axis orphan afterglows can be seen only after the jet break when the jet expands sideway. Their light curve rises initially reaching a maximal flux (that depends on the observing angle) and then decays following the post-jet-break light curves of a standard GRB afterglow. To study the initial opening angles of the relativistic jets we must consider the on-axis orphan afterglows.
A direct way to determine the beaming ratios is to compare the rates of detection of transients in different energy bands. However, several confusing factors should be taken into account in such a comparison. First, detectors in different energy bands have different relative thresholds. These should be calibrated using the current GRB and afterglow observations. Second, there are numerous background transients and we have to identify specific transients as afterglows. We show in section 3 that this problem may not be severe for the X-ray band. Even assuming that all observed transients (after some basic filtering) are afterglows we find a tight constraint on the ratio of X-ray to -ray beaming. Optical background transients (e.g. AGNs, stellar flares etc.) are more numerous. Here, we should use the temporal and spectral observations of the afterglows, observed so far, as templates for identification.
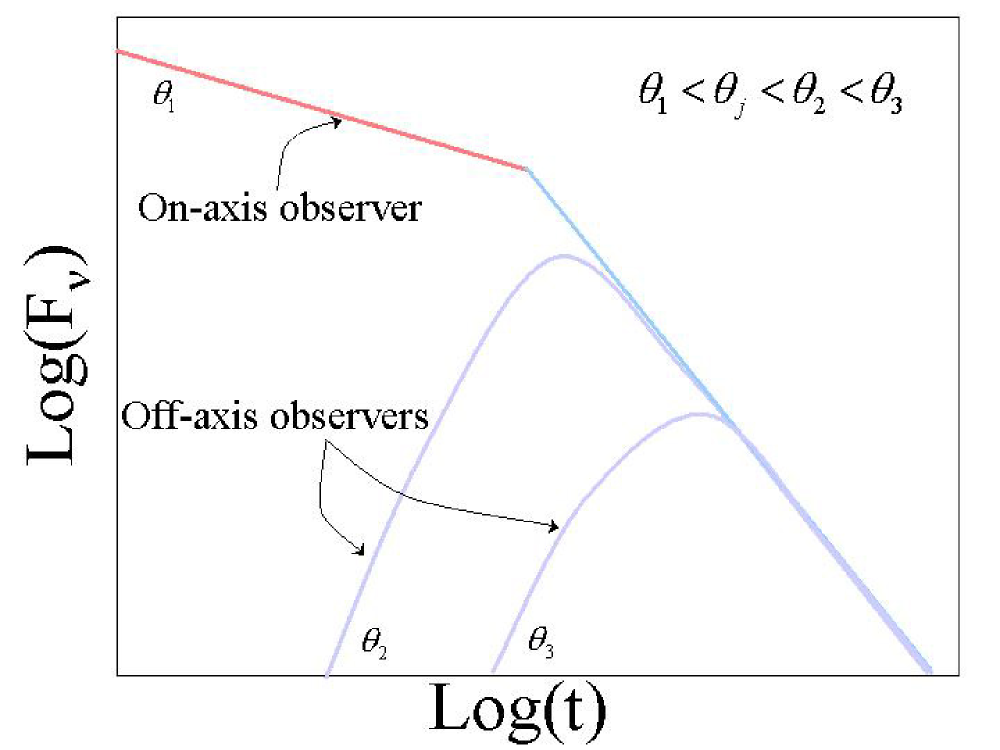
A third problem that is unique to afterglows is the possible confusion between the optical and radio111The current X-ray observations are before the jet break, when only on-axis afterglows can be seen. on-axis and off-axis orphan afterglows. The overall light curves of on-axis and off-axis orphan afterglows are significantly different (see Fig 3). However, the post-jet-break light curves of both kinds of orphan afterglows are similar (Granot et al. 2002). To avoid confusion we must catch the afterglow early before the jet break. This can be done by an appropriate choice of the magnitude of an optical survey. While off-axis afterglows are more numerous, most off-axis orphan afterglows won’t be detected in a shallow survey and the on-axis orphan afterglows would govern such a sample. In the radio, the transients would be generally detected after the jet-break and off-axis orphan afterglows would always govern the sample. An estimate of the rate of transients in a radio survey could not constrain the initial radio beaming, but rather it would provide a measure of the total rate of relativistic ejection events (Perna & Loeb, 98; Levinson et al.,2002).
Our first goal in this paper is to estimate the X-ray to -ray beaming factors using the observed limits on X-ray transients. We show (in section 3) that while there is a weak indication that the -rays are beamed by a factor of a few relative to the X-rays, even current observations rule out the possibility that the -rays are significantly (more than a factor of ten) beamed than the X-rays. There is no available data on relevant optical transients. In a second part of the paper (section 4) we describe possible optical surveys that, with existing hardware, could limit the optical beaming within several months of observation. We also discuss (in section 5) the implications of observations of radio transients. We summarize our results in section 6.
The observed GRB rate is a basic reference to which we compare the rate of other transients. So far all the detected afterglows are of long bursts (duration longer than 2sec). We exclude, therefore, short GRBs when estimating the GRB rate. We take the (all sky) rate of long GRBs as 600 per year (Fishman & Meegan, 1995).
2 Afterglow Theory
We summarize here the relevant issues from afterglow theory. According to the standard internal-external fireball model internal dissipation (shocks) within ultra relativistic () wind produces the prompt GRB. A fraction of the prompt X-ray emission arise from this shocks as well. An external-shock between the wind and the surrounding matter produces the afterglow. Initially X-rays dominate the afterglow emission, contributing to the prompt X-ray emission on time scales of minutes and dominating the afterglow on a timescale of hours. As the matter slows down the peak energy of the emission shifts downwards. The X-rays are followed by optical and IR on a time scale of days, and on a scale of weeks the dominant emission is in the radio.
The afterglow emission is well described by a simple model of a relativistic blast wave propagating into an external medium and emitting via synchrotron radiation. A relativistic spherical blast wave with energy, E, propagating in an ambient medium with a density, n, becomes, after a short radiative phase, adiabatic and it follows the Blandford & McKee (1976) self similar solution. The Lorentz factor of the bulk motion is:
| (1) |
where is the energy per solid angle at the adiabatic phase, t is the observer time and z is the redshift. For a slow cooling synchrotron radiation the flux (above the cooling frequency) scale with time and energy as (Sari, Piran & Narayan 1997):
| (2) |
where is the electrons’ energy distribution index. After several months the blast wave becomes sub relativistic and then it follows the Sedov-Tylor self-similar solution.
As noted earlier, the inhomogeneity scale in the moving ejecta could be at most . Moreover, an observer can see only regions with this () angular size. As the blast wave decelerates decreases, the homogeneous regions grow and an observer detects emission from larger regions. Therefore, the fluctuations between observers viewing, within the initial jet, the same burst from different angles are expected to be largest during the -rays phase, decrease in the X-rays and eventually diminish in the optical and radio. This is the essence of the patchy shell model (Kumar & Piran, 00) that suggests that the large variations in the observed -rays fluxes (relative to the much smaller variations in the X-ray fluxes) arise partially from this phenomenon.
A jet is an extreme case of inhomogeneity. At the sides of the jet the density drops sharply. As long as the jet angle, , is much larger than , this inhomogeneity does not affect the jet’s core and it behaves as a part of a spherical blast wave with a Lorentz factor and energy . As drops to the jet spreads sideway (Rhoads 1997). At this stage, an observer whose line of sight was inside of the initial jet would see a “jet-break” in the light curve. An observer whose line of sight was slightly outside of the initial jet would observe at this stage a rising flux (see figures 2 and 3). The flux peaks when the expanding jet gets into the observer line of sight and then it would decay similarly to the on-axis light curve (Granot et al, 2002).
Inhomogeneity within the jet could be irregular and random, as would be the case in a turbulent flow. Small scale inhomogeneities within the jet (e.g. hot spots) could cause a modulation of the observed -ray flux relative to the X-rays and the optical (see fig 1). As the jet slows down the causally connected regions, that are of order , increase and the jet becomes smoother. At the same time as the jet slows down the typical emission energy decreases. This will produce different beaming factors for the different energy bands with wider beams at lower energies.
Alternatively, Rossi, Lazzati and Rees (2002) consider a smoothly varying jet with , and . As long as the behavior of a part in the jet at an angle is similar to a the behavior of a sphere with a constant . When , the jet at spreads outwards. Rossi et. al (2002) show that before the spreading, the emission observed at an angle is dominated by the part of the jet that is along the line of sight. Therefore, before the sideways spreading an observer at will see a similar light curve to an observer of a homogeneous jet with . The beaming at different wavelengths could be different. As the physical conditions vary with it is possible that an emission at some energy bands won’t be produced throughout the whole jet. For example, if the Lorentz factor at certain angles is too low the region may not emit -rays but would still produce X-ray and optical emission (Rossi et. al. 2002).
3 X-ray Transients
The GRB X-ray emission is divided to two: prompt and afterglow (or even three: prompt, early afterglow and late afterglow) components. Late X-ray afterglow emission was detected from almost all BeppoSAX bursts during the first hours of the afterglow with:
| (3) |
where . The X-ray fluxes 11 hours after the burst are narrowly clustered (within a factor of ) around this average value (Piran et. al. 01). Prompt X-ray emission at the level of ergs/sec/cm2 accompanied the GRBs themselves. The prompt X-ray emission can be divided to two parts: the low energy tail of the -ray signal and a softer and smoother later component that looks like the beginning of the afterglow phase (Piro, 00). Within the internal-external shocks model these two components can be interpreted as emission from internal and external shocks respectively.
Before considering X-ray surveys we examine some general arguments concerning the detection rate and the implied event rate. Three time scales arise when the number of detected bursters in a survey is interpreted as a burster rate: The interval between successive observations of the same field, , the duration of each observation, , and the time that the transient is above the survey’s threshold, . Consider a survey with a sensitivity, , that covers a field of view, , for times in intervals of . The burster flux, , decays with time with . The expected number of events in the survey is:
| (4) |
where is the true burster’s rate (events per time unit per solid angle).
Greiner et. al. (1999) searched the ROSAT all sky survey (RASS) for afterglow candidates at a limiting flux of ergs/sec/cm2. This limit corresponds to the afterglow flux observed several hours after the burst when, according to the standard afterglow model, . The sky coverage of RASS is 76435 square degree days, and 80% of the afterglows in the field of view are expected to be detected. The observed long GRB rate, 600 per year on the whole sky, implies 3 expected events in the RASS field (assuming only long GRBs have afterglow). Greiner et. al. (1999) find at most 23 GRB afterglow candidates. This suggests at first a ratio of 8 in the beaming factors. However, an examination of the optical emission of six randomly chosen transients (from this sample of 23) revealed that all six are flaring stars. Greiner et. al. (1999) conclude that the majority of the 23 sources are not GRB afterglows. This suggests a moderate difference (if any) in the beaming between late (several hours) X-ray afterglow and -ray emission.
Grindlay (1999) analyzed the results of the ARIEL 5 X-ray transients. The survey’s sensitivity is ergs/sec/cm2 and the data is collected at time bins of 100min (min). The extrapolation of BeppoSAX’s observations (eq. 3) suggests that the flux level of is reached min after the burst. Therefore it is unlikely that an afterglow was detected in more than one time bin. Moreover, since each time bin is the sum of the emission during a period of 100min, the triggered time bin includes the prompt emission as well as the comparable or weaker initial afterglow. Therefore, the transients observed in this survey are governed by the prompt emission. Grindlay (1999) finds 13 candidates (9 of them detected only in a single time bin). This corresponds to a rate of 0.15 transients per day over the whole sky. This rate is consistent with the logN-logS relation in the BATSE catalog, assuming that the fluence in -rays is 5 times the fluence in X-rays (note that this kind of association with BATSE’s logN-logS is relevant only if the observed emission is governed by the prompt emission). This result suggests no difference in the beaming of the prompt X-ray and -ray emission. However it does not constrain the beaming of the late (lower ) X-ray emission.
| Survey | Sensitivity | Expected | Observed | Beaming | |||
| min | min | min | counts | counts | ratio | ||
| ROSAT | 400 | 3 | 17 | ||||
| HEAO-1 | 20 | 2.5 | 4 | ||||
| Ariel 5 | prompt | 10-20 | 13 | ||||
| BeppoSax WFC | - | - | prompt | 66 |
(*)-This flux is averaged over 100min. The minimal total observed energy in 100min needed for detection is ergs/cm2.
(**)-The expected rate is given according to the observed number of GRBs by the WFCs. The observed rate includes the XRFs.
(***) These upper limits on the ratio of X-ray to -ray beaming are at 5% confidence level. The limits were obtained assuming that all observed unidentified transients are related to GRBs. This last assumption is clearly a gross over estimate for the RASS survey.
Grindlay (1999) also analyzed the results of HEAO-1 survey (Ambruster & Wood, 1986). HEAO-1 observe each source for sec in time intervals of min. The sensitivity of the survey, , corresponds to the observed X-ray fluxes min after the burst. Since the duration of the prompt emission is min it is more likely that an afterglow emission would be detected. With min and min only 1 out of any 1.75 afterglows would be detected. Therefore, we interpret the four unidentified (out of 10) detected transients as afterglow candidates (the other 6 have another clear identification). Ambruster & Wood (1986) deduce from the 10 observed transients, assuming that the duration of the transients min, a rate of 1500yr-1 transients in the whole sky. This rate corresponds to yr-1 X-ray afterglow transients over the whole sky. This rate suggests again a very modest difference between the X-ray and -ray beaming. One of the 4 candidates in the HEAO-1 survey shows variability on the 10sec observation time scale, a very hard spectrum and a flux of ergs/sec/cm2. This suggests that the transient is probably a prompt emission. This interpretation suggests a large event rate. As a prompt emission takes 1min () the expected rate for a single detection is yr-1 over the whole sky, seven and a half times the long GRB rate and five times the overall GRB rate. However, the identification as prompt emission is uncertain and the statistical fluctuation with a single event could be large.
BeppoSAX observed the early (first sec) X-ray emission with the WFCs and the late (1day) X-ray afterglow with the NFI. Almost in all cases when a prompt emission was observed in the GRBM, an X-ray afterglow was detected by the NFI as well (Piro, 00). The WFC is capable of detecting events of a few seconds at a level, ergs/sec/cm2, comparable to the prompt X-ray emission accompanying the GRB. For integration times of 100 sec, transients can be detected down to ergs/sec/cm2, allowing to track the the early afterglow for a few hundreds seconds. The WFCs detected X-ray counterparts of GRBs in 49 cases when the GRBM was triggered. In 39 cases the WFCs were triggered without GRBM triggering. The duration of 17 of these transients (out of the 39 transients), denoted X-ray flashes (XRFs), is comparable to the duration of the X-ray emission accompanying GRBs (Heise et al, 01). The peak fluxes of the XRFs are similar to the X-ray fluxes observed during GRBs in the WFCs (ergs/sec/cm2). The origin of XRFs is not clear.
In the context of this paper, we can adopt the working hypothesis that XRFs are prompt X-ray emission with no accompanying -ray emission (namely, they are associated with GRBs that have been pointing elsewhere). This assumption is not necessarily true. XRFs may be the early afterglow emission (but this is unlikely because they are rather variable while this early afterglow is expected to be smooth). Alternatively XRFs may be an unrelated phenomenon. Our working hypothesis results in an upper limit to the ratio of prompt X-ray emission to GRBs. If this interpretation of XRFs (or a fraction of them) is correct the prompt X-ray rate is comparable to the observed GRB rate. If we identify all XRFs as associated with GRBs we find that the ratio of beaming of X-ray to -rays is (at 5% confidence level) . If this association is incorrect than this ratio is just an upper limit. Overall, the WFCs’ observations imply that the beaming factors of the prompt -rays and the prompt early X-rays are comparable, up to a factor of two.
After a GRB localization BeppoSAX redirected its NFI to observe the late afterglow. There is a several (at least three) hours gap (the redirecting time) between the two observations. The NFI afterglow observations last for about a day, until the flux drops below the NFI’s sensitivity. The light curve during the X-ray afterglow is fitted well with a single power law. Remarkably the extrapolation of this power law to the early afterglow’s results in fluxes similar to those observed at that time by the WFCs (Piro, 00). According to the standard afterglow model is almost linear with (see eq. 2). The single power law decay of through the whole evolution implies that the effective is constant, or at least it varies regularly (as a power law in t) while the observed area varies by two orders of magnitude, from (0.01rad)2 after a minute to (0.1rad)2 after a day. This result suggests a regular structure and possibly a similar beaming of the late and early X-ray afterglows.
To summerize the X-ray results, BeppoSax and Ariel 5 provide a tight constrain on the prompt and early afterglow X-rays to -rays beaming ratio (not more than a factor of two). The HEAO 1 results constrain the beaming ratio of the intermediate (about 20min after the burst and a corresponding Lorentz factor of 30) afterglow to -rays to be smaller than 3. Finally, the RASS results constrain the beaming ratio of the late (several hours and a corresponding Lorentz factor of 10) X-ray afterglow to -rays to be smaller than 8 and probably much less. All these limits are relevant to on-axis orphan afterglows as at this early stage the X-ray fluxes from off-axis orphan afterglows would be much lower and could not be detected (see fig 3).
4 Optical Transients
There are no current deep searches that have systematically looked for (either on-axis or off-axis) optical orphan afterglow transients (see however, Vanden Berk et al., 2002 for a ongoing search using the SDSS). Note, however, that some useful upper limits might be obtained from Supernovae searches and from Near Earth Objects (NEO) searches. We describe, in this section, the characteristics of optical on-axis orphan afterglows and show that an orphan afterglow survey is feasible with current equipment.
Several problem arise when we turn to compare the rate of optical afterglow transients to the rate of GRBs. First there are numerous other transients that should be excluded. Second, not all well localized GRBs have a detectable optical counterpart (optical afterglow was observed only in 50% of the cases with good localization). Third, there may be confusion between on axis and off axis orphan afteglows. These problems suggest that it will be impossible to obtain an exact estimate of the optical orphan afterglow rate. But as we have seen in the X-ray case, for our purpose an upper limit on the rate could also be very useful.
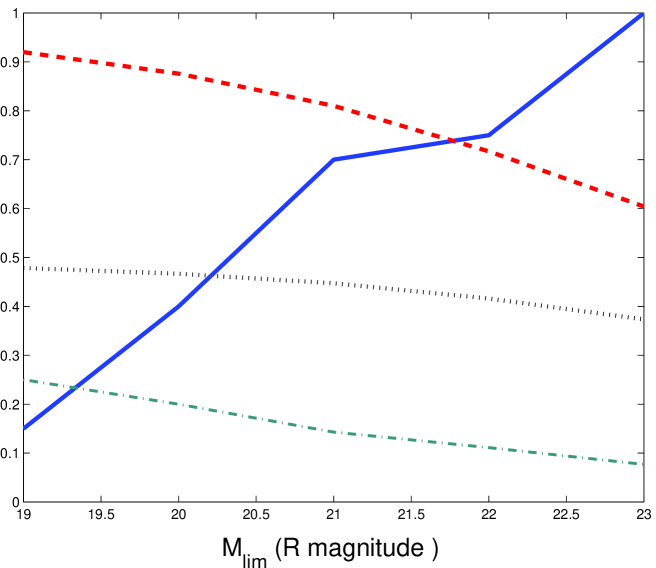
We ask what should be the depth and the covering area of an “on axis” afterglow survey. Clearly it should not be too shallow so most of the on-axis afterglows will be detected. It shouldn’t be unnecessarily deep as this would increase the rate of other background transients and will also include a large number of off-axis afterglows that will dominate the sample. The jet break time in most observed afterglows is day. At this stage the observed R magnitude is about 19th-23rd. Figure 4 depicts the cumulative fraction of afterglows (out of the observed ones) with R magnitude brighter than a limiting magnitude after one day. At this time only 15% of the observed afterglows, are brighter than R=19th mag while 70% of the observed afterglows are brighter than 21st mag. 40% of the afterglows were brighter than 21st mag after two days, enabling dual detection in a repeating survey night after night.
Figure 4 also depicts the expected ratio of on-axis afterglows to off-axis afterglows as a function of the observed magnitude (Nakar, Piran & Granot 2002; Totani & Panaitescu 2002). While different models give different ratios of off-axis to on-axis orphan afterglows, all show that at a 19th-21st limiting magnitude the rate of off-axis afterglows is at most comparable to the on-axis afterglow rate and it is most likely that the on-axis afterglows are the majority. Therefore, we conclude that the survey should have a minimal limiting magnitude of 19th. A preferred limit should be 21st, but not deeper.
We turn now to estimate the covering factor (area time) needed for meaningful results. This estimate can be discussed in terms of the general survey discussed in section 3 with , and with averaged over the current optical afterglow sample. Assuming that only half of the long bursts are followed by an observed optical counterpart, there is one optical afterglow associated with -ray emission every day. A 19th mag snapshot is expected to record afterglow transients associated with GRBs per square degree. This is a weighted average over the current observed afterglows that takes into account that each burst contributes to the detection probability according to the time it is above 19th R magnitude. Although only 15% of the bursts have 19th R magnitude a day after the burst, the average weighted detection fraction is 40%. A 21st mag snapshot is expects to record afterglow transients per square degree. Figure 4 depicts the fraction of afterglows with flux brighter than 19th, 20th and 21st mag as a function of time after the burst. We expect dual records of the same afterglow per square degree in two consecutive 21st mag snapshots of the same field 24 hours apart. Any detection of more than a factor of a few above these expected rates would indicate a different beaming of the optical emission and would have meaningful implications to our understanding of GRBs.
![[Uncaptioned image]](/html/astro-ph/0207400/assets/x5.png)
The cumulative fraction of optical afterglows with R magnitude greater than 21st (solid line), 20th (dashed line) and 19th (dotted line), magnitude as a function of time. The optical afterglows sample are the same afterglows as in figure 4
To avoid contamination by other transients the survey should include a follow up procedure that will establish that a given transient is a GRB afterglow. A critical decision is which transients should be followed. The number of transients at these magnitudes is unknown (e.g. Paczynski, 01), but they are probably too numerous to follow. A significant group of misleading sources could be flaring sources (stars or AGNs) with a steady flux lower than the survey sensitivity. Such sources could be discarded by performing the survey on a field observed by the SDSS (York et al., 2000) that shows all the steady sources up to 23rd R magnitude. Alternatively one can cover once the observed region with a deeper exposure, that could serve as a reference. Unless the flare is extremely bright the steady source would be seen in the deeper survey (e.g. SDSS) and could be automatically eliminated. The light curve templates of existing afterglows would provide another cut. 40% of the observed afterglows are brighter than 21st R magnitude two days after the burst. Therefore, a repeated observation of the same region after 24 hours should show the decaying source again with a lower flux (typically 1-2 magnitudes). This method could not be used in a 19th mag survey, for which only a single detection is expected for most afterglows. A repeated long survey of the same region would also be advantageous as we could learn the history of this field and eliminate repeated transients.
The SDSS (York, et al., 2002) is too deep and covers too small area for on-axis orphan afterglow search (see Nakar et al., 2002). An automated wide field survey could cover a field of view equal to the whole sky in several months. This should result in one to two optical afterglow transients associated with GRBs. The Super-LOTIS http://compton.as.arizona.edu/LOTIS/super.html, for example, covers in one minute of exposure 0.7 square degree in 21st magnitude. Therefore a few months of continuous Super LOTIS observation could constrain the beaming difference up to one order of magnitude. NEOs searches scan the whole sky at th magnitudes. The LONEOS http://asteroid.lowell.edu/asteroid/loneos/loneos1.html covers 20000 square degrees in one month at V=19.3. In 5 months of observations one afterglow associated with GRB should appear in the records. An order of magnitude constraint could be obtained within several weeks. Note that the filtering of transients in this survey might be more difficult as this survey does not observe the same field night after night, morever it does not observed the field already covered by the SDSS. Both surveys would needs a dedicated follow up telescope that will observe the spectrum and will follow the light curves of the transients in order to confirm a detection of a transient as an afterglow.
The proposed LSST, Large-aperture Synoptic Survey Telescope (Tyson, Wittman & Angel 2000), is an 8.4m telescope with a 7 square degrees field of view. It can cover 20000 square degrees during 3-4 clear nights to a limiting magnitude of V=24. This telescope could find all transients with a 21st limiting magnitude and follow their light curves for more than a week. Its deep field will enable an easy discard of wrong candidates. It can also obtain an 8 color image that will help identifying transients as afterglows. A single week of observations with the LSST would give a tight constrain on the optical beaming. Another exciting result possible with this telescope is the comparison of the observed afterglows at 21st and 24th magnitudes. This will enable a determination of the ratio of on-axis to off-axis afterglows and will provide another handle on the “optical beaming factor”.
5 Radio Transients
The radio afterglow flux is still rising a few days after the burst. Therefore, in any survey the dominant population of radio afterglows would be from off-axis orphan afterglows. Hence, there is no way to constrain the initial radio beaming by the observed rate of radio afterglows. However, as suggested by Perna & Loeb (1998), the rate of the off-axis orphan radio afterglows can determine the total rate of GRBs or rather the rate of relativistic ejecta events, regardless of the prompt emission in different wave lengths at different stages.
After about 100 days the jet becomes spherical and sub-relativistic (Waxman, Frail & Kulkarni 1998). At this stage the only relevant initial condition is the total energy, , of the jet at the beginning of the adiabatic phase. This determines the strength of the emission and hence the distance from which the late radio afterglow can be detected. The rate of detection of radio afterglows depends, therefore, on the initial energy and on the rate of GRBs. However, both parameters (total energy and rate) are unknowns. Levinson et. al. (2002) estimate as and the true GRB rate as times the observed GRB rate. They find that the expected detection rate of radio afterglows depends almost linearly on the beaming factor. With a lower there are fewer but more energetic events. Those more energetic events can be detected from larger distances (typically of order of a few hundred Mpc). The gain in the detection volume overcomes the loss due to the lower rate. Using the FIRST and NVSS surveys Levinson et. al. (02) find at least 25 orphan afterglow candidates. This set a limit of . If none of these transients are orphan afterglows than beaming will be stronger with .
However, in the context of our paper, we allow for different beaming factors in different energy bands and the above relations are not trivial. There may not be a single parameter, , that determines both the rate of afterglows and their energy. With multiple beaming factors, the -rays beaming factor, , would determine the expected rate of orphan radio afterglow relative to the rate of GRBs. However, the total energy during the mildly relativistic radio phase may be much larger than . A large amount of energy could be ‘hidden’ in a relativistic component that does not emit -rays or even X-rays. This may be a problem, as the expected rate depends on the 11/6 power of the total energy (Levinson et. al. 2002). Thus one can use the Levinson et al. (2002) limits only if there is an independent evidence that . A determination that would be a step in the right direction.
6 Conclusions
There are various reasons to expect that GRB jets will have an angle dependent profile. For example, this is natural in the Collapsar model, in which a jet punches a hole in the surrounding stellar envelope. One can expect that along with the ultra-relativistic motion at the core of the jet there would be slower motion of a thicker envelope. The relations between the different beaming factors have many implications on different parameters of the GRB, most notably on the total energy budget. For example Frail et. al. (2001) and Panaitescu & Kumar (2001) calculate the total energy emitted in the prompt emission using: , where is the isotropic energy in -rays (during the several dozen seconds of the burst) and is the beaming factor of the optical emission several days after the burst. Clearly, this calculation is relevant only if , namely if the beaming during the afterglow after a day or so reflect the beaming during the prompt -ray emission. Indeed this fact that , is narrowly distributed suggests that (or at least ). Otherwise this narrow distribution would require a miraculous coincidence.
These ideas have motivated our study of the possibility of different beaming factors for different observed energies that correspond to matter moving with different Lorentz factors. Our analysis shows that the results of the three X-ray surveys, as well as the BeppoSAX data are consistent with a very moderate difference in the -rays and X-rays beaming. The four surveys shows that both the early and the late X-ray beaming, , are comparable to the -ray beaming, . Our most stringent limit , is obtained for the prompt X-ray emission from the BeppoSAX WFCs. This is only an upper limit because of the uncertainty in the interpretation of the XRFs as orphan GRB counterparts. The ratio is even lower if XRFs are not related to GRBs.
The highest limit is obtained for the afterglow 400 minutes after the burst from the ROSAT RASS data. With 17 unidentified transients compared to 3 expected we find . However, this is only a weak upper limit as all 6 transients (out of the original 23 transients) that have been checked were found to be flaring stars. It is possible that all the remaining 17 transients are not related to GRBs. We conclude that during the X-ray afterglow (20-400 minutes after the burst) is probably less than twice and is certainly ruled out by current observations. This result shows that the bulk energies at and at are comparable. This result supports the homogeneous jet approximation. It puts a strong constraint on the dependent jet model of Rossi et al., (02), as it requires that the ratio of -ray to X-ray emission is roughly constant throughout this variable jet.
In our analysis we have implicitly assumed (by using Eq. 3) that the energy per unit solid angle is similar in the on-axis orphan afterglows to the one in regular GRB afterglows. If this energy is lower by a given factor , then using Eq. 2 we find that will decrease by a similar factor. The signal will be detected but for a shorter period, as long as the maximal X-ray flux is above the sensitivity limit of the survey. This, in turn, will decrease the detection rate by and will increase the implied limits on the ratio of -ray beaming to X-ray beaming by . The total energy in X-ray emitting matter is proportional to . Hence our results impose a direct limit (independent of ) on this quantity. They show that the total energy in X-ray cannot be significantly larger than the total energy in -ray emitting matter.
It will be a remarkable achievement to constrain also the optical () beaming. We have argued that even existing hardware like Super-LOTIS can rule out (or confirm) on a time scale of several months. The proposed LTSS can constrain this factor within a week. Radio observations provide a different limit on the total rate of relativistic ejecta events. However, this limit can be obtained only under the assumption of a single beaming factor. If optical afterglow observations would show that this assumption would be reasonable. Under this assumption the comparison of the radio orphan afterglow rate to the GRB rate can set limits on . Levinson et al (02) find that current surveys limit . This is consistent with the rest of the observational results.
One argument that supports a beaming ratio of a few is obtained by comparing the different energies during the GRB. A detailed analysis of the afterglow light curves (Panaiteschu & Kumar, 01) and of the X-ray fluxes (Piran et al., 01) have shown that the kinetic energy during the adiabatic afterglow phase is also narrowly distributed. Panaiteschu & Kumar (01) find using and their estimates of that the average is larger than the average : . This result is somewhat puzzling (Piran, 01): A narrow distribution with implies (with no fine tuning) that (the total energy of relativistic ejecta) is narrowly distributed and (rather than ). The fact that is also narrowly distributed implies that , the conversion efficiency of relativistic kinetic energy to -rays (), is close to unity and moreover, itself should be rather narrowly distributed (between 70-80%). This last conclusion would be astonishing considering the dependence of on the the distribution of energies and Lorentz factors of the different shells that produce the internal shocks. This puzzle can be resolved if according to the patchy shell model, the -ray emitting regions are indeed narrower than the late time afterglow emitting regions. In this case the quantity: is an overestimate of by the relative beaming factor. Specifically, would have been overestimated by a factor of 3 if (Piran, 01).
Before concluding we remark that our results also impose limits on the rate of “failed GRBs”. We define here “failed GRBs” as events in which the source fails to produce GRB but ejects a relativistic ejecta (comparable in energy to GRBs’ ejecta) that produces a detectable afterglow. From the point of view of this paper “failed GRBs” can be viewed as extreme cases of on-axis orphan afterglows in which the -ray beam vanishes. In these events our “on axis orphan afterglows” would be true orphans having no GRB parent pointing towards any observer. The implied rates that we have found provide immediately limits on the ratio of “failed GRBs” to GRBs. In particular the ROSAT survey shows that the rate of “failed GRBs” with a regular X-ray afterglow cannot be more than a factor of eight (and possibly much lower) than the rate of GRBs. If the energy per solid angle is smaller, then as discussed earlier, the limit on the rate would be higher by the inverse factor. Optical survey, of the type we discuss here, could limit the rate of “failed GRBs” with an optical afterglow. This would presumably correspond to events in which the matter is ejected with a lower Lorentz factor.
We thank Avishay Gal-Yam, Jonathan Granot, Jonathan Katz, Pawan Kumar and Luigi Piro for helpful discussions. This research was supported by the US-Israel BSF.
References
- [1] \harvarditemBlandford & Mckee1976BM76Blandford, R. D., & Mckee, C. F., 1976, The physics of Fluids 19, 1130 (1976PhFl...19.1130B)
- [2] \harvarditemDalal, Griest & Pruet2002DGP02 Dalal N., Griest K., & Pruet J., 2002, ApJ, 564, 209 (2002ApJ...564..209D)
- [3] \harvarditemFishman & Meegan1995FM95 Fishman, G., J. & Meegan, C. A., 1995, ARA&A, 33, 415 (1995ARAA..33..415F)
- [4] \harvarditemFrail et al.2001Fra01Frail, D. A., et al. 2001, ApJL, 562, L55. (2001ApJ...562L..55F)
- [5] \harvarditemGranot et al.2002 i GPKWGranot, J., Panaitescu, A., Kumar, P. & Woosley, S. E. 2002, ApJL ,570, L61. (2002ApJ...570L..61G)
- [6] \harvarditemGranot & Sari2002GS02Granot, J., & Sari, R., 2002, ApJ, 568, 820 (2002ApJ...568..820G)
- [7] \harvarditemGreiner et al.1999GVB99Greiner J., Voges W., Boller T., & Hartmann D., 1999, A&AS, 138, 441 (1999AAS..138..441G)
- [8] \harvarditemGrindlay1999G99Grindlay J. E., 1999, ApJ, 510, 710 (1999ApJ...510..710G)
- [9] \harvarditemHeise et al.2001HZK01Heise, J., Zand J., Kippen, R. M., Woods, P. M. Gamma-Ray Bursts in the Afterglow Era, Proceedings of the International workshop held in Rome, CNR headquarters, 17-20 October, 2000. Edited by Enrico Costa, Filippo Frontera, and Jens Hjorth. Berlin Heidelberg: Springer, 2001, p. 16 (2001astro.ph.11246H)
- [10] \harvarditemKumar & Piran2000KP00Kumar, P. & Piran, T. 2000, ApJ, 535, 152 (2000ApJ...535..152K)
- [11] \harvarditemLevinson et al.2002LOW02Levinson, A., Ofek, E., Waxman, E. & Gal-Yam, A. 2002, astro-ph/0203262 (2002astro.ph..3262L)
- [12] \harvarditemNakar, Piran & Granot2002NPG02Nakar E., Piran T., & Granot J., 2002, astro-ph/0204203 (2002astro.ph..4203N)
- [13] \harvarditemPaczyński2001P01Paczyński, B. 2001, Astronomy and astrophysics : recent developments, Proceedings of the 10th Portuguese meeting, CENTRA, Lisbon, Portugal, 27-28 July 2000 Singapore: World Scientific Publishing, 2001. Edited by Jose P.S. Lemos, Ana M. Mourao, Luis Teodoro, and Roberto Ugoccioni. ISBN 9810246994, p.127, (2001aard.conf..127P)
- [14] \harvarditemPanaitescu & Kumar2001PK01Panaitescu, A. & Kumar, P. 2001, ApJL, 560, L49 (2001ApJ...560L..49P)
- [15] \harvarditemPerna & Loeb1998PL98Perna, R., & Loeb, A., 1998, ApJL, 509, L85 (1998ApJ...509L..85P)
- [16] \harvarditemPiro2000P00Piro, L., 2000, Proc. of “X-Ray Astronomy ’99:Stellar Endpoints, AGN and the Diffuse X-ray Background”, September 6-10, 1999, CNR Bologna, N. White ed. (astro-ph/0001436) ()
- [17] \harvarditemPiran2001P01Piran, T., to appear in the Proceedings of the Jan van Paradijs Memorial Symposium ”From X-ray Binaries to Gamma Ray Bursts”, June 6-8 Amsterdam, eds. E.P.J. van den Heuvel, L. Kaper and E. Rol; Astronomical Society of the Pacific, astro-ph/0111314
- [18] \harvarditemPiran et al2001PKP01Piran, T., Kumar, P., Panaitescu, A., & Piro, L. 2001, ApJL, 560, L167 (2001ApJ...560L.167P)
- [19] \harvarditemRhoads1997R97Rhoads, J. E., 1997, ApJL, 487, L1 (1997ApJ...487L...1R)
- [20] \harvarditemRossi, Lazzati & Rees2002RLR02Rossi, E., Lazzati, D., & Rees, M. J., 2002, MNRAS, 332, 945 ( 2002MNRAS.332..945R)
- [21] \harvarditemSari, Piran & Narayan1998SPN98Sari, R., Piran, T., & Narayan, R. 1998, ApJL, 497, L17 (1998ApJ...497L..17S)
- [22] \harvarditemSari, Piran & Halpern1999SPH99Sari, R., Piran, T., & Halpern, J. P. 1999, ApJL, 519, L17 (1999ApJ...519L..17S)
- [23] \harvarditemTotani & Panaitescu2002TP02Totani, T., & Panaitescu, A., 2002, Accepted to ApJ, astro-ph/020458 (2002astro.ph..4258T)
- [24] \harvarditemTyson et al.2000TWL00Tyson, J. A., Wittman, D., Labs, L. & Angel, J. R. P., 2000, astro-ph/0005381 ()
- [25] \harvarditemVanden Berk et al.2002vandenberkVanden Berk et al., 2002, ApJ, 576, 673 ()
- [26] \harvarditemWaxman, Kulkarni & Frail1998WKF98Waxman, E., Kulkarni, S. R. & Frail, D. A., 1998, ApJ, 497, 288 (1998ApJ...497..288W)
- [27] \harvarditemYork et al.2000Y00York, D. G. et al., 2000, AJ, 120, 1579 (2000AJ....120.2615F)
- [28]