Modeling Brown Dwarfs, L Dwarfs, and T Dwarfs
Abstract
In this contribution, I touch on a subset of our recent efforts in spectral and opacity modeling aimed at improving our understanding of brown dwarfs, L dwarfs, and T dwarfs. I discuss theoretical calculations of the alkali line profiles, newly generated CrH opacities, new evidence for refractory rainout in T dwarfs from optical spectral measurements, and the distinction between brown dwarfs and planets.
Department of Astronomy, The University of Arizona, Tucson, AZ, USA 85721
1. Introduction
The subject of brown dwarfs (and substellar-mass objects in general) is entering a new phase of rapid expansion and discovery. More than 200 L dwarfs are now known, and they are joined by 30 T dwarfs. This development requires a corresponding expansion in theoretical effort, involving at its core evolutionary, spectral, and compositional modeling. Crucial to spectral modeling are molecular and atomic opacities, many of which have not been addressed before with the degree of seriousness and completeness that standard stellar atmospheres studies have long enjoyed. However, the pace of relevant spectral and opacity calculations is accelerating and in this spirit I summarize in this paper a few such topics of recent interest. In §2., I show new proof of the “rainout” and settling of refractory elements in T dwarfs. Rainout leaves as one of its consequences the lower-temperature reaches of T dwarf atmospheres enhanced in sodium and potassium atoms. In §3., I touch on some new calculations of the alkali line wings to many 1000’s of Å detunings. The red wing of the K I line centered at 0.77 m in particular defines much of the T dwarf continuum between 0.77 m and 1.0 m . This is followed in §4. by a short discussion of the new CrH opacities recently generated by our group. Finally, and a bit tentatively, in §5. I finish with a short discussion on nomenclature, a subject that continues to exercise the brown dwarf and extrasolar planet communities.
2. A New Proof of Rainout/Depletion in T Dwarfs
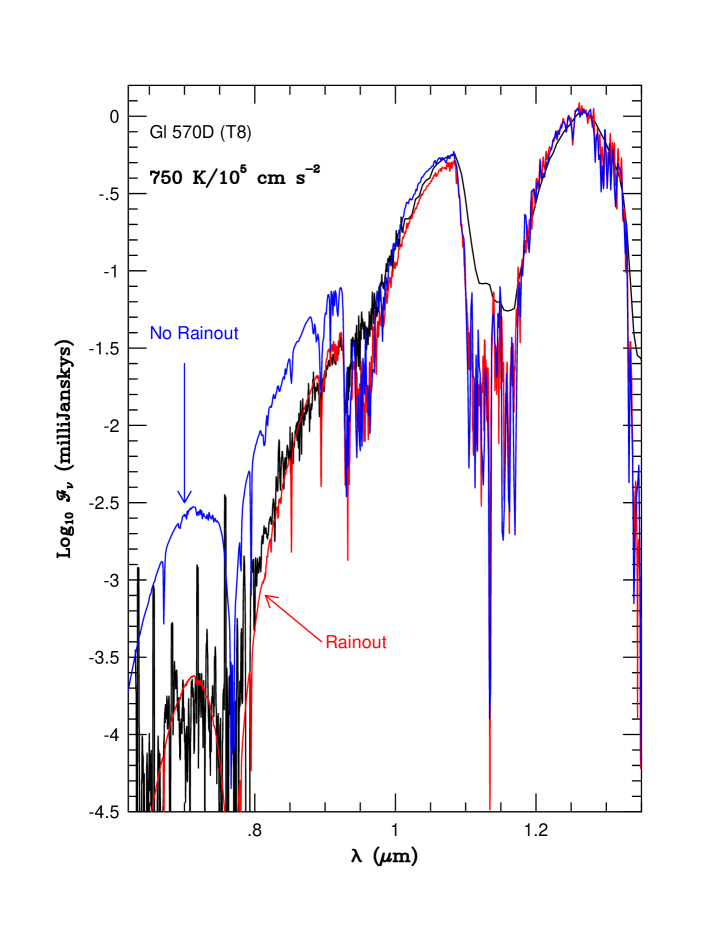
As explained in Burrows, Marley, and Sharp (2000, BMS), rainout depletes the atmospheres of the refractory elements Ca, Al, Mg, Fe, and Si. In particular, rainout suppresses the formation of alkali feldspars and enables atomic Na and K to survive to lower temperatures and pressures, at which point they form Na2S(c) and KCl(c) (Lodders 1999). As a consequence, their influence on the emergent spectrum in the “optical” between 0.5 m and 1.1 m is enhanced. This effect is seen dramatically for the first time in Fig. 1. At , the data for Gliese 570D (Burgasser et al 2001), the coolest known T dwarf, clearly favor the “rainout” model. This fact reiterates the conclusion of BMS that the wings of the Na D and K I (7700Å) resonance lines and aggressive rainout of heavy metals (with the resulting enhancement of the sodium and potassium abundances at altitude) are required to fit the T dwarf data shortward of 1.0 m . It is shortward of 1.0 that the alkali chemistry can be most readily probed (Burrows et al. 2002a).
3. Alkali Metal Line Profiles
To continue on the alkali theme, in standard stellar atmospheres, atomic lines are superposed on a background continuum and the concepts of equivalent width and curve of growth make conceptual and practical sense. An individual line is but a perturbation on the local spectrum. However, due to the rainout of metals in cool atmospheres and the consequent paucity of continuum and alternate opacity sources between 0.4 m and 1.0 m , the wings of the strong resonance doublets centered at 7700 Å (K I) and 5890 Å(Na-D) assume the role of the continuum throughout most of this spectral range (BMS; Tsuji, Ohnaka, and Aoki 1999). In particular, the red wing of the transitions of K I provides the pseudo-continuum in cool molecular atmospheres all the way from 0.77 m to 1.0 m . The Na-D doublet, centered as it is in the middle of the visible, determines the true color of brown dwarfs (magenta/purple; Burrows et al. 2001).
Hence, whereas in traditional stellar atmospheres the Lorentzian core and Gaussian wings of a line are not generally of relevance beyond 20 Å detunings ( from the line core), in cool substellar atmospheres the relevant reach of the Na I and K I resonance lines can be thousands of Å. Given this, to achieve accurate spectral fits for brown dwarf, L dwarf, T dwarf, and hot giant planet atmospheres, the shapes of the far wings of these alkali lines as a function of pressure and temperature must be ascertained.
Recently, Burrows and Volobuyev (2002c) performed ab initio calculations of the energy shifts of the ground and excited states of sodium and potassium immersed in H2- and helium-rich atmospheres and have obtained the opacity profiles of the red and blue wings of the Na-D and K I resonance lines using the Unified Franck-Condon formalism (Szudy and Baylis 1975,1996). The absorption spectra as a function of photon wavelength for the D2 and D1 lines of Na and K centered near 5890 Å and 7700 Å, respectively, are depicted in Fig. 2 at a temperature of 1000 K and a total pressure of one atmosphere. The contributions at various orientation angles of H2, the angle-integrated spectra (solid), and the results for the Na+He and K+He systems are shown. The Lorentzian cores are not included on this plot.
As seen in Fig. 2, the cutoff on the red wing of the potassium feature due to an exponential term containing the ground-state interaction potential of the K+H2 system is seen to be situated between 0.95 m and 1.0 m , close to the 0.98 m used in Burrows et al. (2002c). The cutoff of the red wing of the Na feature is near 0.8 m , but is a bit more gradual. The corresponding cutoffs for the alkali-He systems are more abrupt, but of less importance due to the lower abundance of helium. Importantly, unlike in the algorithm of BMS, there are no free parameters for this theory of line profiles; the cutoff on the red wing of the K I feature appears naturally. Fig. 2 also makes clear that the red and blue wings are asymmetrical.
4. New CrH Opacities
The 1-0 and 0-0 bands of the A – X transition of CrH are used as primary markers for the new L dwarf spectral class (Kirkpatrick et al. 1999a,b). Hence, accurate CrH line lists and oscillator strengths are needed to calculate the CrH opacities now used to model the spectral energy distributions of these transitional and substellar objects.
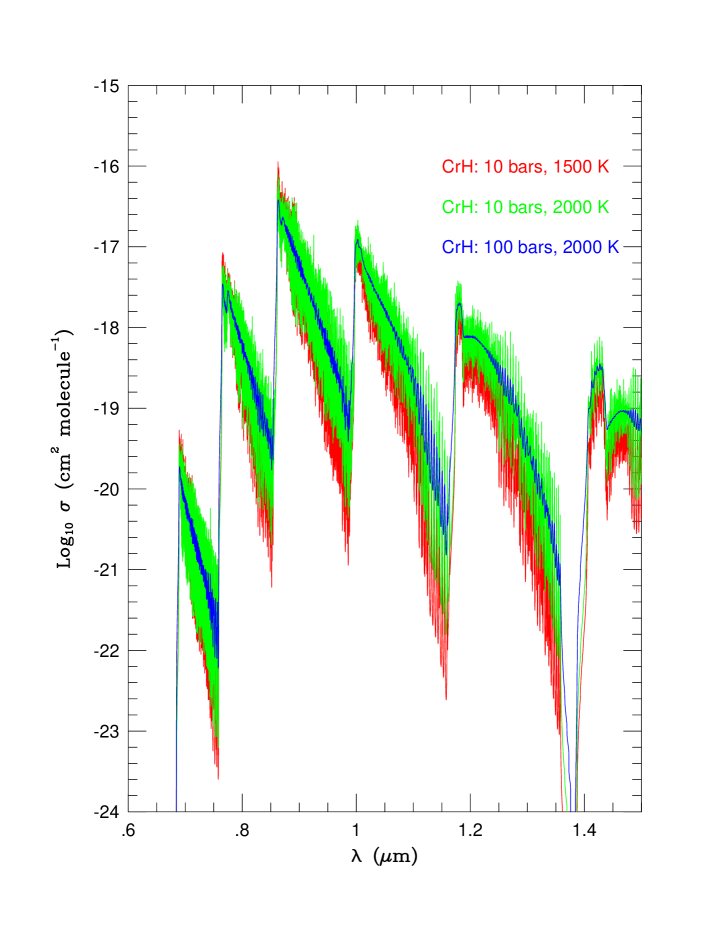
Burrows et al. (2002b) have recently created a program for generating CrH cross sections for the six band sequences with band heads from 0.7 m to 1.4 m . Figure 3 depicts the resulting CrH cross sections for representative pressures and temperatures at which CrH is typically found in substellar atmospheres. Specifically, opacity spectra for pairs of 1500 K/10 bars, 2000 K/10 bars, and 2000 K/100 bars are portrayed. The corresponding opacities using the older database for the 0–0 transition of CrH of Ram, Jarman, and Bernath (1993), as calculated by R. Freedman (private communication), are two orders of magnitude weaker. The lion’s share of the difference between the old and the new CrH opacities can be traced to an increase by a factor of 13.5 in the oscillator strength and to a previously inappropriate division by 6, the electronic spin degeneracy factor. The A–X 0–0 band at 0.86 microns (just shortward of the neighboring FeH feature at 0.87 microns) and the A–X 0–1 CrH band near 0.997 microns (just longward of the classic Wing-Ford band of FeH) are prominent and, in principle, diagnostic features in measured L dwarf spectra (Kirkpatrick et al. 1999a,b).
Since CrH is a defining molecule of the L dwarf spectroscopic class, accurate opacities as a function of temperature and pressure are necessary for spectral syntheses and to extract CrH abundances for L dwarf atmospheres. Burrows et al. (2002b) have used the new theoretical opacity data to obtain an abundance for the L5 dwarf 2MASSI J1507038-151648 (Kirkpatrick et al. 1999b). Figure 4 depicts this comparison. The CrH/H2 number ratio they find is , in reasonable agreement with expectations.
5. What’s in a Name?
The deuterium burning cut was used originally by some to distinguish planets from brown dwarfs. This was partly because of a figure in Burrows et al. (1997) that arbitrarily distinguished evolutionary trajectories in luminosity/age space on this basis, calling one class that burned tens of percent or more of their deuterium brown dwarfs and the others that did not “planets” (as I recall, the original figure had the quotes as well). Also, one has the unfounded prejudice that a planet should not have a thermonuclear phase.
One should distinguish giant planets from brown dwarfs by their mode of formation, by their origin. Since an object’s origin is not easily “detected” or discerned, the situation is ready-made for confusion. In fact, there is really no need to define and codify the nomenclature nor the name to be applied to any particular object or class of objects at this time; people just want (perhaps a bit too rigidly and with unjustified Procrustean zeal) to name things, or to stuff objects into cubbyholes.
There is ambiguity in the provenance of these objects and this ambiguity will be with us for a while. If one uses a particular term (planet or brown dwarf), one should always include the definition one is employing. Not to do so implies that a standard, acceptable definition has been arrived at; despite what some have written and the IAU, such is not the case.
Hence, formation history is a key, but not yet known. One would expect a planet (or most of them) to be orbiting a star (or brown dwarf). There may be metallicity (composition) differences between objects with the same mass, but different origins or modes of formation. Eccentricity is probably not a good discriminant (though this is not known). Very few “planets” are expected to be flung out of their cradles. Brown dwarfs are just the tail of the stellar mass distribution, but the mass distributions of brown dwarfs and giant planets may overlap.
When classifying a newly-discovered substellar-mass object, one can use a variety of “reasonable” criteria, but the tentative classification is just that, tentative. The usefulness of a classification scheme at this stage in the development of the two related subjects of brown dwarfs and giant planets is inversely proportional to its rigidity. A flexible and open-minded philosophy towards nomenclature is best, which more data and information will progressively guide towards a more and more reasonable naming scheme. It may be that the mass distributions of planets and brown dwarfs don’t overlap, that their compositions will enable one to distinguish one from the other, etc. Until then, I prefer a bit of ambiguity to the illusion of clarity and the pretense of certainty. When there is fog, to acknowledge its presence is more honest than to try to ignore it.
Acknowledgments.
The author thanks Bill Hubbard, Jonathan Lunine, David Sudarsky, Ivan Hubeny, Christopher Sharp, Drew Milsom, Maxim Volobuyev, Curtis Cooper, Adam Burgasser, Davy Kirkpatrick, and Jonathan Fortney for informative exchanges and collaboration, as well as NASA for its financial support via grants NAG5-10760 and NAG5-10629.
References
Anders, E. and Grevesse, N. 1989, Geochim. Cosmochim. Acta, 53, 197
Burgasser, A.J., et al. 2002, ApJ, 564, 421
Burrows, A., Marley M., Hubbard, W.B. Lunine, J.I., Guillot, T., Saumon, D. Freedman, R., Sudarsky, D. and Sharp, C.M. 1997, ApJ, 491, 856
Burrows, A., Marley, M.S., and Sharp, C.M. 2000, ApJ, 531, 438
Burrows, A., Hubbard, W.B., Lunine, J.I., and Liebert, J. 2001, Rev. Mod. Phys., 73, 71
Burrows, A., Burgasser, A.J., Kirkpatrick, J.D., Liebert, J., Milsom, J.A., Sudarsky, D., and Hubeny, I. 2002a, ApJ,, 573, 394
Burrows, Ram, R, Bernath, P, Sharp, C., and Milsom, J.A. 2002b, ApJ, in press
Burrows, A. and Volobuyev, M. 2002c, submitted to ApJ
Kirkpatrick, J.D., Reid, I.N., Liebert, J., Cutri, R.M., Nelson, B., Beichman, C.A., Dahn, C.C., Monet, D.G., Gizis, J., and Skrutskie, M.F. 1999a, ApJ, 519, 802
Kirkpatrick, J.D., Allard, F., Bida, T., Zuckerman, B., Becklin, E.E. Chabrier, G., Baraffe, I. 1999b, ApJ, 519, 834
Lodders, K. 1999, ApJ, 519, 793
Ram, R.S., Jarman, C.N. and Bernath, P.F. 1993, J. Mol. Spectrosc., 161, 445
Szudy, J. and Baylis, W. 1975, J. Quant. Spectrosc. Radiat. Transfer, 15, 641
Szudy, J. and Baylis, W. 1996, Physics Reports, 266, 127
Tsuji, T., Ohnaka, K., and Aoki, W. 1999, ApJ, 520, L119