Molecular line study of the very young protostar
IRAM 04191 in Taurus: Infall, rotation, and outflow
We present a detailed millimeter line study of the circumstellar environment of the low-luminosity Class 0 protostar IRAM 04191 + 1522 in the Taurus molecular cloud. New line observations demonstrate that the AU radius protostellar envelope is undergoing both extended infall and fast, differential rotation. Radiative transfer modeling of multitransition CS and C34S maps indicate an infall velocity km s-1 at AU and km s-1 up to AU, as well as a rotational angular velocity rad s-1, strongly decreasing with radius beyond 3500 AU down to a value 1.5–3 rad s-1 at 11000 AU. Two distinct regions, which differ in both their infall and their rotation properties, therefore seem to stand out: the inner part of the envelope ( AU) is rapidly collapsing and rotating, while the outer part undergoes only moderate infall/contraction and slower rotation. These contrasted features suggest that angular momentum is conserved in the collapsing inner region but efficiently dissipated due to magnetic braking in the slowly contracting outer region. We propose that the inner envelope is in the process of decoupling from the ambient cloud and corresponds to the effective mass reservoir () from which the central star is being built. Comparison with the rotational properties of other objects in Taurus suggests that IRAM 04191 is at a pivotal stage between a prestellar regime of constant angular velocity enforced by magnetic braking and a dynamical, protostellar regime of nearly conserved angular momentum. The rotation velocity profile we derive for the inner IRAM 04191 envelope should thus set some constraints on the distribution of angular momentum on the scale of the outer Solar system at the onset of protostar/disk formation.
Key Words.:
stars: formation – circumstellar matter – stars : rotation – planetary systems : protoplanetary disks – ISM : kinematics and dynamics – ISM : molecules1 Introduction
1.1 The enigmatic onset of protostellar collapse
Despite recent progress, the initial conditions of star formation and the first phases of protostellar collapse remain poorly known (e.g. Myers 1999; André, Ward-Thompson & Barsony 2000 for reviews). In the standard theory of isolated, low-mass star formation (e.g. Shu, Adams & Lizano 1987), the initial conditions correspond to essentially static singular isothermal spheres (SISs, which have ), assumed to be in slow, solid-body rotation (Terebey, Shu & Cassen 1984 – TSC84). This leads to a strictly constant mass accretion rate, (where is the isothermal sound speed), and to a growth of the centrifugal disk as (cf. TSC84) during the protostellar accretion phase (). Other theoretical models exist, however, that predict a time-dependent accretion history if the collapse initial conditions are either not singular or not scale-free (e.g. Foster & Chevalier 1993; Henriksen, André & Bontemps 1997; Basu 1997; Ciolek & Königl 1998; Hennebelle et al. 2002). Starting from realistic, finite-sized prestellar cores with in their central region (c.f. Ward-Thompson, Motte & André 1999; Bacmann et al. 2000; Alves, Lada & Lada 2001), these models yield supersonic inward velocities close to the center prior to point mass formation (i.e. at ) and result in denser, nonequilibrium density distributions with strong differential rotation at the onset of the main accretion phase, i.e., at . In these models, the accretion rate is initially significantly larger than in the Shu model, then quickly converges toward the standard value, and finally declines much below because of the finite reservoir of mass (see, e.g., Foster & Chevalier 1993; Henriksen et al. 1997). Conservation of angular momentum during dynamical collapse at produces a differential rotation profile at (e.g. in the magnetically-controlled model of Basu 1998). This rotation profile in turn implies a more rapid growth of initially (i.e., at small in the Basu model) than in the TSC84 model.
Getting at a better, more quantitative knowledge of protostellar collapse is crucial, e.g., to gain insight into the origin of stellar masses and disk formation. Observationally, there are two complementary approaches to estimating the initial conditions of protostar formation. The first approach consists in studying the structure and kinematics of “prestellar cores” such as L1544 (e.g. Ward-Thompson et al. 1999; Tafalla et al. 1998) , representative of times . The second approach, adopted here, is the detailed study of Class 0 accreting protostars observed at , such as IRAM 04191 (see § 1.2), which should still retain detailed memory of their initial conditions.
1.2 IRAM 04191: A very young Class 0 protostar in Taurus
The massive () dense core/envelope of the Class 0 object, IRAM 04191 + 1522 (hereafter IRAM 04191), was originally discovered in the millimeter dust continuum with the IRAM 30m telescope in the southern part of the Taurus molecular cloud (André, Motte & Bacmann 1999 – hereafter AMB99). Follow-up observations revealed a highly collimated CO bipolar outflow (see Fig. 1), a weak 3.6 cm VLA radio continuum source located at its center of symmetry, and spectroscopic evidence of spatially extended infall motions in the bulk of the envelope. These are typical attributes of a Class 0 protostar (André, Ward-Thompson & Barsony 1993, 2000).
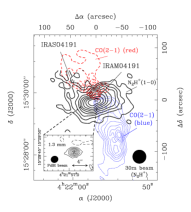
The insert in the bottom-left corner shows a 227 GHz dust continuum map of the inner envelope obtained at the IRAM Plateau de Bure interferometer (see § 3.1), with positive (solid) contours from to by 1 mJy/1.9″-beam; the dotted contour is negative at mJy/1.9″-beam).
In both maps, the central star symbol at (0,0) marks the position of IRAM 04191 as determined by a 2D Gaussian fit to the PdBI 227 GHz continuum image. The other star symbol indicates the position of the Class I source IRAS 04191.
The very high envelope mass to luminosity ratio of IRAM 04191 ( M⊙/L⊙) and its position in the evolutionary diagram ( L⊙ and K) suggest an age yr since the beginning of the accretion phase (see AMB99). This is significantly younger than all of the IRAS candidate protostars of Taurus (e.g. Kenyon, Calvet & Hartmann 1993), including L1527 which has yr (e.g. Ohashi et al. 1997a). IRAM 04191 thus appears to be the youngest accreting protostar known so far in Taurus, although the collapsing protostellar condensation MC 27 discovered by Onishi, Mizuno & Fukui (1999) may be in a comparable evolutionary state.
As IRAM 04191 is particularly young, nearby (d pc), and relatively isolated, the study of its velocity structure based on molecular line observations provides a unique opportunity to set constraints on collapse models. This is especially true since the viewing angle is favorable. The CO(2–1) outflow map of AMB99 (see Fig. 1) shows well separated outflow lobes with almost no overlap between blue-shifted and red-shifted emission, indicating that the flow lies out of the plane of the sky at an intermediate inclination angle (e.g. Cabrit & Bertout 1990). In addition, AMB99 estimate an aspect ratio of for the circumstellar dust/N2H+ envelope, whose major axis is perpendicular to the outflow axis (cf. Fig. 1). Both characteristics are consistent with an inclination angle of the outflow axis to the line of sight of .
Here, we present and discuss the results of a comprehensive set of molecular line observations toward IRAM 04191. The layout of the paper is as follows. Sect. 2 summarizes observational details. Sect. 3 interprets the observations in terms of infall, rotation, and outflow motions in the envelope. We then model the observed spectra using radiative transfer simulations computed in 1D spherical geometry with radial infall motions (Sect. 4) and in 2D axial geometry with both infall and rotational motions (Sect. 5). Sect. 6 compares the derived constraints on the velocity structure of the IRAM 04191 envelope with the predictions of collapse models. Our conclusions are summarized in Sect. 7.
2 Observations
We carried out millimeter line observations with the IRAM 30m telescope at Pico Veleta, Spain, during 7 nights in July and August 1999, in the following molecular transitions: N2H+(1-0), CS(2-1), C34S(2-1), HCO+(1-0), H13CO+(1-0), C3H2(212-101) at 3 mm, CS(3-2), C34S(3-2), H2CO(212-111) at 2 mm, and CS(5-4), H2CO(312-211), C18O(2-1), DCO+(3-2) at 1.2 mm. Our adopted set of line frequencies is given in Table 1. The half-power beamwidths were , and at 3 mm, 2 mm and 1.2 mm, respectively. We used four SIS heterodyne receivers simultaneously and an autocorrelation spectrometer as backend, with a spectral resolution of 20 kHz at 3 mm and 40 kHz at 2 mm and 1.2 mm. The corresponding velocity resolutions ranged from 0.05 to 0.08 km s-1 per channel. The observations were done in single sideband mode, with sideband rejections of 0.01, 0.1 and 0.05 at 3 mm, 2 mm and 1.2 mm, respectively. The forward and beam efficiencies of the telescope used to convert antenna temperatures into main beam temperatures are listed in Table 1. The system temperatures ( scale) ranged from K to K at 3 mm, K to K at 2 mm, and K to K at 1.2 mm. The telescope pointing was checked every hours on Saturn, 0528+134, and/or 0420-014 and found to be accurate to (rms). The telescope focus was optimized on Saturn every hours. Position switching observations were done with a reference position located at either (,) = (,) or (,) relative to the (0,0) position (envelope center as measured in the 1.3mm continuum). Extensive mapping was performed in the “on-the-fly” mode (Ungerechts et al. 2000). A few additional C18O(1-0), C18O(2-1), CS(3-2), C34S(3-2), CS(5-4) and H13CO+(3-2) position-switch observations, performed in September 1997, November 2000 and October 2001, will also be used here. All of these single-dish data were reduced with the CLASS software package (Buisson et al. 2002).
In addition, we also observed IRAM 04191 with the 5-antenna IRAM Plateau de Bure interferometer (PdBI) in its B1, C2, D configurations between January and April 1999. The two receivers of each antenna were tuned to the CS(2-1) and H2CO(312-211) lines, with spectral resolutions of 40 kHz and 80 kHz, corresponding to velocity resolutions of 0.12 km s-1 and 0.10 km s-1, respectively. The four remaining windows of the PdBI correlator were used to record the continuum emission with a total bandwidth of 300 MHz at both 98 GHz ( mm) and 227 GHz ( mm). The (naturally-weighted) synthesized half-power beamwidths were (630 AU 620 AU) at 98 GHz and (270 AU 250 AU) at 227 GHz, and the (FWHP) primary beams and , respectively. The correlator bandpass was calibrated on the strong source 3C273. Several nearby phase calibrators were observed to determine the time-dependent complex antenna gains. The absolute calibration uncertainty was estimated to be . The data were calibrated and imaged using the CLIC (Lucas 1999) and Mapping (Guilloteau, Lucas & Bouyoucef 2002) packages in the IRAM software.
| Line | Frequency(1) | (2) | Ref. | Feff(4) | Beff(4) |
|---|---|---|---|---|---|
| (MHz) | (km s-1) | (3) | () | () | |
| C3H2(212-101) | 0.02 | (1) | 92 | 73 | |
| N2H+(101-012) | 0.02 | (2) | 92 | 73 | |
| C34S(2-1) | 0.003 | (3) | 92 | 73 | |
| CS(2-1) | 0.003 | (3) | 90 | 73 | |
| C18O(1-0) | 0.005 | (4) | 92 | 73 | |
| C34S(3-2) | 0.002 | (3) | 87 | 65 | |
| 90 | 54 | ||||
| CS(3-2) | 0.002 | (3) | 90 | 54 | |
| C18O(2-1) | 0.002 | (5) | 86 | 42 | |
| CS(5-4) | 0.001 | (3) | 84 | 42 |
-
Notes: (1)
The frequency uncertainty in units of the last significant digit is given in parentheses.
-
(2)
Frequency uncertainty converted in units of velocity.
-
(3) References for rest frequencies:
(1) Laboratory measurement from Vrtilek, Gottlieb & Thaddeus (1987); (2) Observational result from Lee, Myers & Tafalla (2001); (3) Laboratory measurement from Gottlieb, Myers & Thaddeus (2002). (4) Laboratory measurement from Klapper (2001, private communication). (5) Laboratory measurement from Klapper et al. (2001).
-
(4)
Forward and beam efficiencies of the IRAM 30m telescope (Wild (1999) and http://www.iram.es/).
3 Results and qualitative interpretation : Evidence for rotation and infall
3.1 Weak 1.3 mm continuum detection at PdBI
The PdBI continuum image at 227 GHz (see Fig. 1) reveals weak, point-like emission centered at , , a position which should be accurate to better than . (The PdBI position is offset by from the N2H+(1-0) centroid observed at the 30m telescope, which is only marginally significant given the single-dish pointing accuracy.) We measure a peak 227 GHz flux density of mJy/-beam at the central position. The 227 GHz emission is slightly resolved and a Gaussian fit performed in the uv-plane yields a deconvolved FWHM size of with a position angle P.A. . At 98 GHz, the rms noise level is 0.14 mJy/-beam and we do not detect any emission above 0.6 mJy/-beam ()111We measure a peak 98 GHz flux density of 0.6 mJy/-beam close to ( north-east of) the central 227 GHz position but the cleaned image contains negative contours down to mJy/-beam..
For comparison, using the IRAM 30m telescope equipped with the MPIfR bolometer
array (MAMBO), Motte & André (2001) measured a peak flux density
of mJy/-beam
at 1.3 mm ( GHz – e.g. Broguière et al. 2002)
and a radial intensity profile of the form
in the range of angular radii to .
This extended 1.3 mm continuum source is clearly
the dust counterpart of the circumstellar gas envelope/core observed in
N2H+ (cf. Fig. 1).
Assuming the same radial intensity profile holds at smaller angular radii,
one expects the peak flux density of the envelope to scale as
with beamsize
. If we adopt a dust opacity index to account for
the slight difference in observing frequency between the 30m and PdBI
measurements, this flux-density scaling predicts
mJy/-beam, which is
only 25% larger than the PdBI peak flux density quoted above.
Given the relative calibration uncertainties, this comparison suggests that
the weak 227 GHz emission detected at PdBI arises from the inner part of the
envelope seen at the 30m telescope rather than from an
accretion disk surrounding the central protostellar object.
Furthermore, a single power law
appears to characterize the radial intensity profile of the envelope
over the whole range of angular radii from to
. Such an intensity profile
implies either a relatively flat density profile
if central heating with
applies in the inner part of the envelope
(see Fig. 7 below), or a density profile
if the dust temperature is uniform.
The weak emission detected at PdBI sets strong constraints on the mass and
size of any central accretion disk.
Assuming optically thin emission, a dust mass opacity of 0.02 cm2 g-1
typical of circumstellar disks (cf. Beckwith et al. 1990) and a mean dust
temperature of 20 K, the PdBI peak flux density yields
M⊙.
Alternatively, the assumption of optically thick dust emission at 20 K
implies AU.
3.2 Fast, differential rotation
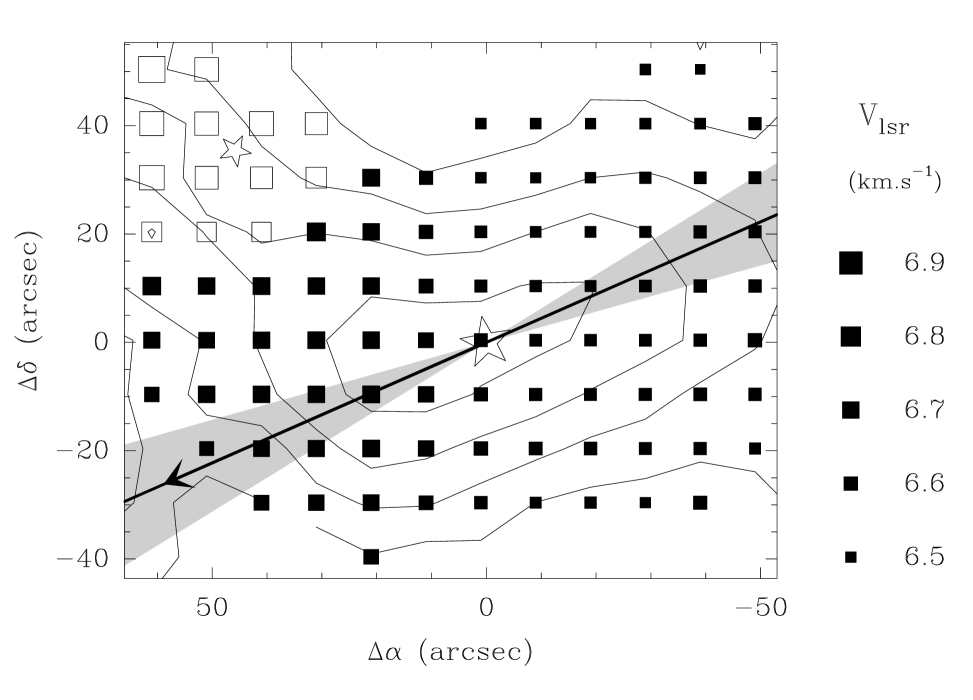
All of the centroid velocity (first-order moment) maps taken at the 30m telescope in small optical depth lines, such as C3H2(212-101), N2H+(101-012), H13CO+(1-0), and C34S(2-1), show a clear velocity gradient across the envelope (see, e.g., Fig. 2). The (south)-east part is redshifted with respect to the source systemic velocity, while the (north)-west part is blueshifted. We have applied the sector method described by Arquilla & Goldsmith (1986) to measure the direction of this velocity gradient in the C3H2(212-101) map using Gaussian fits to the spectra. We obtain a position angle P.A. 222Before fitting the direction of the velocity gradient, we have masked the redshifted emission seen in the north-east part of the C3H2(212-101) map shown in Fig. 2, probably due to the redshifted lobe of the outflow or to the nearby Class I source IRAS 04191+1523 (Tamura et al. 1991). (cf. Fig. 2). The velocity gradient thus lies along the major axis of the elongated dust/N2H+ core (P.A. ), i.e., perpendicular to the outflow axis. Coupled to the high degree of symmetry of the position-velocity diagrams shown in Fig. 3 with respect to envelope center, this strongly suggests that the envelope is rotating about an axis coinciding with the outflow axis (cf. Fig. 1). Turbulent motions would produce a more random velocity field (cf. Burkert & Bodenheimer 2000) and are weak here anyway (see § 3.4 and Fig. 12b below).
From now on, we adopt a position angle P.A. for the projection of the rotation/outflow axis onto the plane of the sky. To minimize contamination by the outflow, we analyze the velocity structure of the envelope along the axis perpendicular to the outflow (P.A. ) and going through the center. Along this axis, the magnitude of the velocity gradient estimated from linear fits to the C3H2(212-101), H13CO+(1-0), C34S(2-1), and N2H+(101-012) position-velocity diagrams is km s-1 pc-1, km s-1 pc-1, km s-1 pc-1, and 10 km s-1 pc-1, respectively, increasing from north-west to south-east over (see Fig. 3). The mean velocity gradient is km s-1 pc-1. Given the estimated viewing angle of the flattened envelope (cf. § 1.2), this implies a mean rotational angular velocity of km s-1 pc-1 in the inner AU radius region333With such an angular velocity, the gas at AU would make a complete turn in Myr, which is comparable to the typical lifetime of prestellar cores with central densities cm-3 (e.g. Jessop & Ward-Thompson 2000). Thus, although the observed velocity gradient is probably not indicative of a well-developed circular motion, it may have already induced significant rotational distortion in the envelope. .
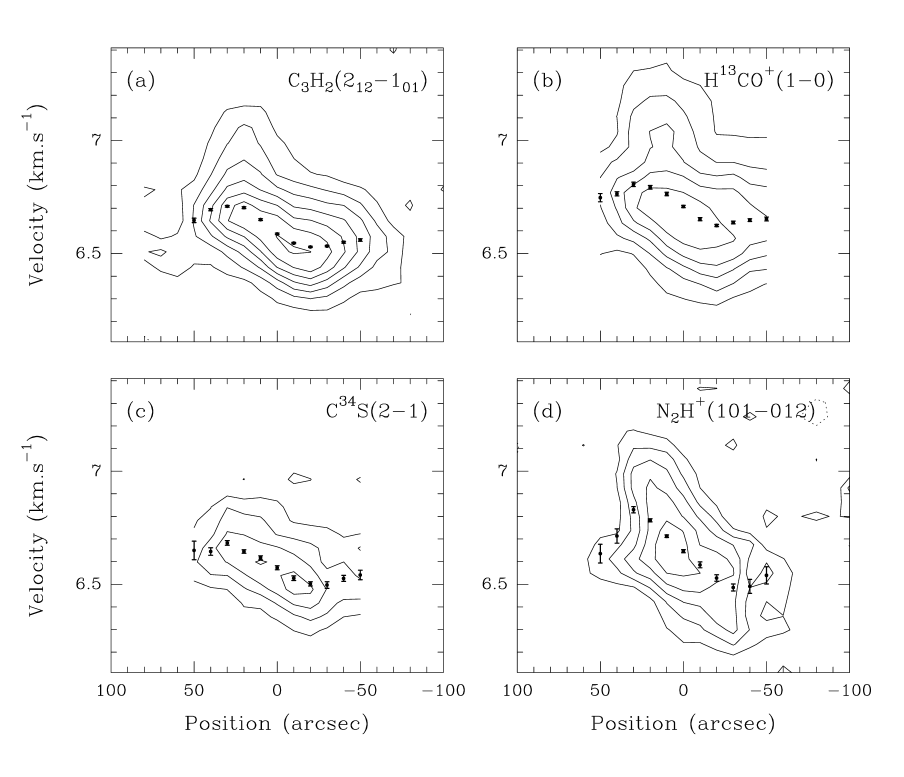
The C3H2(212-101), H13CO+(1-0), and N2H+(101-012) position-velocity diagrams shown in Fig. 3 may be slightly contaminated by a secondary, redshifted component toward the east. We have used the GAUSSCLUMPS algorithm of Stutzki & Güsten (1990) (see also Kramer et al. 1998) to try and subtract this secondary component. The algorithm finds a Gaussian component at approximately (, ) in C3H2(212-101) and (, ) in H13CO+(1-0). The removal of this secondary component reduces the magnitude of the velocity gradient measured in C3H2(212-101) and H13CO+(1-0) by . GAUSSCLUMPS fails to identify any secondary component near the same location in the N2H+(101-012) data. The velocity gradient thus seems to be significantly larger in N2H+(101-012) than in the other three lines (see below).

Remarkably, all of the position-velocity diagrams shown here present a S
shape, clearly seen on the peak velocity curves derived from Gaussian fits
(see Fig. 3).
On either side of the source, the velocity shift with respect to the
systemic velocity increases in absolute value up to an angular
radius
(i.e., one full beamwidth of the 30m telescope at 3mm, corresponding to
AU), and then decreases for
. This is further illustrated in
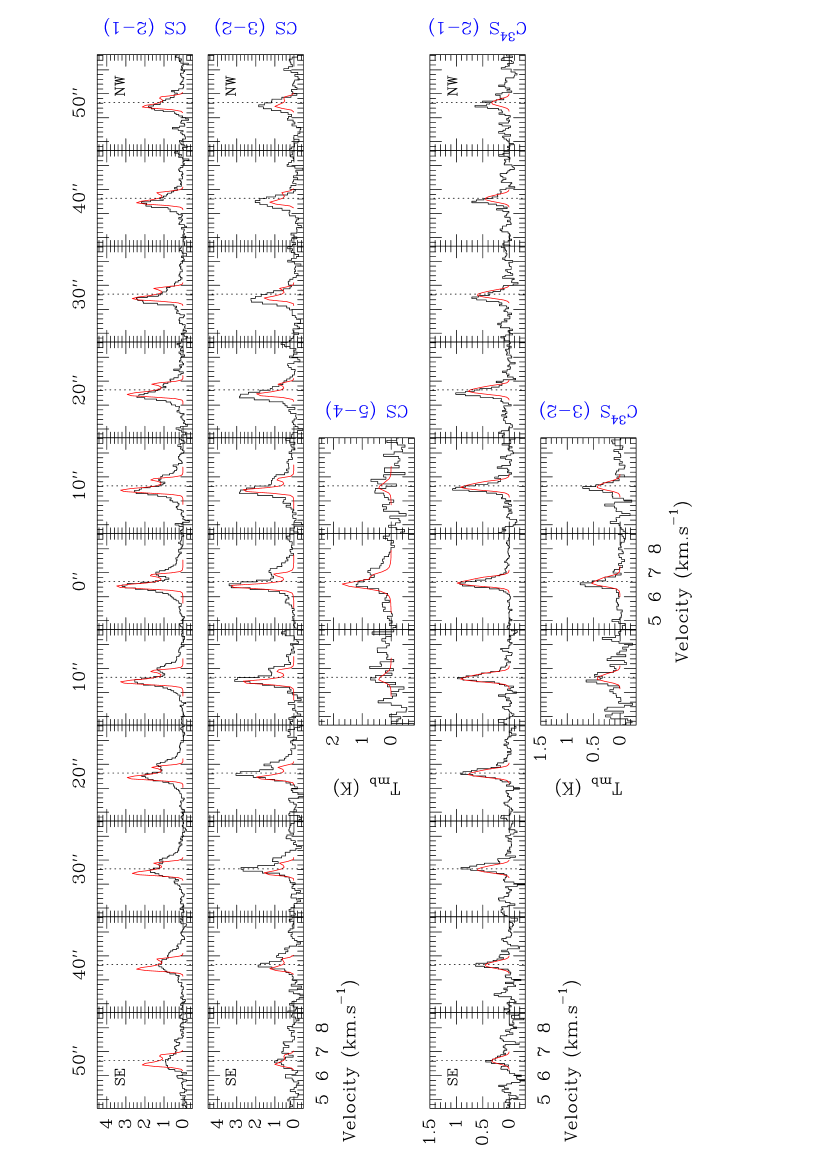
Fig. 4 which shows the C3H2(212-101) and
C34S(2-1) spectra observed every half beamwidth (Nyquist sampling)
at symmetric positions with respect to
source center along the direction perpendicular to the outflow axis.
It can be seen that the velocity shift between symmetric positions decreases
from km s-1 (i.e., 2.5 channels) at to
km s-1 (1.3 ch.) at in
C3H2(212-101). In C34S(2-1), the velocity shift varies
from km s-1 (2.6 ch.) at to
km s-1 (2.3 ch.) at .
These values translate into a decrease of the C3H2(212-101)
velocity gradient from 4.8 km s-1 pc-1 to 1.3 km s-1 pc-1
between and , and to a decrease of the C34S(2-1)
velocity gradient from 4.5 km s-1 pc-1 to 2.6 km s-1 pc-1
between and .
The decrease of the velocity shift with radius beyond
is in marked contrast with the linear increase expected in the case of
solid-body rotation. We thus conclude that there is strong evidence for differential rotation in the envelope beyond AU.
Correcting for inclination and taking all four lines of Fig. 3
into account, we estimate that the rotational angular velocity decreases by a
factor of from km s-1 pc-1
( rad s-1) at AU ()
to km s-1 pc-1
( rad s-1) at AU ().
At a radius AU, our C18O(1-0) and C18O(2-1)
observations suggest an even smaller angular velocity,
km s-1 pc-1 (
rad s-1).
On scales smaller than the beam, the intrinsic rotation velocity pattern
is uncertain due to insufficient spatial resolution
(the beam HWHM angular radius is at 3 mm, corresponding to
a physical radius of AU).
However, two indirect arguments suggest that the differential rotation
pattern observed here between AU and AU continues
down to smaller ( AU) scales. First, such a differential
rotation pattern, combined with a lower level of molecular
depletion near envelope center in N2H+ (cf. § 3.4 and
§ 4.2 below), would explain the higher velocity gradient
(10 km s-1 pc-1) measured in N2H+(101-012)
over compared to the other three lines shown
in Fig. 3.
Second, using NH3 interferometric observations sensitive to
scales, Wootten, Wiseman & Fuller (2001) have
recently reported an even larger gradient ( km s-1 pc-1)
than our present N2H+ value.
3.3 Spectroscopic signature of collapse
As already pointed out by AMB99, the classical spectroscopic signature of infall motions (cf. Evans 1999; Myers, Evans & Ohashi 2000) is seen toward IRAM 04191. Optically thick lines such as CS(2-1), CS(3-2), CS(5-4), H2CO(212-111) and H2CO(312-211) are double-peaked and skewed to the blue, while low optical depth lines such as C34S(2-1) and C34S(3-2) peak in the dip of the self-absorbed lines (see spectra observed at the central position in Fig. 5). Blue-skewed CS(2-1) and CS(3-2) spectra are observed in an extended region, up to an angular radius of at least (5600 AU) from source center (see cut taken perpendicular to the outflow axis in Fig. 8 below). Such asymmetric line profiles with a blue peak stronger than the red peak are expected in a collapsing envelope when the line excitation temperature increases toward the center. There is therefore strong evidence for the presence of extended inward motions in the IRAM 04191 envelope.
The blue-to-red peak intensity ratio of the CS lines is weaker toward the south-east (i.e. the envelope hemisphere red-shifted by rotation), while the asymmetry is stronger toward the north-west (i.e. the hemisphere blue-shifted by rotation) where the red peak is even barely visible. This behavior is in qualitative agreement with the expected distortion of the infall asymmetry due to rotation when the rotation velocity does not dominate over the infall velocity444When the rotation velocity becomes comparable to the infall velocity, the asymmetry may even be reversed (e.g. Walker, Narayanan & Boss 1994; Ward-Thompson & Buckley 2001). (Zhou 1995).

The dips of the optically thick CS(2-1), CS(3-2), and CS(5-4) lines have velocities of km s-1, km s-1, and km s-1, respectively, and are redshifted relative to the source systemic velocity of km s-1 (see Fig. 5). The latter value results from a 7-component Gaussian fit to the N2H+(1-0) multiplet, using the hyperfine structure (hfs) method of the CLASS reduction software, and assuming the relative frequencies and intensities of the 7 hyperfine components determined by Caselli et al. (1995), and the N2H+(101-012) rest frequency of Lee, Myers & Tafalla (2001) (see Table 1). The uncertainty on the Lee et al. (2001) frequency is estimated to be km s-1, to which we conservatively add (in quadrature) an uncertainty of 0.015 km s-1 arising from a maximum pointing error of , given the velocity gradient discussed in § 3.2 above. This gives a final uncertainty of km s-1 on the source systemic velocity. The dips of the self-absorbed CS(2-1), CS(3-2), and CS(5-4) spectra are thus redshifted relative to the systemic velocity by km s-1, km s-1, and km s-1, respectively. These absorption dips are presumably produced by the outer layers of the front hemisphere of the envelope. The fact that they are redshifted provides a second indication that inward motions are present in the outer envelope where the opacity of the CS lines is of order unity. More quantitatively, the main-beam brightness temperature of the dip in the central CS(2-1) spectrum is K, which matches the peak temperature of the spectra taken at from source center. These spectra are still optically thick since we measure a CS(2-1) to C34S(2-1) integrated intensity ratio of only , i.e., times less than the standard CS to C34S isotopic ratio of (Wilson & Rood 1994). Assuming a spherically symmetric envelope, we conclude that the absorbing shell producing the dip in the central CS(2-1) spectrum has an angular radius larger than . The observed km s-1 redshift of the dip is thus suggestive of inward motions km s-1 extending up to a radius of at least AU. Radiative transfer simulations confirm this conclusion (see Sect. 4 below).
On the other hand, the CS(5-4) emission is much more concentrated spatially than the CS(2-1) emission, and confined to the inner (FWHM) region (see the non-detection at in Fig. 8 below). The radius of the shell producing the absorption dip in the central CS(5-4) spectrum must therefore be smaller than . The observed km s-1 redshift of the CS(5-4) dip then suggests faster inward motions in the central ( AU) region.
3.4 Linewidths: Evidence for turbulent infall ?
The C34S(2-1) and C34S(3-2) spectra displayed in Fig. 5 are slightly asymmetric and skewed to the blue, which suggests they are marginally optically thick and showing some infall asymmetry (see, e.g., Fig. 1 of Myers et al. 1995). We measure (FWHM) linewidths of km s-1 for C34S(2-1) and km s-1 for C34S(3-2), which are 3.8 and 3.2 times larger than the thermal broadening of C34S at a kinetic temperature T K, respectively (see § 4.1 for constraints on TK). Radiative transfer simulations (cf. Sect. 4) indicate opacities of and for C34S(2-1) and C34S(3-2), respectively. Therefore, line saturation effects cannot broaden the C34S(2-1) and C34S(3-2) spectra by more than and , respectively, and the linewidths are primarily nonthermal. Motions such as infall, rotation, outflow, or “turbulence” along the line of sight are required to explain such nonthermal linewidths. The nonthermal motions do not dominate over thermal motions, however, since the C34S(2-1) and C34S(3-2) linewidths represent only of the thermal velocity dispersion for a mean particle of molecular weight . The N2H+(101-012) line is slightly broader, with a FWHM km s-1, i.e., 1.2 times broader than the (mean particle) thermal velocity dispersion and times larger than the C34S linewidths. The hyperfine structure fit to the N2H+ multiplet (see § 3.3) yields an optical depth of for the isolated N2H+(101-012) component, suggesting negligible () optical depth broadening. The level of optical depth broadening should thus be more pronounced in C34S and cannot explain the difference in linewidth between N2H+ and C34S.
We propose that this difference in linewidth between N2H+ and C34S results from a combination of higher infall/rotation velocities and lower N2H+ depletion toward the center. Bergin & Langer (1997) have shown that sulphur-bearing molecules such as CS are strongly depleted when the density increases, whereas N2H+ remains in the gas phase, at least up to densities n cm-3. Indeed, we measure a decrease of the C34S(2-1)/N2H+(101-012) integrated intensity ratio by a factor of 2 from AU to AU. As both lines have nearly the same critical density and are approximately optically thin555Based on the opacities derived above, optical depth effects cannot account for more than a factor of 1.3 decrease in the C34S(2-1)/N2H+(101-012) ratio., the decrease of the integrated intensity ratio may be interpreted as a decrease of the C34S/N2H+ abundance ratio toward the center.
Finally, we note that the N2H+(101-012) linewidth peaks at the central position (as shown by a linewidth-position plot along the direction perpendicular to the ouflow axis). N2H+ may thus be more sensitive to higher velocity material produced by, e.g., infall, rotation, or outflow near the central protostellar object. As N2H+ is generally underabundant in molecular outflows (e.g. Bachiller & Pérez-Gutiérrez 1997), the central broadening of N2H+(1-0) is most likely due to infall and/or rotation motions.
3.5 The CS line wing emission
The morphology of the single-dish CS(2-1) maps integrated over the 4.6–6.1 km s-1 (blue) and 7.1–8.6 km s-1 (red) velocity ranges strongly suggests that the CS line wing emission is dominated by material associated with the outflow (see Fig. 6a & Fig. 6b). Some CS(2-1) emission is detected at the edges of both the red and the blue lobe of the CO outflow: the CS(2-1) red wing is relatively weak and concentrated at the south-eastern edge and the tip of the red CO lobe (Fig. 6a), while the CS(2-1) blue wing is much stronger and distributed in two spots on either side of the blue CO lobe (Fig. 6b). This “high-velocity” CS(2-1) emission is likely to arise from dense, shocked material entrained by the outflow.
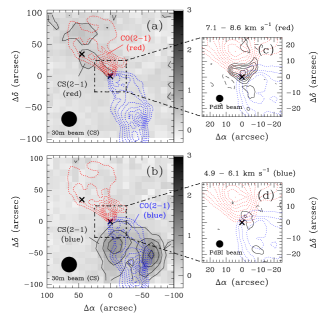
The redshifted CS(2-1) emission detected on smaller scales by the PdBI interferometer in the 7–8 km s-1 velocity range also appears to be associated with the outflow. This emission arises from the base of the red CO lobe and its shape closely follows the edges of the outflow lobe (see Fig. 6c). No emission was detected by PdBI in the blue wing range (see Fig. 6d) or at the source systemic velocity. The blueshifted CS(2-1) emission seen in the single-dish map (Fig. 6b) thus appears to be more extended than the redshifted emission and is likely resolved out by the interferometer. Such a difference in spatial extent between blueshifted and redshifted emission, opposite to what infall motions would produce, is expected if the CS line wing emission arises from outflowing material. Likewise, the emission detected by the 30m telescope near the systemic velocity, i.e., close to the dip of the CS(2-1) line (Fig. 5), arises from extended foreground material on scales (see § 3.3) and is also resolved out by PdBI.
3.6 Low degree of ionization
Following, e.g., Caselli et al. (1998), we can estimate the degree of ionization in the IRAM 04191 envelope from the observed value of the abundance ratio R. We measure an integrated intensity ratio at the central position. Assuming optically thin H13CO+(3-2) and DCO+(3-2) emission, this implies H13CO+. Adopting a abundance ratio of 77 in the local ISM (Wilson & Rood 1994), we thus derive R, which is identical to the ratio measured by Caselli et al. (2001b) toward the central position of L1544. As the same density ( cm-3) is probed by the observations in both cases, we conclude that the ionization degree derived in L1544 by Caselli et al. (2001b) based on their chemical models should be representative of the ionization degree in the IRAM 04191 envelope at this density (assuming similar depletion factors for CO, which seems likely – see § 4.2 below).
4 Radiative transfer modeling: 1D spherical simulations
Here, we use the radiative transfer code MAPYSO (Blinder 1997) to model the observed line spectra and set quantitative constraints on the kinematics of the IRAM 04191 envelope (see Appendix for details about the code). For simplicity, we use a piecewise powerlaw description for the spatial variations of the kinetic temperature, density, molecular abundance, infall velocity, and rotational velocity (in Sect. 5 below) across the envelope (see Fig. 7).
4.1 Model inputs: mass distribution and kinetic temperature profile

We use the envelope mass distribution derived by Motte & André (2001) (hereafter MA01) from 1.3 mm dust continuum observations with the 30m telescope. MA01 estimate that the envelope mass contained within a radius of 4200 AU is M⊙ with an uncertainty of a factor of 2 on either side, assuming a mean dust temperature K obtained by AMB99 from a graybody fit to the m portion of the SED (see Fig. 3 of AMB99). In addition, the radial structure analysis of MA01 indicates an average radial intensity profile with in the range of angular radii (i.e., 1500-14000 AU). Assuming a dust temperature profile with , MA01 obtain a density profile with . Given the low bolometric luminosity of IRAM 04191, the dust temperature is indeed expected to rise outward () due to external heating by the interstellar radiation field (e.g. Masunaga & Inutsuka 2000; Evans et al. 2001; Zucconi, Walmsley & Galli 2001). The regime of central heating by the accreting protostar () is likely confined to the inner AU radius region (cf. MA01). Since a good thermal coupling between gas and dust grains is expected for densities cm-3 (e.g. Ceccarelli et al. 1996; Doty & Neufeld 1997), the gas kinetic temperature profile should track the dust temperature profile, at least up to a radius of AU.
We also have some constraints on the gas kinetic temperature from our C18O, N2H+, and CS observations. We measure a C18O(2-1) to C18O(1-0) integrated intensity ratio in the range of angular radii , using main beam temperatures and after degrading the resolution of the data to that of the data. As the critical densities of C18O(1-0) and C18O(2-1) are cm-3 and cm-3 at 10 K, respectively, both lines should be thermalized in most of the envelope. Assuming local thermodynamic equilibrium (LTE) and optically thin emission, we derive an excitation temperature K, which should be a good estimate of the gas kinetic temperature in the low-density outer ( AU) part of the envelope probed by C18O. Likewise, the excitation temperature of the dense-gas tracer N2H+(101-012) may be estimated from the relative intensities of the seven components of the N2H+(1-0) multiplet, assuming the same excitation temperature for all components (cf. § 3.3). This method yields K. With a critical density cm-3, the N2H+(1-0) multiplet is probably thermalized only in the inner ( AU) envelope. We thus obtain a lower limit of K for the gas kinetic temperature in the dense ( cm-3), inner part of the envelope. Finally, the weak intensities of the optically thick CS(2-1) and CS(3-2) lines require a low gas kinetic temperature 6-7 K in the range of radii AU. Given the density profile shown in Fig. 7a, a uniform gas temperature of 10 K would produce CS(2-1) and CS(3-2) spectra with main beam temperatures about 1-2 K stronger than the observed temperatures. Beyond AU, the gas temperature is likely to increase to the typical K temperature of the Taurus cloud (see, e.g., Benson & Myers 1989). However, the gas temperature profile in the outer parts of the envelope has little influence on the CS and C34S spectra since the observed lines are far from LTE there.
In summary, the gas kinetic temperature profile is likely to present a minimum of K at (i.e., 1400-2800 AU) and to reach a value of K in the outer parts of the envelope.
4.2 Molecular depletion
Assuming a standard isotopic ratio , a abundance ratio of is required to match the C34S(2-1) integrated intensity at an angular radius . But a uniform abundance with such a value produces too strong C34S(2-1), C34S(3-2), and CS(5-4) spectra toward the center. A good fit to the C34S(2-1) integrated line intensities is obtained by assuming that the relative CS abundance drops by a factor of toward the center (see also § 3.4). Such a depletion factor for CS is comparable to those observed in starless cores such as L1544 (e.g. Tafalla et al. 2002).
4.3 Two regimes of infall
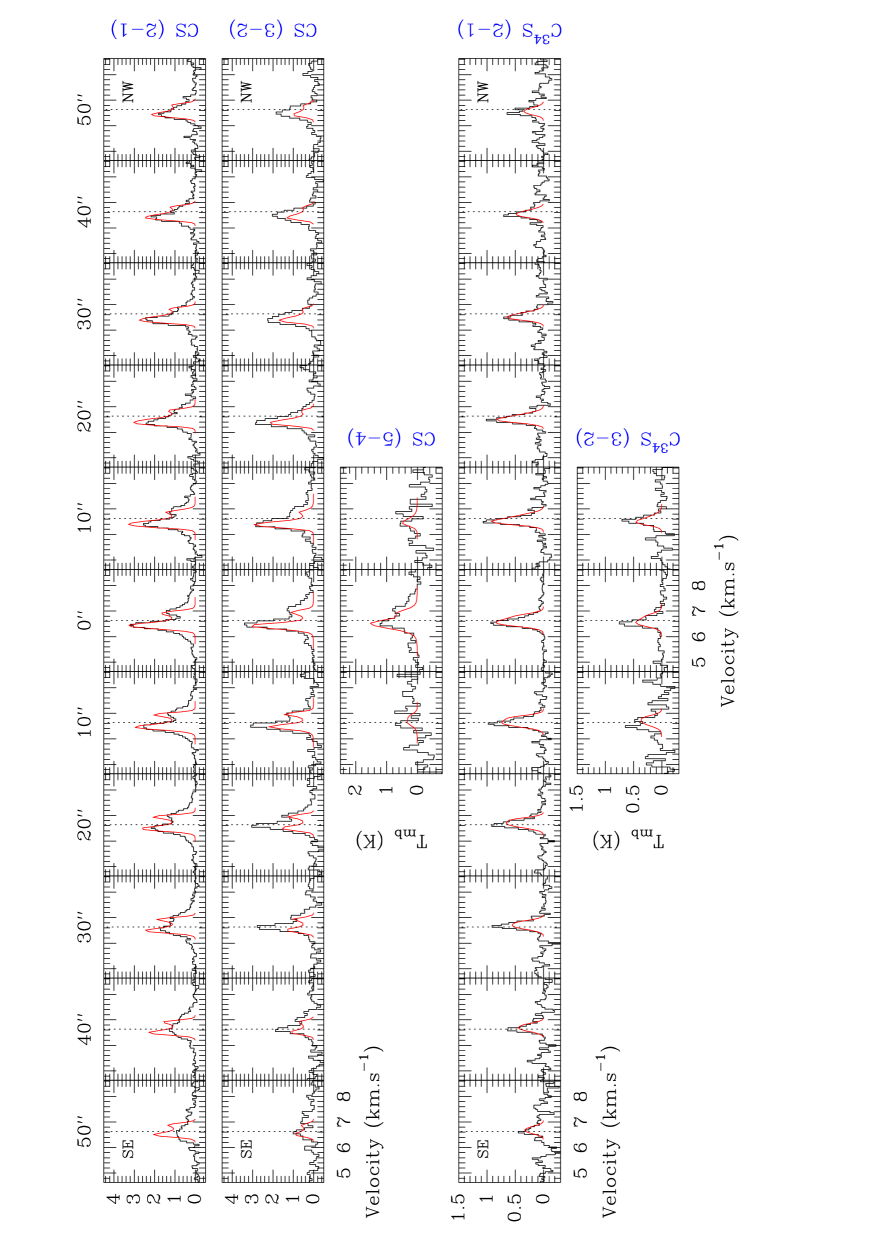
In Fig. 8, we present a series of synthetic spectra emitted by a spherically symmetric model envelope with the input structure shown in Fig. 7 and our best estimate of the infall velocity field (shown by the solid line in Fig. 12a below). The model spectra are overlaid on the multitransition CS and C34S spectra observed along the direction perpendicular to the outflow axis, so as to minimize the effects of the outflow. The blue infall asymmetry of the model optically thick lines and the position of the CS(2-1) dip match the observations well. The widths of the optically thin lines are also well reproduced. The main shortcoming of the model is that it does not reproduce the fairly strong emission present in the wings of the observed CS spectra. As discussed in § 3.5, we attribute these wings to the fraction of envelope material entrained by the outflow.
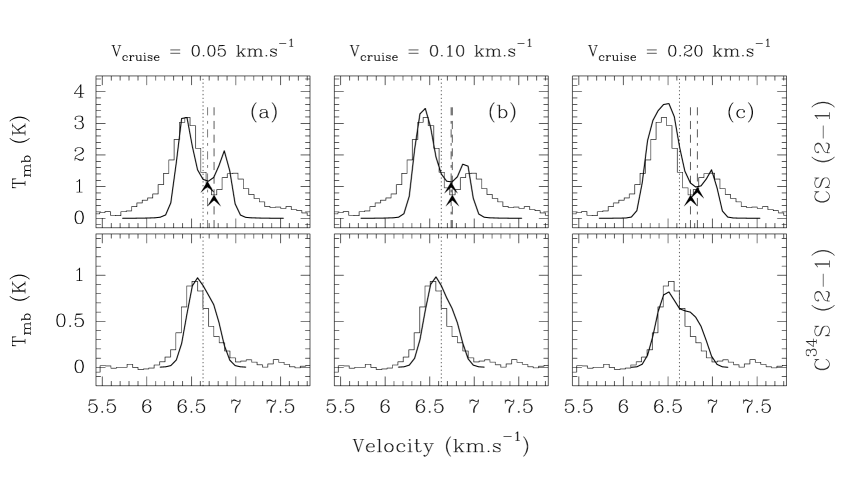
In order to determine the range of input model parameters that yield reasonably good fits to the observed CS and C34S spectra, we have performed a comprehensive exploration of the parameter space, as illustrated in Figs. 9, 10 and 11. Strong constraints on the infall velocity arise from the small optical depth lines, i.e., C34S(2-1) and C34S(3-2). The widths of these lines set firm upper limits to the absolute value of the infall velocity on the size scale of the beam. We obtain km s-1 at AU and km s-1 at AU from C34S(2-1) and C34S(3-2), respectively. On the other hand, the amplitude of the blue asymmetry seen in the self-absorbed CS(2-1) and CS(3-2) lines, as well as the redshifted position of the corresponding absorption dips (see § 3.3), both require a relatively flat, extended infall velocity field with km s-1 up to AU. The latter value approximately corresponds to the radius where the bulk of the absorption occurs in CS(2-1) and CS(3-2) (see § 3.3). These constraints are illustrated in Fig. 9 which shows the effect of varying the infall velocity field on the central CS(2-1) and C34S(2-1) spectra. Three models are compared: the preferred model displayed in Fig. 8 is shown in the central panel (Fig. 9b), while models with lower and higher infall velocities in the outer part of the envelope are shown in the left (a) and right (c) panels, respectively. It can be seen that the position of the CS(2-1) absorption dip is not redshifted enough in model (a) and too redshifted in model (c) to match the observations. Furthermore, the CS(2-1) blue-to-red asymmetry is too weak in model (a) and the C34S(2-1) line becomes too broad in model (c) compared to the observations. Only model (b) approximately reproduces the observed position of the CS(2-1) dip and the width of the C34S(2-1) line.
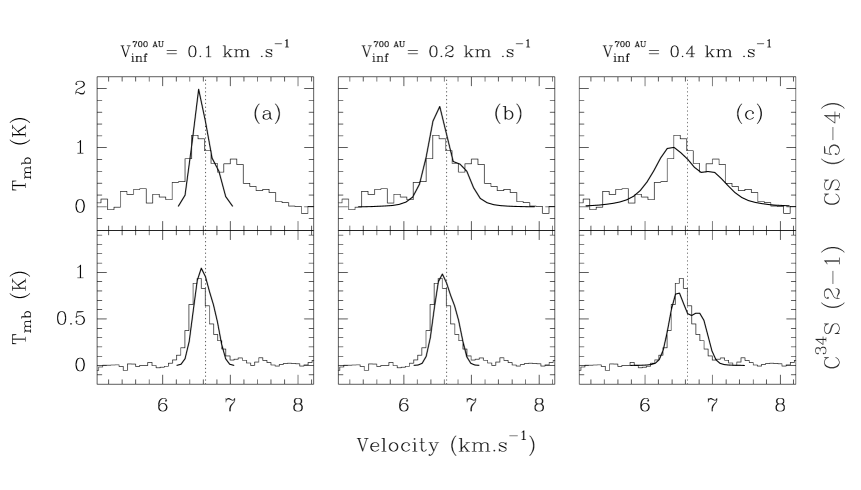
In the context of a pure infall model, larger velocities ( km s-1) in the inner ( AU) part of the envelope are suggested by the broad linewidth of the central CS(5-4) spectrum. This is shown in Fig. 10 which compares three models differing in the magnitude of their infall velocity at 700 AU. A similar trend is indicated by the broadening of the N2H+(101-012) line toward the center (cf. § 3.4). However, the central CS(5-4) spectrum (which does show infall asymmetry – cf. Fig. 5) may be partly contaminated by small-scale structure in the outflow. In particular, the redshifted portion of the CS(5-4) spectrum, not reproduced by the model of Fig. 8, may be related to the redshifted CS(2-1) emission detected by the interferometer on small scales (see § 3.5). Such a switch between infall-dominated CS emission on large scales and outflow-dominated CS emission on small scales is also observed in the Class 0 object B335 (cf. Wilner et al. 2000).
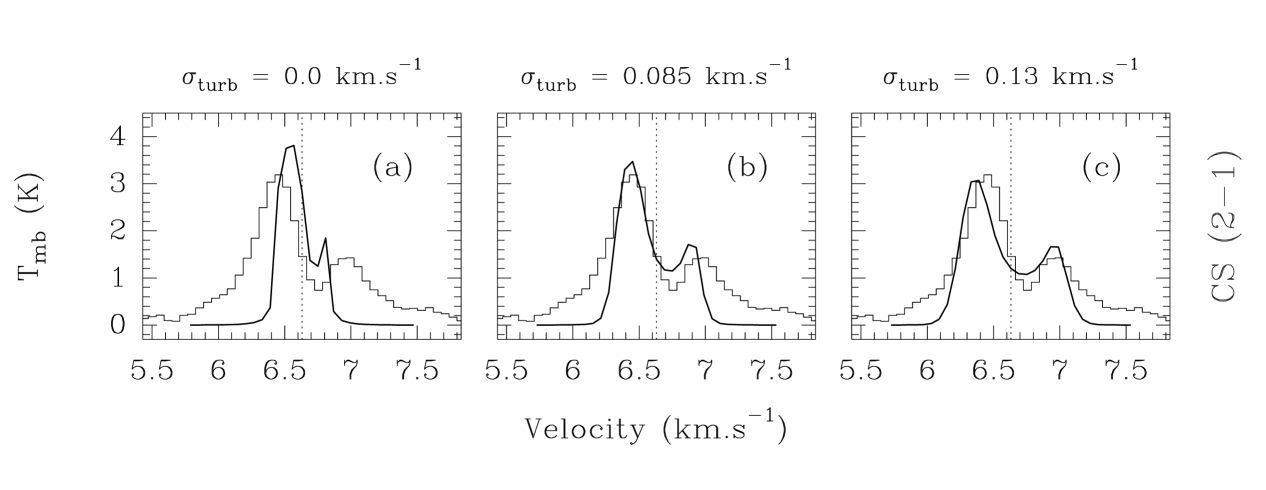
In addition to infall, a “turbulent” velocity field is needed to match the width of the dip, and consequently the velocity difference between the blue and the red peak, in the optically thick CS(2-1) and CS(3-2) spectra. Assuming a uniform turbulent velocity dispersion for simplicity, a good compromise between the upper limit set by the linewidth of the optically thin C34S(2-1) and C34S(3-2) spectra and the lower limit set by the width of the CS(2-1) and CS(3-2) dips is obtained for km s-1 (cf. Fig. 11). This is equivalent to km s-1 and corresponds to only half the thermal broadening of the mean molecular particle at 10 K, showing that the IRAM 04191 envelope is “thermally-dominated” (see also § 3.4) as are Taurus dense cores in general (e.g. Myers 1999).
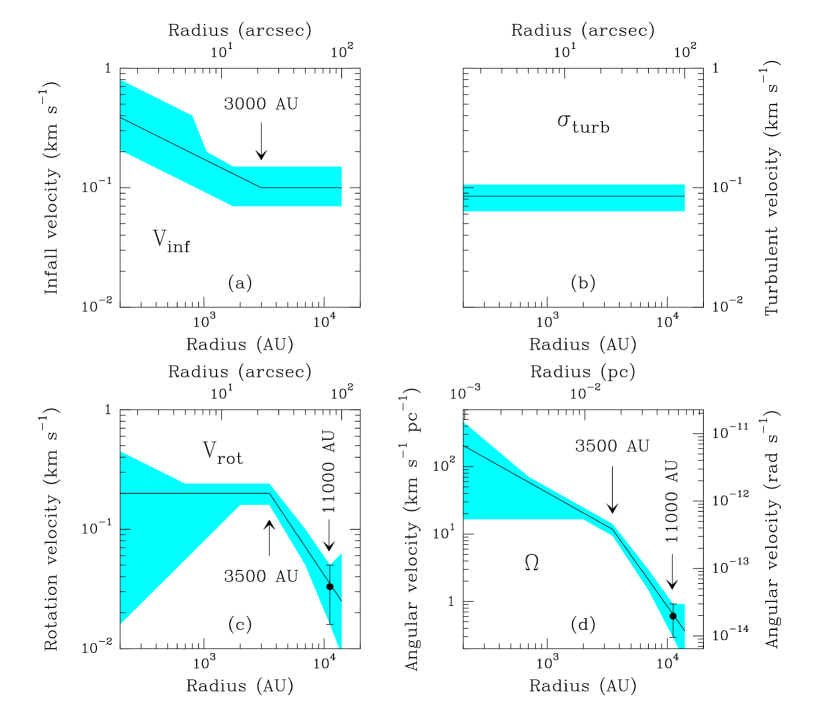
The main conclusions of our 1D exploration of the parameter space are summarized in Fig. 12a and Fig. 12b, where the shaded areas represent the ranges of infall velocities (a) and turbulent velocity dispersion (b) for which acceptable fits are found. Two infall regimes seem to stand out in Fig. 12a: the infall velocity is relatively large ( km s-1, supersonic) and increases toward the center for AU, while it is smaller and roughly uniform at km s-1 between AU and AU. Given the density profile of Fig. 7a, such an infall velocity field implies a mass infall rate of M⊙ yr-1 at AU. (The density and velocity profiles shown in Fig. 7a and Fig. 12a are such that is roughly independent of radius.) Inside the AU region (where non-zero inward motions are inferred), the fraction of envelope mass with supersonic ( km s-1) infall velocities is estimated to be only , depending on the exact value of the sound speed and exact form of the infall profile (see Fig. 12a).
5 Radiative transfer modeling: Simulations with infall and rotation
5.1 Quasi 2D simulations
To account for the effects of rotation in the envelope (see § 3.2 and Fig. 3), we have performed “quasi”-2D simulations with the following approximation. The non-LTE level populations are still calculated with a 1D Monte Carlo method (see Appendix) assuming a spherical envelope with the same characteristics as the model described in § 4.3. We then add a cylindrical rotation velocity field to the 1D model of § 4.3 and use the 2D version of the MAPYSO code to compute a proper radiative transfer integration along each line of sight. If we ignore departures from a spherical density distribution, this approach would remain strictly exact in the case of solid-body rotation, since the velocity difference between any couple of points projected on the axis joining these points is insensitive to the addition of a solid-body rotation component (cf. Ward-Thompson & Buckley 2001). In practice, however, the rotation observed here departs from solid body and the density distribution is not spherical. We therefore assume that, to first order, the line excitation is much more sensitive to the density distribution (averaged over angles) than to the velocity field. (In particular, we have checked that the profiles of excitation temperature are essentially insensitive to the infall velocity field as long as the turbulent velocity dispersion is of the same order as the infall velocity.) The rotation velocity field has nevertheless important effects on the shape of the line profiles, which we properly take into account here.
5.2 Two regimes of rotation
The cylindrical rotation velocity field that we have added to the 1D spherical model of § 4.3 is shown in Fig. 12c. The rotation axis is taken to coincide with the outflow axis, at an inclination angle to the line of sight (see § 1.2) and a position angle P.A. in projection onto the plane of the sky (cf. Fig. 1).
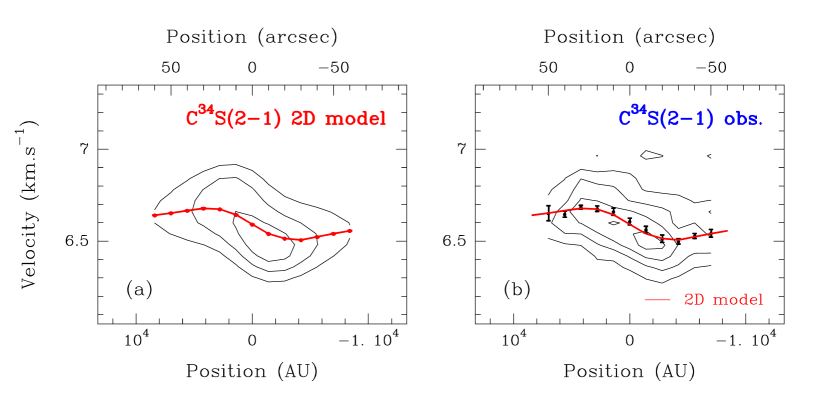
Adding rotation yields two major improvements in the fits to the CS and C34S spectra (see Fig. 13 and Fig. 14). First, the velocity gradient of the small optical depth C34S(2-1) line along the direction perpendicular to the outflow is well reproduced, as shown in Fig. 13. Both the model C34S(2-1) position-velocity diagram (Fig. 13a) and the centroid velocity curve agree well with the observations (Fig. 13b).
Second, the blue asymmetry of the model CS(2-1) and CS(3-2) spectra is enhanced toward the north-west and attenuated toward the south-east, as seen on the observed spectra (see § 3.3 and Fig. 14).
In agreement with the discussion of the position-velocity diagrams (§ 3.2 above), the present 2D modeling indicates that the envelope can be divided into two regions with distinct rotational characteristics (see the radial profiles derived for the rotational velocity and angular velocity in Fig. 12c and Fig. 12d, respectively). First, solid-body rotation is ruled out in the outer AU radius envelope, where a good fit to the centroid velocity curve is obtained with , corresponding to an angular velocity . Second, in the inner AU radius region, our simulations suggest a velocity profile , i.e., , although the form of the position-velocity diagram is significantly influenced by the finite resolution of the observations. A rotation velocity km s-1, corresponding to km s-1 pc-1, is derived at a radius AU after correcting for inclination666The reason why the value of km s-1 pc-1 found here for is larger than the apparent velocity gradient of km s-1 pc-1 given in § 3.2 is that the 2D model shown in Fig. 13 properly accounts for the finite () resolution of the observations..
6 Discussion: Comparison with collapse models
In this section, we first summarize the predictions of collapse models and the main constraints derived from our observations (§ 6.1 and § 6.2), and then discuss the applicability of various models to IRAM 04191 (§ 6.3 to § 6.5). Some implications for the distribution and evolution of angular momentum during protostellar collapse are discussed in § 6.6.
6.1 Overview of model predictions
Whitworth & Summers (1985) have shown that there is a two-dimensional continuum of similarity solutions to the problem of isothermal spherical collapse. In this continuum, the well-known solutions proposed by Shu (1977) and Larson (1969)-Penston (1969) represent two extreme limits. All isothermal similarity solutions share a universal evolutionary pattern. At early times (), a compression wave (initiated by, e.g., an external disturbance) propagates inward at the sound speed, , leaving behind it a density profile and a uniform infall velocity field. This compression wave has zero amplitude in the limiting case of the Shu ‘inside-out’ collapse solution. At , the compression wave reaches the center and a point mass forms which subsequently grows by accretion. At later times (), this wave is reflected into a rarefaction or expansion wave, propagating outward (also at the sound speed) through the infalling gas, and leaving behind it free-fall density and velocity distributions (i.e., and ). The various solutions can be distinguished by the absolute values of the density and velocity at . The Shu (1977) solution has the density distribution of a static () singular isothermal sphere (SIS) at , while the Larson-Penston (1969) solution is times denser and far from equilibrium (). The recent finding of inward motions of subsonic amplitude km s-1, extended over pc ( AU) in the prestellar core L1544 (see Tafalla et al. 1998; Williams & Myers 1999; Caselli et al. 2001a) suggests that true protostellar collapse in Taurus proceeds in a manner which is neither the Shu nor the Larson-Penston flow, and is perhaps more reminiscent of an intermediate similarity solution.
In practice, the initial conditions for fast protostellar collapse are not strictly self-similar and involve a density profile that is flat at small radii (e.g. Ward-Thompson et al. 1994; André, Ward-Thompson & Motte 1996) and bounded or sharp-edged at some outer radius (e.g. Motte, André & Neri 1998; Bacmann et al. 2000) like a finite-sized Bonnor-Ebert isothermal sphere (e.g. Bonnor 1956; Alves et al. 2001). A number of recent numerical (magneto)hydrodynamic simulations or simplified analytical calculations attempt to describe the collapse in such a situation, either in the absence (e.g. Foster & Chevalier 1993; Henriksen et al. 1997; Masunaga, Miyama & Inutsuka 1998; Hennebelle et al. 2002) or in the presence (e.g. Tomisaka 1996; Basu 1997; Safier, McKee & Stahler 1997; Li 1998; Ciolek & Königl 1998) of magnetic fields. The Larson-Penston similarity solution is found to describe the collapse quite satisfactorily near (at least for small radii), but the Shu solution is more adequate at intermediate times, before the expansion wave reaches the edge of the initial, pre-collapse dense core.
When rotation is included, a rotationally-supported disk develops at the center of the infalling envelope during the accretion phase (i.e. at ). The size scale of this disk is determined by the centrifugal radius, , which defines the position where the centrifugal force balances gravity in the equatorial plane. Strong departures from a spherical density distribution and a purely radial inflow in the envelope are expected to occur on size scales of order (or smaller than) (cf. Chevalier 1983; Hartmann 1998). Most collapse models predict that should increase with time as material of higher and higher specific angular momentum falls in, but the exact dependence on time , or alternatively accumulated central mass , varies from model to model, according to the distributions of mass and angular momentum at . For instance, scales as or in the Shu model (TSC84), which assumes solid-body rotation at point mass formation. By contrast, the dependence of on is only linear in the magnetically-controlled collapse model of Basu (1998) (see also Krasnopolsky & Königl 2002).
6.2 Summary of observational constraints
The analysis of our line observations (§ 4 and
§ 5) indicates that
both the infall and rotation velocity fields of the IRAM 04191 envelope
are characterized by an inner and an outer regime (see Fig. 12).
Our 1D radiative transfer simulations (§ 4)
indicate that the infall velocity profile is flat with km s-1 between AU and AU. Higher infall velocities at radii are
suggested the CS observations, which are consistent with a free-fall velocity
field () at .
The width of the optically thin C34S lines strongly constrains
to be km s-1 at
(cf. Fig. 12a).
The position-velocity diagrams observed in optically thin lines (§ 3.2) show that the envelope is differentially rotating with an angular velocity profile between AU and AU, and km s-1 pc-1 at . Although the limited spatial resolution of our observations prevents us from deriving accurate values in the inner region, the rotation profile is definitely shallower for (cf. Fig. 12d). A follow-up interferometric study is underway to provide more accurate constraints on the angular velocity in this inner region.
Although the two critical radii and differ by less than a factor of , it is unclear whether they are physically related or not. The inner envelope may correspond to the free-fall region developing inside the expansion wavefront, while the outer envelope may be dominated by the flat, extended inward velocity field set up by the compression wave at (see § 6.1 above). If the current radius of the expansion wave is indeed , then the age of the central protostellar object should be yr (assuming a propagation speed km s-1), in rough agreement with the estimated age of yr (§ 1.2). On the other hand, the fastly rotating region may be a dynamically collapsing ‘supercritical’ core in the process of decoupling from the ambient medium, and the outer envelope may be a transition region between the protostar and the background cloud (see § 6.5 below).
6.2.1 Centrifugal support
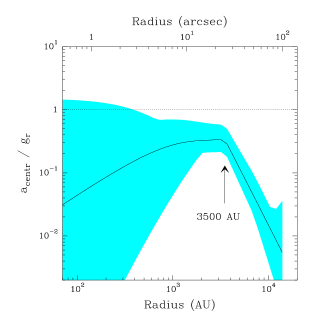
Using our derived model for the structure and kinematics of the IRAM 04191 envelope (e.g. Fig. 7 and Fig. 12), we can estimate the dynamical importance of rotation in the envelope. The ratio of the centrifugal acceleration to the local gravitational field is shown in Fig. 15. Here, is the envelope mass within radius corresponding to the density profile of Fig. 7a, and is the uncertain mass of the central protostellar object (cf. AMB99). We estimate a ratio at the radius AU of the rapidly rotating inner envelope, showing that the centrifugal acceleration is a sizeable fraction of the gravitational acceleration in this region. Comparable values of are nevertheless obtained in some magnetic models of cloud collapse (see Fig. 4 of Basu & Mouschovias 1994 and § 6.5 below).
We estimate the centrifugal radius to be AU, assuming the maximum rotation velocity profile consistent with the observations (cf. Fig. 12c) and a stellar mass . In principle, a large centrifugal radius should imply the presence of a large centrifugal disk around the central object. Stahler et al. (1994) have investigated the initial growth of protostellar disks in the context of the rotating collapse picture of TSC84 and have shown that a 3-component structure should develop inside : a dense inner accretion disk of radius , a ring where material and angular momentum pile up at , and a low-density outer disk where material travels at high velocity between and . If AU, we may thus expect AU. Our 1.3 mm continuum interferometric observations set a firm upper limit to the radius of any dense inner circumstellar structure around IRAM 04191: AU (cf. § 3.1). This suggests that the actual centrifugal radius is significantly smaller than 200 AU or else that the presence of a protostellar companion at AU may have cleared a substantial gap in the inner accretion disk (cf. Jensen, Mathieu & Fuller 1996). Artymowicz & Lubow (1994) show that, due to tidal disk truncation in binary systems, any individual disk must have an outer radius less than half the binary separation, and any circumbinary disk must have an inner radius more than roughly twice the binary separation. The non-detection of a dense AU radius disk by the PdBI interferometer could thus be accounted for by this effect if IRAM 04191 were a protobinary of separation AU (i.e. ).
6.3 Problems with the inside-out collapse model
The inside-out, isothermal collapse model described by Shu (1977), and its 2D extension including rotation (TSC84), has been widely used to explain the infall spectral signature seen in the envelopes of low-mass protostars (e.g. Zhou et al. 1993; Myers et al. 1995; Choi et al. 1995; Zhou et al. 1996; Hogerheijde & Sandell 2000). It accounts relatively well for the densities and accretion rates measured in Taurus protostellar envelopes (e.g. Ohashi 1999; Motte & André 2001 ; this paper). This model is, however, inconsistent with the combined density and infall velocity profiles measured for IRAM 04191 (cf. Fig. 7a and Fig. 12a). An expansion wave radius AU is indeed required to reproduce the blue asymmetry of the central CS(2-1) spectrum in the context of the inside-out collapse picture. But such a large infall radius then implies high infall velocities at small radii AU which in turn yield central C34S(2-1) and C34S(3-2) spectra that are 2–3 times too wide compared to the observed linewidths. Conversely, a model with an expansion wave radius of only AU yields correct C34S(2-1) and C34S(3-2) linewidths but fails to reproduce the strong asymmetry observed in CS(2-1) and CS(3-2). It is clearly because of the absence of significant inward motions at that the inside-out collapse model cannot account for the infall velocity profile observed here. A similar inconsistency with the inside-out collapse model has been noted previously in prestellar cores such as L1544 by Tafalla et al. (1998) and Lee, Myers & Tafalla (2001).
6.4 Comparison with other thermal models of collapse
With an age yr for the central IRAM 04191 protostellar object (see § 1.2 and § 6.2) and a sound speed km s-1 ( K), the radius of the expansion wave must be smaller than the inner radius AU of the extended region where a flat infall velocity field is inferred (see Fig. 12a). The kinematics and density structure of the outer envelope should thus still reflect the physical conditions at . Accordingly, the observation of substantial infall velocities between and AU points to collapse models that are more dynamical than the Shu solution and involve the propagation of a finite-amplitude compression wave prior to the formation of the central object (cf. § 6.1 and Whitworth & Summers 1985). On the other hand, the infall velocities derived in the outer () envelope are only subsonic (approximately half the sound speed), and clearly inconsistent with the supersonic infall velocities characterizing the Larson-Penston isothermal similarity solution at (cf. § 6.1). The infall velocity field derived here (cf. Fig. 12a) is suggestive of a moderately dynamical collapse model, intermediate between the Shu similarity solution (zero-amplitude compression wave at ) and the Larson-Penston solution (strong compression wave at ).
Qualitatively at least, such a moderately dynamical infall velocity field resembles that achieved during the collapse of a finite-sized, Bonnor-Ebert isothermal sphere. For instance, in their numerical simulations of the collapse of critically stable Bonnor-Ebert spheres (without magnetic field or rotation), Foster & Chevalier (1993) found infall velocities at ranging from near the origin to 0 at the outer boundary radius. Assuming that the IRAM 04191 dense core was initially a marginally stable Bonnor-Ebert sphere with a center-to-edge density contrast of , the central density at the onset of collapse must have been cm-3, given the typical outer density cm-3 observed in prestellar cores (e.g. Bacmann et al. 2000). Adopting a temperature of 10 K, Fig. 1 of Foster & Chevalier (1993) then predicts an infall velocity at varying from km s-1 at AU to km s-1 at AU. Even if this represents a somewhat stronger variation of infall velocity with radius than derived in the case of IRAM 04191 (Fig. 12a), the Foster & Chevalier model clearly provides a much better fit to the observations than either the Shu or the Larson-Penston similarity solution. A definite problem with the critical Bonnor-Ebert model, however, is that as much as 44% of the envelope mass is predicted to flow in supersonically at (Foster & Chevalier 1993), and progressively more mass at . This is much larger than the mass fraction derived in § 4.3 for IRAM 04191. We conclude that spherically symmetric collapse models in which thermal pressure provides the only force opposing gravity tend to be too dynamical and are only marginally consistent with our observational constraints. It is likely that the inclusion of rotation in thermal models would improve the comparison with observations and may even account for the flattened shape of the protostellar envelope seen in Fig. 1 (P. Hennebelle, private communication). However, a generic feature of rotating thermal collapse models is that, due to simultaneous conservation of energy and angular momentum, they tend to predict similar forms for the rotation and infall velocity profiles at radii (much) larger than the centrifugal radius (e.g. Saigo & Hanawa 1998). This is at variance with the steeply declining rotation velocity profile and flat infall velocity profile we observe beyond 3500 AU (a radius much larger than the estimated centrifugal radius – see § 6.2.1 above). In fact, the strong decline of the rotation velocity profile beyond 3500 AU suggests that angular momentum is not conserved in the outer envelope. In the next subsection, we propose that this results from magnetic braking.
6.5 Comparison with magnetically-controlled collapse models
Magnetic ambipolar diffusion models (e.g. Ciolek & Mouschovias 1994; Basu & Mouschovias 1994, 1995a, 1995b – hereafter BM94, BM95a, BM95b) are another class of models which yield non-zero inward velocities in an extended region prior to point mass formation. Ambipolar diffusion has been invoked by Ciolek & Basu (2000) to explain the extended inward motions observed in the Taurus prestellar core L1544 (see Tafalla et al. 1998; Williams & Myers 1999; Caselli et al. 2001a). The models start from a magnetically subcritical cloud, initially supported against gravitational collapse by a static magnetic field, and predict an evolution in two phases. During the first, quasistatic phase, the subcritical cloud contracts along directions perpendicular to the field lines through ambipolar diffusion. The gravitationally-induced inward drift of the neutral species is slowed down by collisions with the ions which are well coupled to the magnetic field. The central mass to magnetic flux ratio increases with time, until it reaches the critical value for collapse, . The inner region of the cloud then becomes magnetically supercritical and collapses dynamically, while the outer envelope remains subcritical. This effect introduces a spatial scale in the collapse process, which corresponds to the boundary between the magnetically supercritical inner core and the subcritical outer envelope. These two regions are characterized by distinct rotational properties. The supercritical inner core evolves with conservation of angular momentum and rapidly spins up. It achieves a power-law angular velocity profile at , where is the (mass) column density (e.g. Basu 1997). By contrast, due to magnetic braking, the subcritical envelope loses (part of) its angular momentum on the timescale (where is the free-fall time at the density of the background – cf. Spitzer 1978 and Tomisaka 2000) and is progressively brought to near corotation with the background medium, assumed to rotate at the uniform rate (e.g. BM94). This separation generates a break in the angular velocity profile at the radius of the magnetically supercritical core.
Qualitatively at least, the rotation and infall profiles of the
IRAM 04191 envelope (see Fig. 12 and § 6.2)
can be accounted for in the framework of
such magnetic models777Strictly speaking, the ambipolar diffusion
models of Basu & Mouschovias describe the evolution of core properties
only during the prestellar phase (), while the properties of the
IRAM 04191 envelope beyond AU are representative
of the physical conditions at (cf § 6.4).
However, the models are easily extrapolated
to by considering the limiting profiles achieved for an infinite central
density (cf. Basu 1997, 1998).
if we identify with the radius
AU beyond which the observed rotation profile exhibits
a marked steepening (cf. Fig. 12c).
Indeed, the angular velocity profile of the inner region is
consistent with the power law expected in the
supercritical core at .
Furthermore, the models predict a steepening of the
rotation profile beyond when magnetic braking does not have
enough time to bring the system to corotation with the background
before the formation of the supercritical core. In the parameter study
presented by BM95a and BM95b, this happens
in models 6 and 8, for two different reasons.
First, if the cloud is already critical (or close to critical)
initially near the center (but still
subcritical in its outer parts) as in model 6, there is no quasistatic phase
and the dynamical contraction of the supercritical core starts right away
on a timescale (free-fall time at cloud center)
shorter than .
This produces a transition region beyond with a steep angular
velocity profile between the supercritical inner core and the
background outer region (see Fig. 6b of BM95b).
At the same time, the collapse of the supercritical core is retarded by the
magnetic forces so that supersonic infall velocities develop only very close
to the center (at ).
Second, if the ionization fraction is low enough that the magnetic braking
timescale is only slightly shorter than the ambipolar diffusion timescale
as in model 8 of BM95a, then the supercritical core can begin
its dynamical evolution with a rotational angular velocity much larger than that
of the background. This also results in the apparition of a transition region
with a steep rotation profile between the supercritical core and the external
background (cf. Fig. 5 of BM95a).
In model 8 of BM95a,
the outer radius of the transition region is
, which is consistent with the extent of the
zone in Fig. 12d.
In this model, the infall velocity becomes supersonic for
and exhibits a relatively flat profile
beyond , also in agreement with the observational constraints
of Fig. 12a.
The ionization degree assumed in the model
is low ( at a density of cm-3),
but comparable to the value derived at the center of the
IRAM 04191 envelope in § 3.6.
Quantitatively, however, it is more difficult to obtain a good match of the observations of IRAM 04191 with published ambipolar diffusion models. These models rotate a factor of more slowly888Although rotating more slowly than the IRAM 04191 envelope, some of the models are characterized by high ratios of centrifugal to gravitational acceleration at the supercritical radius, comparable to the ratio observed here (cf. model 1 of BM94 and model 6 of BM95b). Qualitatively, a faster initial rotation rate is not expected to change the evolution significantly compared to model 6 of BM95b (S. Basu, private communication). than does the IRAM 04191 envelope and have supercritical core radii that are a factor bigger than the observed break radius AU (cf. Table 2 of BM95b). Physically, the radius of the magnetically supercritical core corresponds to the Jeans length for the density (or equivalently surface density ) at which “decoupling” occurs, i.e., the density (or surface density) at which gravity overcomes magnetic support. In the disk-like geometry of ambipolar diffusion core models, the critical Jeans radius is and one has (see BM95a). For K and AU, this gives cm-2 and cm-3, the latter being remarkably similar to the volume density estimated at AU in the envelope (as expected in the models – see, e.g., Fig. 6a of BM95b). If the mass–to–flux ratio is just critical in the supercritical core, then the magnetic field strength of the core should be G at AU. The reason why published magnetic models have larger values of is that their critical “decoupling” densities and field strengths are typically lower than these estimates by factors and , respectively. Direct Zeeman measurements suggest that the magnetic field strength is only G in the low-density ( cm-3) outer parts of prestellar cores such as L1544 (Crutcher 1999; Crutcher & Troland 2000). Only relatively poor upper limits (G) exist for the field strength in the central parts of these cores (Levin et al. 2001). Albeit quite large the above value G, which refers to the cm-3 region, thus remains realistic. Furthermore, it should be noted that published ambipolar diffusion models include only a static magnetic field and do not take turbulent support into account. If a turbulent magnetic field is present, then a weaker static field may be sufficient to yield a decoupling density as high as cm-3. According to this interpretation, the observed radius of “decoupling” AU would correspond to the cutoff wavelength for MHD waves, i.e., (cf. Mouschovias 1991), and the IRAM 04191 dense core would have initially formed through the dissipation of MHD turbulence (e.g. Nakano 1998; Myers 1998) rather than ambipolar diffusion.
6.6 Evolution of angular momentum during protostar formation

It is instructive to compare the rotational properties of the IRAM 04191 envelope with the characteristics of other prestellar and protostellar objects in Taurus. Our 2D radiative transfer modeling indicates a rotational velocity km s-1 at AU, using an inclination angle of (cf. § 5.2). This corresponds to a local specific angular momentum km s-1 pc at AU (roughly equal to the mean half-power radius of the N2H+ dense core: AU AU). Quite remarkably, the mean specific angular momentum km s-1 pc we measure inside the rapidly rotating inner envelope of IRAM 04191 is very similar to the nearly constant km s-1 pc value found by Ohashi (1999) for a number of small-scale “envelopes” and “disks” around Taurus Class I sources. More precisely, in the diagram of specific angular momentum versus radius presented by Ohashi et al. (1997b) (see their Fig. 6), IRAM 04191 lies close to the intersection between the “dense core” regime, where the angular velocity is approximately locked to a constant background value km s-1 pc-1 (presumably as a result of magnetic braking – see BM94 and § 6.5 above), and the “protostellar” regime, where the specific angular momentum is roughly constant in time999Assuming that all Taurus sources follow a similar time evolution, Fig. 16 may be viewed as an evolutionary diagram where the radius plotted on the x-axis represents the “contraction state” of a core as a function of time. This is conceptually different from a plot showing the spatial distribution of angular momentum/velocity in a given core at a given time (such as Fig. 1c of Basu 1997 or Fig. 12d of the present paper). (cf. Fig. 16). According to Ohashi et al. (1997b), the transition between these two regimes at a radius AU (i.e., pc) characterizes the size scale for dynamical collapse, inside which evolution proceeds with near conservation of angular momentum. Interestingly, this size scale is comparable to the radius AU found here for the rapidly rotating inner envelope of IRAM 04191. Our suggestion that the inner envelope is a magnetically supercritical core decoupling from a subcritical environment (§ 6.5 above) is thus fully consistent with the finding and interpretation of Ohashi et al. (1997b).
7 Summary and conclusions
We have carried out a detailed study of the structure and kinematics of the envelope surrounding the Class 0 protostar IRAM 04191 in Taurus. Our main results and conclusions are as follows:
-
1.
Extended, subsonic infall motions with km s-1, responsible for a marked ‘blue infall asymmetry’ in self-absorbed CS and H2CO lines, are present in the bulk of the envelope, up to at least AU. The observations are also consistent with larger infall velocities scaling as in an inner region of radius AU. The corresponding mass infall rate is estimated to be M⊙ yr-1.
-
2.
The protostellar envelope is differentially rotating with an angular velocity profile between AU and AU. The rotation profile is shallower, albeit more poorly constrained, in the inner region, i.e., . The angular velocity is estimated to be km s-1 pc-1 at AU and only km s-1 pc-1 at AU. The present value of the centrifugal radius is estimated to be less than 400 AU.
-
3.
The extended infall velocity profile is inconsistent with the inside-out collapse picture of Shu, Adams & Lizano (1987) and only marginally consistent with isothermal collapse models starting from marginally stable equilibrium Bonnor-Ebert spheres. The latter tend to produce somewhat faster infall velocities than are observed.
-
4.
The contrast observed between the (steeply declining) rotation velocity profile and the (flat) infall velocity profile beyond AU suggests that angular momentum is not conserved in the outer envelope. This is difficult to account for in the context of non-magnetic collapse models.
-
5.
Based on a qualitative comparison with magnetic ambipolar diffusion models of cloud collapse (e.g. BM94), we propose that the rapidly rotating inner envelope of IRAM 04191 corresponds to a magnetically supercritical core decoupling from an environment still supported by magnetic fields and strongly affected by magnetic braking. In this view, the outer () envelope represents a transition region between the forming protostar and the slowly rotating ambient cloud. Although published ambipolar diffusion models have difficulty explaining supercritical cores as small as AU, we speculate that more elaborate versions of these models, including the effects of MHD turbulence in the outer envelope, would be more satisfactory.
-
6.
Interestingly, the steepening of in IRAM 04191 occurs at a radius comparable to the AU scale inside which the specific angular momentum of Taurus dense cores appears to be conserved (cf. Ohashi et al. 1997b and Fig. 16). Our results therefore support Ohashi et al. (1997b)’s proposal that AU represents the typical size scale for dynamical collapse in Taurus. More generally, we suggest that the rotation/infall properties observed here for IRAM 04191 are representative of the physical conditions prevailing in isolated protostellar envelopes shortly ( yr) after point mass formation.
Acknowledgements.
We would like to thank Shantanu Basu for enlightening discussions on ambipolar diffusion models and Carl A. Gottlieb for providing his laboratory measurements of the CS and C34S frequencies prior to publication. We acknowledge the contribution of Aurore Bacmann during the 1999 observing run at the 30m telescope. We are also grateful to the IRAM astronomers in Grenoble for their help with the Plateau de Bure interferometric observations.Appendix: Characteristics of the MAPYSO code
The numerical code we have used first calculates the non-LTE level populations with a 1D (spherical) Monte-Carlo method (Bernes 1978, 1979). Radiative transfer along each line of sight and convolution with the antenna beam, approximated by a Gaussian, are then computed with the MAPYSO package (Blinder 1997). The latter works in both 1D and 2D geometry.
We have tested the Monte Carlo code for two test problems (1 and 2) available on the web page of the workshop on Radiative Transfer in Molecular Lines held in Leiden in May 1999 (http://www.strw.leidenuniv.nl/radtrans/). These tests correspond to a low-abundance and high-abundance HCO+ 12-level problem, respectively, in the context of the Shu (1977) spherical collapse model. The level populations and the excitation temperatures computed by our Monte-Carlo code without any reference field (see Bernes 1979; Pagani 1998) agree quite well with those calculated by the workshop participants. The only significant difference occurs for the high-abundance case in the central region (inside 1300 AU) where our HCO+(2-1), (3-2), and (4-3) excitation temperatures are lower by compared to the main group results.
The CS and C34S Monte-Carlo calculations reported in § 4 and § 5 used 9 levels and 27 concentric shells. This number of levels should be sufficient as the 9 level is 85 K above the ground level while the kinetic temperature in the envelope does not exceed 20 K (see § 4.1). We used the CS collision rates computed in the 20-300 K range by Turner et al. (1992) and extrapolated these to 5-300 K with polynomials (Choi et al. 1995 and N. Evans, private communication). Each simulation was performed without any reference field and resulted from two successive Monte-Carlo runs. The first run started from LTE, used packets of 1000 model photons, and computed 100 iterations, reinitializing the counters after each iteration (see Bernes 1979). It converged rapidly but still suffered from a high level of statistical noise. The second run improved the convergence and reduced the noise level by starting from the output of the first run, computing 40 iterations with packets of 40000 model photons, and reinitializing the counters after each group of five iterations. We checked that this number of iterations was large enough to reach convergence on the populations of the first five levels with an accuracy better than a few percents.
References
- Alves, Lada & Lada (2001) Alves, J.F., Lada, C.J., & Lada, E.A. 2001, Nature, 409, 159
- André, Motte & Bacmann (1999) André, P., Motte, F., & Bacmann, A. 1999, ApJ, 513, L57 (AMB99)
- André, Ward-Thompson & Barsony (1993) André, P., Ward-Thompson, D., & Barsony, M. 1993, ApJ, 406, 122
- André, Ward-Thompson & Barsony (2000) André, P., Ward-Thompson, D., & Barsony, M. 2000, in Protostars and Planets IV, ed. V. Mannings, A.P. Boss, & S.S. Russel (Univ. of Arizona Press, Tucson), p. 59
- André, Ward-Thompson & Motte (1996) André, P., Ward-Thompson, D., & Motte, F. 1996, A&A, 314, 625
- Arquilla & Goldsmith (1986) Arquilla, R., & Goldsmith, P.F. 1986, ApJ, 303, 356
- Artymowicz & Lubow (1994) Artymowicz, P., & Lubow, S.H.1994, ApJ, 421, 651
- Bachiller & Pérez-Gutiérrez (1997) Bachiller, R., & P rez Gutti rrez, M. 1997, ApJ, 487, L93
- Bacmann et al. (2000) Bacmann, A., André, P., Puget, J.-L., Abergel, A., Bontemps, S., & Ward-Thompson, D. 2000, A&A, 361, 555
- Basu (1997) Basu, S. 1997, ApJ, 485, 240
- Basu (1998) Basu, S. 1998, ApJ, 509, 229
- Basu & Mouschovias (1994) Basu, S., & Mouschovias, T.C. 1994, ApJ, 432, 720 (BM94)
- Basu & Mouschovias (1995a) Basu, S., & Mouschovias, T.C. 1995a, ApJ, 452, 386 (BM95a)
- Basu & Mouschovias (1995b) Basu, S., & Mouschovias, T.C. 1995b, ApJ, 453, 271 (BM95b)
- Beckwith et al. (1990) Beckwith, S.V.W., Sargent, A.I., Chini, R.S., & Guesten, R. 1990, AJ, 99, 924
- Belloche, André & Motte (2001) Belloche, A., André, P., & Motte, F. 2001, in From Darkness to Light, Eds. T. Montmerle & P. André, ASP Conf. Ser., 243, p. 313
- Benson & Myers (1989) Benson, P.J., & Myers, P.C. 1989, ApJSS, 71, 89
- Bergin & Langer (1997) Bergin, E.A., & Langer, W.D. 1997, ApJ, 486, 316
- Bernes (1978) Bernes, C. 1978, Stockholm Observatory Report no. 15 + erratum
- Bernes (1979) Bernes, C. 1979, A&A, 73, 67
- Blinder (1997) Blinder, S. 1997, Thesis, Université de Bordeaux I
- Bonnor (1956) Bonnor, W.B. 1956, MNRAS, 116, 351
- Broguière et al. (2002) Broguière, D., Neri, R., Sievers, A., & Wiesemeyer, H. 2002, NIC Bolometer Users Guide, V 1.4-11
- Buisson et al. (2002) Buisson, G., Desbats, L., Duvert, G., Forveille, T., Gras, R., Guilloteau, S., Lucas, R., & Valiron, P. 2002, CLASS manual, Version 4.0 (IRAM)
- Burkert & Bodenheimer (2000) Burkert, A., & Bodenheimer, P. 2000, ApJ, 543, 822
- Cabrit & Bertout (1990) Cabrit, S., & Bertout, C. 1990, 348, 530
- Caselli et al. (1995) Caselli, P., Myers, P.C., & Thaddeus, P. 1995, ApJ, 455, L77
- Caselli et al. (1998) Caselli, P., Walmsley, C.M., Terzevia, R., & Herbst, E. 1998, ApJ, 499, 234
- Caselli et al. (2001a) Caselli, P., Walmsley, C.M., Zucconi, A., Tafalla, M., Dore, L., & Myers, P.C. 2001a, ApJ, 565, 331
- Caselli et al. (2001b) Caselli, P., Walmsley, C.M., Zucconi, A., Tafalla, M., Dore, L., & Myers, P.C. 2001b, ApJ, 565, 344
- Ceccarelli et al. (1996) Ceccarelli, C., Hollenbach, D.J., & Tielens, A.G.G.M. 1996, ApJ, 471, 400
- Chevalier (1983) Chevalier, R.A. 1983, ApJ, 268, 753
- Choi et al. (1995) Choi, M., Evans, N.J. II, Gregersen, E., & Wang, Y. 1995, ApJ, 448, 742
- Ciolek & Basu (2000) Ciolek, G.E., & Basu, S. 2000, ApJ, 529, 925
- Ciolek & Königl (1998) Ciolek, G.E., & Königl, A. 1998, ApJ, 504, 257
- Ciolek & Mouschovias (1994) Ciolek, G.E., & Mouschovias, T.C. 1994, ApJ, 425, 142
- Crutcher (1999) Crutcher, R.M. 1999, ApJ, 520, 706
- Crutcher & Troland (2000) Crutcher, R.M., & Troland, T.H. 2000, ApJ, 537, L139
- Doty & Neufeld (1997) Doty, S.D., & Neufeld, D.A. 1997, ApJ, 489, 122
- Evans (1999) Evans, N.J. II 1999, ARAA, 37, 311
- Evans et al. (2001) Evans, N.J. II, Rawlings, J.M.C., Shirley, Y.L., & Mundy, L.G. 2001, ApJ, 557, 193
- Foster & Chevalier (1993) Foster, P.N., & Chevalier, R.A. 1993, ApJ, 416, 303
- Galli & Shu (1993) Galli, D., & Shu, F.H. 1993, ApJ, 417, 220
- Goodman et al. (1993) Goodman, A.A., Benson, P.J., Fuller, G.A., & Myers, P.C. 1993, ApJ, 406, 528
- Gottlieb, Myers & Thaddeus (2002) Gottlieb, C.A., Myers, P.C., & Thaddeus, P. 2002, in preparation
- Guilloteau, Lucas & Bouyoucef (2002) Guilloteau, S., Lucas, R., & Bouyoucef, K. 2002, Mapping Cookbook IRAM Plateau de Bure Interferometer, Version 1.3 (IRAM)
- Hartmann (1998) Hartmann, L. 1998, Accretion Processes in Star Formation, Cambridge Astrophysics Series, Vol. 32 (Cambridge University Press)
- Hennebelle et al. (2002) Hennebelle, P., Whitworth, A.P., Gladwin, P.P., & Andr , P. 2002, MNRAS, in press
- Henriksen, André & Bontemps (1997) Henriksen, R.N., André, P., & Bontemps, S. 1997, A&A, 323, 549 (HAB97)
- Hogerheijde & Sandell (2000) Hogerheijde, M.R., & Sandell, G. 2000, ApJ, 534, 880
- Jensen, Mathieu & Fuller (1996) Jensen, E.L.N., Mathieu, R.D., & Fuller, G.A. 1996, ApJ, 458, 312
- Jessop & Ward-Thompson (2000) Jessop, N.E., & Ward-Thompson, D. 2000, MNRAS, 311, 63
- Kenyon, Calvet & Hartmann (1993) Kenyon, S.J., Calvet, N., & Hartmann, L.W. 1993, ApJ, 414, 676
- Klapper et al. (2001) Klapper, G., Lewen, F., Gendriesch, R., Belov, S.P., & Winnewisser, G., 2001, Z. Naturforsch., 56a, 329
- Kramer et al. (1998) Kramer, C., Stutzki, J., Röhrig, R., & Corneliussen, U. 1998, A&A, 329, 249
- Krasnopolsky & Königl (2002) Krasnopolsky, R., & Königl, A. 2002, ApJ, submitted
- Larson (1969) Larson, R.B., 1969, MNRAS, 145, 271
- Lee, Myers & Tafalla (2001) Lee, C.W., Myers, P.C., & Tafalla, M. 2001, ApJS, 136, 703
- Levin et al. (2001) Levin, S.M., Langer, W.D., Velusamy, T., Kuiper, T.B.H., & Crutcher, R.M. 2001, ApJ, 555, 850
- Li (1998) Li, Z.-Y. 1998, ApJ, 493, 230
- Li & Shu (1996) Li, Z.-Y., & Shu, F.H. 1996, ApJ, 472, 211
- Li & Shu (1997) Li, Z.-Y., & Shu, F.H. 1997, ApJ, 475, 237
- Lucas (1999) Lucas, R. 1999, CLIC manual, Version 4.1 (IRAM)
- Lucas (2001) Lucas, R. 2001, in Proceedings from IRAM Interferometry School 2, Ed. A. Dutrey (IRAM), p 175
- Masunaga & Inutsuka (2000) Masunaga, H., & Inutsuka, S.I. 2000, ApJ, 531, 350
- Masunaga, Miyama & Inutsuka (1998) Masunaga, H., Miyama, S.M., & Inutsuka, S. 1998, ApJ, 495, 346
- Motte & André (2001) Motte, F., & Andr , P. 2001, A&A, 365, 440 (MA01)
- Motte, André & Neri (1998) Motte, F., André, P., & Neri, R. 1998, A&A, 336, 150 (MAN98)
- Mouschovias (1991) Mouschovias, T.C. 1991, ApJ, 373, 169
- Myers (1998) Myers, P.C. 1998, ApJ, 496, L109
- Myers (1999) Myers, P.C. 1999, in The Physics and Chemistry of the Interstellar Medium, Proceedings of the 3rd Cologne-Zermatt Symposium, Eds : V. Ossenkopf, J. Stutzki, and G. Winnewisser (GCA-Verlag Herdecke)
- Myers et al. (1995) Myers, P.C., Bachiller, R., Caselli, P., Fuller, G.A., Mardones, D., Tafalla, M., & Wilner, D.J. 1995, ApJ, 449, L65
- Myers, Evans & Ohashi (2000) Myers, P.C., Evans, N.J. II, & Ohashi, N. 2000, in Protostars and planets IV, Ed. V. Mannings, A. Boss, & S. Russel (Tucson: Univ. Arizona Press), p. 217
- Nakano (1998) Nakano, T. 1998, ApJ, 494, 587
- Ohashi (1999) Ohashi, N. 1999, in Star Formation 1999, Ed : T. Nakamoto (Nobeyama Radio Observatory), p129
- Ohashi et al. (1997a) Ohashi, N., Hayashi, M., Ho, P.T.P., & Momose, M. 1997a, ApJ, 475, 211
- Ohashi et al. (1997b) Ohashi, N., Hayashi, M., Ho, P.T.P., Momose, M., Tamura, M., Hirano, N., & Sargent, A.I. 1997b, ApJ, 488, 317
- Onishi, Mizuno & Fukui (1999) Onishi, T., Mizuno, A., & Fukui, Y. 1999, PASJ, 51, 257
- Pagani (1998) Pagani, L. 1998, A&A, 333, 269
- Penston (1969) Penston, M.V., 1969, MNRAS, 144, 425
- Saigo & Hanawa (1998) Saigo, K., & Hanawa, T. 1998, ApJ, 493, 342
- Safier, McKee & Stahler (1997) Safier, P.N., McKee, C.F., & Stahler, S.W. 1997, ApJ, 485, 660
- Shu (1977) Shu, F. 1977, ApJ, 214, 488
- Shu, Adams & Lizano (1987) Shu, F.H., Adams, F.C., & Lizano, S. 1987, ARA&A 25, 23
- Spitzer (1978) Spitzer, L., Jr. 1978, Physical Processes in the Interstellar Medium (New York: Wiley)
- Stahler et al. (1994) Stahler, S.W., Korycansky, D.G., Brothers, M.J., & Touma, J. 1994, ApJ, 431 341
- Stutzki & Güsten (1990) Stutzki, J. , & Güsten, R. 1990, 356, 513
- Tafalla et al. (1998) Tafalla, M., Mardones, D., Myers, P.C., Caselli, P., Bachiller, R., & Benson, P.J. 1998, ApJ, 504, 900
- Tafalla et al. (2002) Tafalla, M., Myers, P.C., Caselli, P., Walmsley, C.M., & Comito, C. 2002, ApJ, in press (Astro-ph/0112487)
- Tamura et al. (1991) Tamura, M., Gatley, I., Waller, W., & Werner, M.W. 1991, ApJ, 374, L25
- Terebey, Shu & Cassen (1984) Terebey, S., Shu, F.H., & Cassen, P. 1984, ApJ, 286, 529 (TSC84)
- Tomisaka (1996) Tomisaka, K. 1996, PASJ, 48, L97
- Tomisaka (2000) Tomisaka, K. 2000, ApJ, 528, L41
- Turner et al. (1992) Turner, B.E., Chan, K.W., Green, S., & Lubowich, D.A. 1992, ApJ, 399, 114
- Ungerechts et al. (2000) Ungerechts H., et al. 2000, in Imaging at Radio through Submillimeter Wavelengths, ASP Conf. Proc., Vol. 217, Eds : J.G. Mangum & S.J.E. Radford (Astronomical Society of the Pacific), p190
- Vrtilek, Gottlieb & Thaddeus (1987) Vrtilek, J.M., Gottlieb, C.A., & Thaddeus, P. 1987, ApJ, 314, 716
- Walker, Narayanan & Boss (1994) Walker, C.K., Narayanan G., & Boss, A.P. 1994, ApJ, 431, 767
- Ward-Thompson & Buckley (2001) Ward-Thompson, D., & Buckley, H.D. 2001, MNRAS, 327, 955
- Ward-Thompson, Motte & André (1999) Ward-Thompson, D., Motte, F., & André, P. 1999, MNRAS, 305, 143
- Ward-Thompson et al. (1994) Ward-Thompson, D., Scott, P.F., Hills, R.E., & André, P. 1994, MNRAS, 268, 276
- Whitworth & Summers (1985) Whitworth, A., & Summers, D. 1985, MNRAS, 214, 1
- Wild (1999) Wild, W. 1999, The 30m Manual, Pico Veleta, Spain, Version 2.0 (IRAM)
- Williams & Myers (1999) Williams, J.P., & Myers, P.C. 1999, ApJ, 518, L37
- Wilner et al. (2000) Wilner, D.J., Myers, P.C., Mardones, D., & Tafalla, M. 2000, ApJ, 544. L73
- Wilson & Rood (1994) Wilson, T.L., & Rood, R.T. 1994, ARA&A, 32, 191
- Wootten, Wiseman & Fuller (2001) Wootten, A., Wiseman, J., & Fuller, G. 2001, AAS Meeting 199, #60.02
- Zhou (1995) Zhou, S. 1995, ApJ, 442, 685
- Zhou et al. (1993) Zhou, S., Evans, N.J. II, Kömpe, C., & Walmsley, C.M. 1993, ApJ, 404, 232
- Zhou et al. (1996) Zhou, S., Evans, N.J. II, & Wang, Y. 1996, ApJ, 466, 296
- Zucconi, Walmsley & Galli (2001) Zucconi, A., Walmsley, C.M., & Galli, D., 2001, A&A, 376, 650