Tests of the Las Campanas Distant Cluster Survey from Confirmation Observations for the ESO Distant Cluster Survey11affiliation: Based on observations obtained in visitor and service modes at the ESO Very Large Telescope (VLT) as part of the Large Programme 166.A–0162 (the ESO Distant Cluster Survey)
Abstract
The ESO Distant Cluster Survey (EDisCS) is a photometric and spectroscopic study of the galaxy cluster population at two epochs, and , drawn from the Las Campanas Distant Cluster Survey (LCDCS). We report results from the initial candidate confirmation stage of the program and use these results to probe the properties of the LCDCS. Of the 30 candidates targeted, we find statistically significant overdensities of red galaxies near 28. Of the ten additional candidates serendipitously observed within the fields of the targeted 30, we detect red galaxy overdensities near six. We test the robustness of the published LCDCS estimated redshifts to misidentification of the brighest cluster galaxy (BCG) in the survey data, and measure the spatial alignment of the published cluster coordinates, the peak red galaxy overdensity, and the brightest cluster galaxy. We conclude that for LCDCS clusters out to , 1) the LCDCS coordinates agree with the centroid of the red galaxy overdensity to within 25″( kpc) for 34 out of 37 candidates with galaxy overdensities, 2) BCGs are typically coincident with the centroid of the red galaxy population to within a projected separation of 200 kpc (32 out of 34 confirmed candidates), 3) the red galaxy population is strongly concentrated, and 4) the misidentification of the BCG in the LCDCS causes a redshift error 0.1 in 15-20% of the LCDCS candidates. These findings together help explain the success of the surface brightness fluctuations detection method.
1 Introduction
Observations of the distant galaxy cluster population are being driven by a new generation of catalogs that provide statistically significant samples of hundreds to thousands of candidate clusters between redshifts 0.5 and 1. These catalogs can either serve as large statistical samples without appealing to any further observations, for example to measure the cluster-cluster correlation function (Gonzalez, Zaritsky, & Wechsler, 2002), or as input for follow-up studies of selected subsamples. The European Southern Observatory Distant Cluster Survey (EDisCS) is a detailed follow-up study of 20 clusters, 10 at and 10 at , drawn from the 1073 candidate clusters cataloged by the Las Campanas Distant Cluster Survey (LCDCS; Gonzalez, 2000; Gonzalez et al., 2001). This paper describes results from the preliminary effort to confirm the set of cluster candidates that will be the focus of the more extensive observations of the EDisCS.
The value of a cluster catalog is greatly enhanced for any application if the catalog includes measurements of the redshift and mass of each candidate cluster. Due to the size of recent catalogs, it is impractical to obtain spectroscopic redshifts or masses for a significant fraction of the catalog. Most catalogs now provide an estimate of these properties drawn solely from the survey data (see Postman et al., 1996; Gonzalez et al., 2001). Superior survey data, for example deeper images or multiple colors, should improve the reliability of the estimated parameters, but they decrease the observing efficiency. The optimum balance between the fidelity of the cluster catalog and observational efficiency is not evident, and will depend on the scientific aims. Gonzalez et al. (2001) provided a catalog from what is arguably the most observationally efficient method (10 nights at a 1m telescope produced a catalog of 1000 cluster candidates out to over an area covering 130 sq. degrees), but which might in turn provide the least robust estimates of the cluster redshifts and masses, and which, even more importantly for some potential uses of the catalogs, may include a larger fraction of false detections. Using observations in multiple filters that are 3 magnitudes deeper than original survey data, we examine whether the false positive rate quoted originally for the LCDCS is valid and whether the LCDCS cluster coordinates and estimated redshifts are confirmed using deep, multicolor data.
The LCDCS generated a catalog of concentrations of photons on the sky rather than galaxies (Dalcanton, 1995,1996; Zaritsky et al., 1997; Gonzalez et al., 2001). Significant fluctuations in the background sky are classified into various categories, including high redshift clusters. The cluster redshift is estimated using the magnitude of the brightest galaxy near the surface brightness fluctuation, which is presumed to be the brightest cluster galaxy (BCG). The redshift-magnitude relationship for BCGs is calibrated using spectroscopy of a sample of 20 clusters. The cluster mass is estimated using the peak brightness of the convolved surface brightness map, calibrated using a sample of clusters with X-ray temperature and velocity dispersion measurements. The uncertainties in each of these estimators, and of the false positive and negative rates, are discussed by Gonzalez et al. (2001) in their presentation of the LCDCS. Our examination of these issues here utilizes multifilter images of 30 targeted fields, which contain 40 LCDCS candidate clusters, obtained with ESO’s Very Large Telescope (VLT) as part of the initial stage of the EDisCS.
The format of this paper is as follows. In §2 we present the data utilized in this analysis and details of the reduction procedure. We then examine the two-color photometry in §3 to confirm or reject the cluster candidates observed by EDisCS and test whether the fractional contamination is consistent with that given by Gonzalez et al. (2001). In §4 we test the robustness of the estimated redshifts quoted for the LCDCS, which are based upon the magnitude of the brightest cluster galaxy, with particular emphasis on the potential problem of BCG misidentification. In this section we also quantify the offsets between the LCDCS coordinates, the locations of the brightest cluster galaxies, and the peak of the projected galaxy distribution. Next, we briefly comment upon the LCDCS mass estimates in §5 and compare the LCDCS surface brightness with other observable quantities. Finally, a summary of the results and brief discussion of forthcoming work are presented in §5. For all physical distances in this paper we assume a flat, CDM cosmology with =0.3.
2 Data
2.1 Sample Selection
The data presented here are part of the ESO Distant Cluster Survey, an ongoing ESO large program to examine a set of 10 massive clusters in each of two distinct redshifts regimes, and . The cluster candidates for this study are drawn from the Las Campanas Distant Cluster Survey (Gonzalez et al. 2001), with candidate selection constrained by the published redshift estimates and surface brightnesses corrected for Galactic absorption, . Candidates are selected to be among the highest surface brightness detections at each redshift in an attempt to recover some of the most massive clusters at each epoch. Because some of the brightest detections, especially at higher estimated redshifts, turn out to be spurious (for example, scattered light or tidal material around nearby galaxies) and because there is a factor of two scatter in the relationship between and mass (as measured from or ; Gonzalez et al. 2001), we visually classify all of the candidates that satisfy our initial criteria (RA constraints, counts s-1 arcsec-2, or ) to select the most probable, massive clusters. The distribution in of the observed list of candidates (not all visually approved candidates were observed) is shown in Figure 2.1. A second set of criteria, based on the data presented here, are applied to select the final 20 clusters that will be the focus of the EDisCS and will be discussed in the presentation of the deeper photometry of the EDisCS clusters (White et al., 2002). The final sample represents our best effort to select a subsample of the most massive clusters at the two epochs, but is neither complete within the survey volume nor necessarily unbiased with respect to the LCDCS catalog.
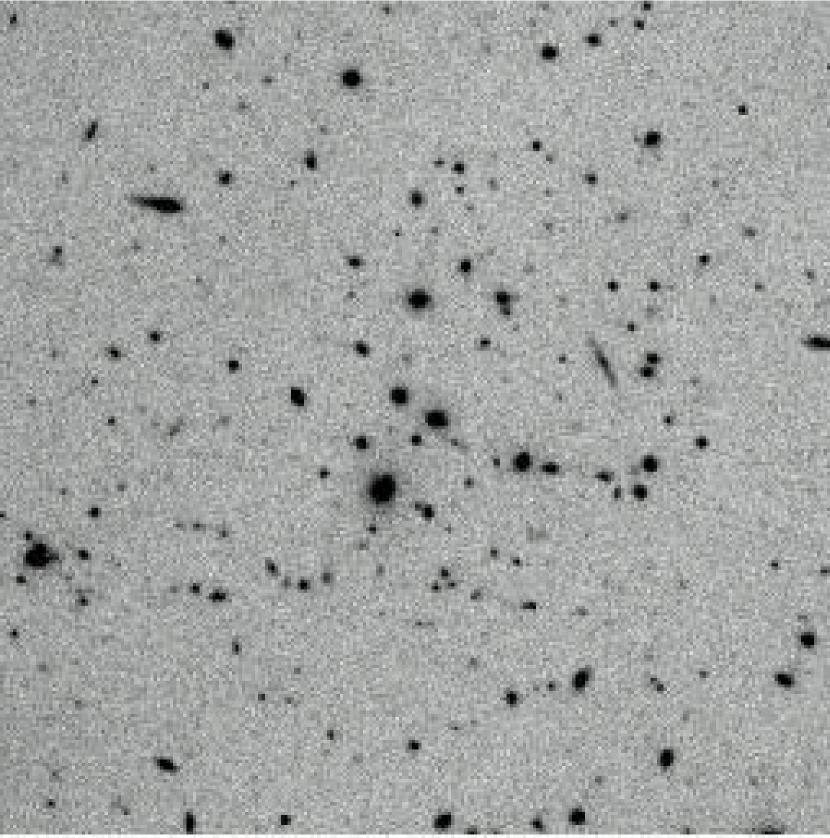
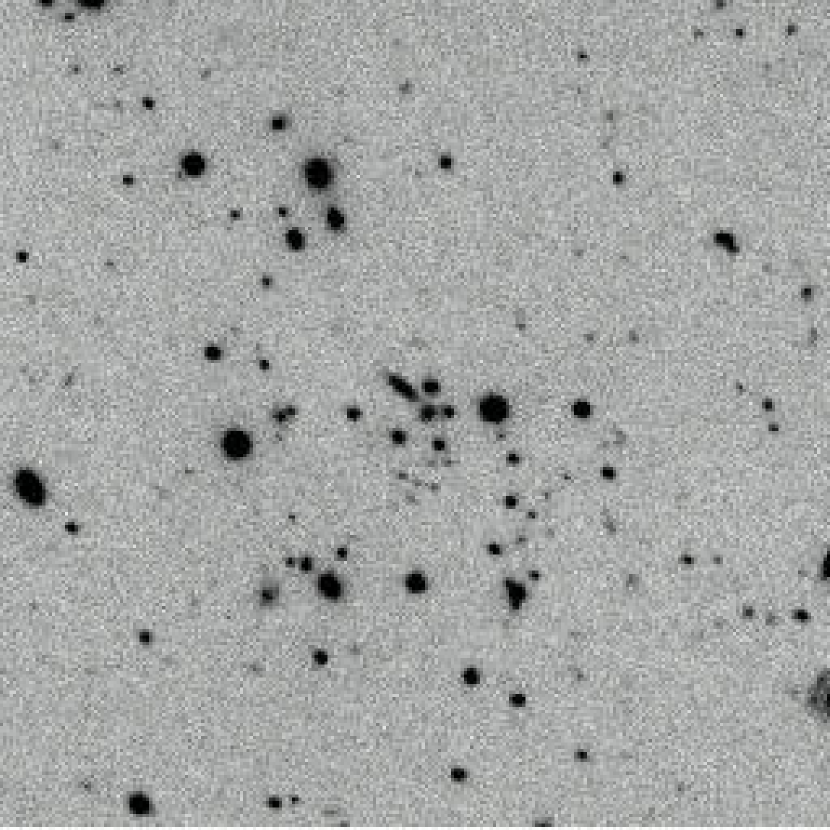
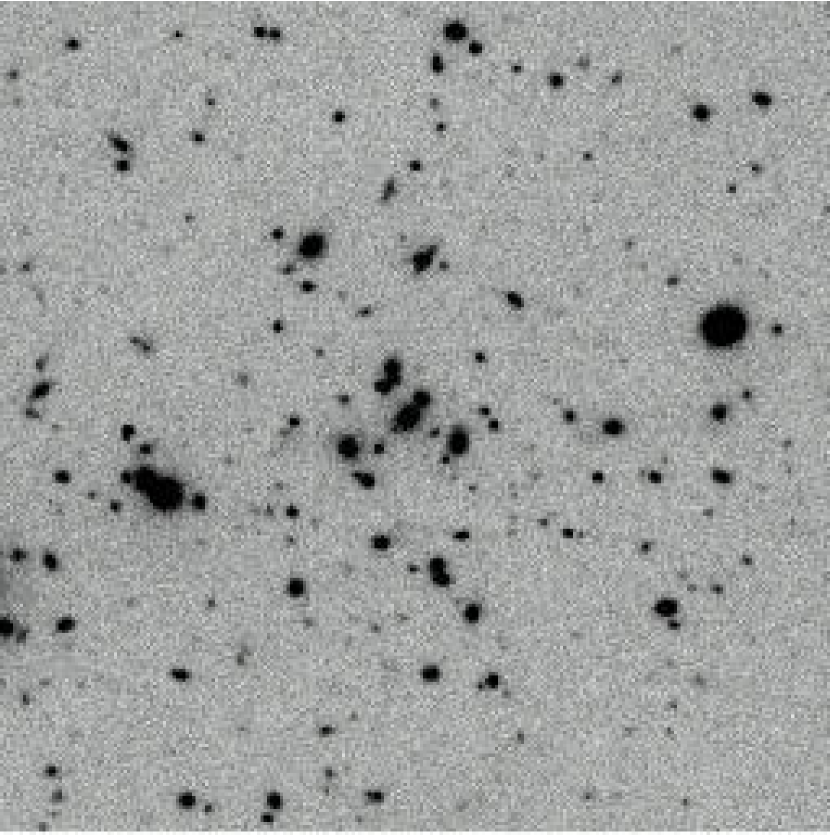
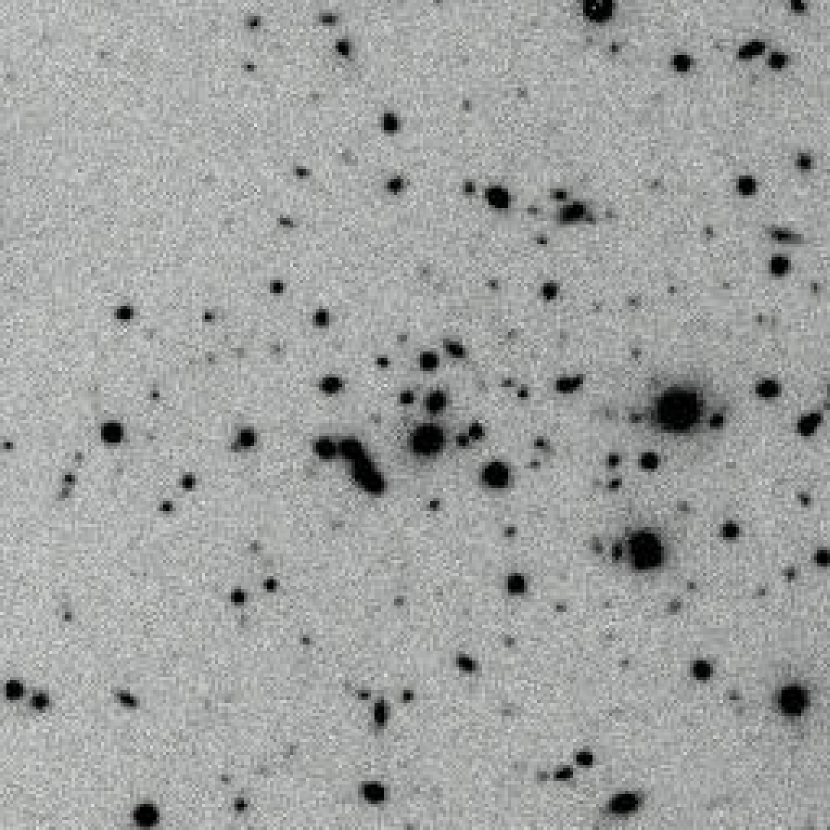
Using the estimated contamination rate for the LCDCS from Gonzalez et al. (2001) of 30%, we targeted thirty candidates in an effort to obtain twenty confirmed clusters. We initially observed 11 at and 13 at ; the final 6 candidates were selected to replace false detections, poor systems, and clusters with galaxy colors inconsistent with the desired redshift intervals. Images of four candidates, two at each epoch, are shown in Figure 1. These thirty fields also serendipitously contain ten additional cluster candidates from the LCDCS catalog, yielding imaging for a total of 40 LCDCS candidates. The ten serendipitous clusters are a more representative selection from the LCDCS catalog, although some may be at the same redshift as the target cluster and therefore be part of a larger association of clusters and groups.
![[Uncaptioned image]](/html/astro-ph/0207243/assets/x1.png)
Distribution of peak surface brightness from the LCDCS catalog for the two epochs probed by EDisCS. The filled histograms correspond to the primary EDisCS targets, while the open histograms correspond to all clusters in the LCDCS catalog at these epochs.
2.2 Observations and Image Analysis
Preliminary imaging for the EDisCS was carried out in service mode during January and February of 2001 and in visitor mode on March 19, 2001 using the FOcal Reducer/low dispersion Spectrograph 2 (FORS2) in direct imaging mode on the UT2/Kueyen telescope on Paranal, Chile. The field of view is , with corresponds to a physical extent of Mpc for the clusters in our sample. In total, thirteen candidate fields and seventeen candidate fields were observed for 20 minutes in each of two passbands: and for the sample and and for the sample. In each passband, the observing time was split into 4 exposures of 5 minutes each, dithered by between exposures. The service observing was only performed in photometric conditions with seeing better than seeing. The conditions on March 19 were seeing and thin cirrus. Comparison of the images for the three clusters observed on March 19, which were selected for the EDisCS final sample, to images taken later in photometric conditions shows that the extinction varied between 0 and magnitudes during the night.
The images had the bias removed by first subtracting a medianed master bias frame, taken each night, and then performing and subtracting a linear fit to the overscan strip residuals. Because the data was taken in 4-port readout mode, this step was done separately for each quadrant. Medianed nightsky flats were then constructed for each week’s data and used to flatfield the images. Our visual inspection of the flatfielded data did not find any evidence for dust spots or other large-scale fluctuations, suggesting that the flatfield did not change over the course of a week. The images were then aligned using integer pixel offsets and averaged with clipping to remove cosmic rays.
For each cluster candidate field, the images taken in the two filters were carefully registered (when needed) using IRAF/IMSHIFT. Galaxy aperture photometry was performed using SExtractor version 2.2.1 (Bertin & Arnouts, 1996). SExtractor was used in “two-image” mode using the IB image as the detection image. The detection and analysis thresholds were set to 1 with a minimum area of 5 pixels and a minimum contrast parameter for deblending of 0.001. To maximize the signal-to-noise of our measured colors, we used an aperture diameter of . Instrumental aperture magnitudes were calibrated using the airmasses of our observations and the FORS2 photometric zeropoints produced by the Quality Control Group at ESO/Garching for the nights of our observations.
3 Cluster Confirmation
The first goal of the EDisCS program is to confirm a subset of the candidate clusters selected from the LCDCS. As described by Nelson et al. (2001), photometric data alone provides various ways in which to identify a cluster. Clusters are by definition a localized excess of galaxies, but these can be difficult to identify when superposed on a sea of foreground and background galaxies. One approach at increasing the contrast between the cluster and contaminating field has been to utilize the observational result that clusters contain galaxies that appear to be nearly as red (evolved) as possible at each epoch out to at least (Stanford, Eisenhardt, & Dickinson, 1998). By examining the clustering of these red galaxies, which lie along the passively evolving E/S0 sequence, the clusters are more easily identified. Our approach is quantitatively similar to that of Olsen et al. (2001), who divide their galaxy catalogs into color slices and then employ an adaptive smoothing kernel to detect statistically significant galaxy overdensities, and qualitatively similar to the approach demonstrated by Gladders & Yee (2000). Like Olsen et al. (2001), we use adaptive kernel smoothing, starting from an Epanechnikov kernel with (see Merritt & Tremblay, 1994, for more details on adaptive smoothing). We restrict the magnitude range of the galaxies used for the maps on the basis of the estimated redshifts of the cluster candidates. For candidates with estimated redshifts we include galaxies with , while for higher redshift candidates we raise the limiting magnitude to =23. We refrain from any further refinement of the magnitude range to match individual clusters because the accuracy of the redshift estimates is not yet firmly established.
Rather than using a fixed color slice set by the cluster’s estimated redshift, we search color space to optimize the contrast between the cluster signal and the galaxy background. We step through color in increments of 0.05 mag, deriving an adaptively smoothed density map at each step using galaxies with colors within 0.5 mag of the central color. This approach neglects the slope of the color-magnitude relation for E/S0 galaxies, but the color change due to the slope is significantly less than 0.5 mag (Stanford, Eisenhardt, & Dickinson, 1998). We define the optimal color to be the one that yields the highest significance galaxy overdensity within 1 of the coordinates given in the LCDCS catalog.
The results of the adaptive kernel smoothing are shown in Figures 2–3 and Table 1. We estimate the statistical significance of galaxy overdensities by constructing a histogram of the pixel distribution in the smooth maps and making the approximation that 84.15% of pixels in the density map must exceed the mean () by less than 1. To assess the likelihood that detected overdensities are associated with the original LCDCS detections, we also compute the probability that an overdensity will lie within a given distance of a surface brightness detection purely by chance. Based upon the number of detected () overdensities, we calculate that there is a 6% (2%) probability that a random overdensity peak will lie within , or 2.5 times the scale length of the smoothing kernel employed in the LCDCS. For a 1 radius, the probability is 33% (11%). Thus, detections within 25 are unlikely to be chance superpositions at roughly the 3 confidence level, while those within 1 are significant at roughly the 1 level.


For the targeted EDisCS sample, 29 out of 30 candidates have a peak present within 1, with the one remaining detection having a significance of 2.9. Of these 29, in only one instance is the separation between the peak galaxy overdensity and the original coordinates greater than 25. If we conservatively consider both this detection and the 2.9 detection to be failed candidates, then the success rate for the targeted EDisCS candidates is 93%. We conclude that the LCDCS catalog at these values of even out to has a low false positive rate when augmented by visual inspection.
As expected, the success rate is lower for the serendipitously observed LCDCS clusters because these candidates lack the surface brightness selection criteria and visual culling applied to the primary EDisCS targets. Based upon the redshift distribution of these ten candidates and the contamination estimate published by Gonzalez et al. (2001), we predict that 42 of these candidates should be spurious. In practice, we find peaks within 1 of 8 out of 10 candidates. The separation between the peak galaxy overdensity is greater than 25 for two of these detections. If we again assume that these detections are not associated with the LCDCS detections, then we derive a conservative bound on the success rate of 60%, which is consistent with the predicted rate.

While the significant overdensities are indicative of clusters, we must still confirm the LCDCS redshift and mass estimates. The best fit colors from our adaptive smoothing procedure provide a first crude test of the estimated redshifts. Because the candidates are intended to fall into two redshift bins, the colors of the clusters should be consistent within each redshift bin and one might expect them to be consistent with the colors of evolved galaxies at the two redshift epochs. To refine our cluster color estimates, we rerun the adaptive kernel algorithm using a narrower color window (0.2 mag) than was used for initial detection. In Figure 4 we plot color-magnitude diagrams for a subset of our cluster candidates, overlaid with dashed lines to denote the optimal color that we derive using the adaptive kernel. The plotted candidates are selected to span the range of redshifts and galaxy overdensities covered by the full EDisCS sample. In Figure 3 we plot this color ( and for the low and high redshift candidates, respectively) vs. , and overplot model tracks for an evolved single burst stellar population (Bruzual & Charlot, 1993; Charlot, Worthey, & Bressnan, 1996). We caution that our colors cannot be straightforwardly converted into redshift estimates (as one could attempt to do from this Figure) because our method provides only a crude color for the E/S0 sequence. However, a rough comparison to the expected colors for evolved stellar populations suggests that the reddest clusters do have colors consistent with their , while some other clusters appear to be significantly bluer than expected (up to 0.6 mag), particularly among the sample. Without spectroscopy we cannot reach a definite interpretation of this result, but we can enumerate possible explanations. The scatter could be partially driven by the inclusion of overdensities that are alignments of poorer groups along the line of sight rather than single clusters. Such detections would have a broad color range rather than a well-defined red sequence. Similarly, rich foreground clusters could also contaminate the observed color-magnitude diagrams of the targeted candidates. Chance alignments are unlikely in the LCDCS due to the small size of the detection kernel (Gonzalez et al., 2001); however, such alignments cannot presently be discounted in the galaxy overdensity maps. We anticipate that these effects are minor, but confirming this expectation requires more data.
Two additional, more interesting possibilities are that 1) the clusters have a well-developed E/S0 sequence and are at lower redshifts than originally estimated, or 2) the clusters do not have a well-developed sequence and our color matching finds a higher density contrast between cluster and field at colors that are intrinsically bluer than the E/S0 sequence. The former conclusion would pose a serious problem for the LCDCS catalog because many high redshift cluster candidates could turn out to be at lower redshifts (by as much as 0.3 to 0.4); the latter conclusion would have interesting implications both for models of the evolution of cluster galaxies between and 0.5, and for selection of clusters on the basis of the red sequence population (see Gladders & Yee, 2000). Our ongoing deeper photometry and spectroscopy of these clusters will provide the necessary data to discriminate between all these possibilities.
In concluding this section, we note that if the first possibility (systematically underestimated redshifts) is correct, then there are several factors that could contribute to such an error, including (1) misidentification of the BCG when estimating the cluster redshift, (2) failure of the BCG magnitude-redshift relation due to physical evolution of the BCGs, or (3) failure of the BCG magnitude-redshift relation in Gonzalez et al. (2001) at due to insufficient of calibration data at this epoch. We examine the possibility of BCG misidentification in §4, finding that this factor alone is likely insufficent to explain the range of observed cluster colors. Physical evolution is also an unlikely culprit, as various studies of BCGs out to (Aragon-Salamanca, Baugh, & Kauffmann, 1998; Burke, Collins, & Mann, 2000; Nelson et al., 2002) find mild or no luminosity evolution. If the redshifts are systematically underestimated, the most probable culprit is failure of the magnitude-redshift relation due to insufficient calibration data at this epoch - only one cluster in the calibration set has a spectroscopic redshift at .
![[Uncaptioned image]](/html/astro-ph/0207243/assets/x9.png)
Color of detected galaxy overdensity as a function of published estimated redshift (see §4.2). Clusters with data are denoted by open circles; those with data are denoted by filled circles. Overlaid are passive evolution models for a flat CDM cosmology (=0.3). The dashed and solid lines are the formation redshifts of 2 and 5, respectively. In the cases where BCG misidentification leads us to revise the redshift estimate by more than 0.15 (see §4), we use crosses and open triangles to denote the original and revised redshift estimates, respectively.
4 Brightest Cluster Galaxies
The estimated redshifts of each LCDCS cluster are derived using the BCG magnitude-redshift relation, which has small scatter out to once a correction for cluster “richness” is applied (e.g. Sandage, 1988; Aragon-Salamanca et al, 1993; Aragon-Salamanca, Baugh, & Kauffmann, 1998; Collins & Mann, 1998) and should yield redshift estimates accurate to 17% (Postman & Lauer, 1995). The key concern with this approach, particularly for the LCDCS data, which are shallow and do not include colors, is the possibility that the BCG has been mis-identified. We use the VLT data to address two aspects of this concern. First, we use the color data to improve our BCG selection (see Nelson et al., 2002), and quantify any changes that occur in our redshift estimates due to the potential selection of a different galaxy as the BCG. Second, we use the deeper imaging to estimate the relative contributions of the cluster galaxies and the BCG envelope to the surface brightness feature originally used to identify the cluster. Gonzalez et al. (2000) note that the BCG in Abell 1651, a nearby cluster, contributes % to the total cluster light, so we ask whether the LCDCS coordinates are more closely aligned with the BCG or the peak of the galaxy distribution in the smoothed galaxy density maps.
![[Uncaptioned image]](/html/astro-ph/0207243/assets/x10.png)
Impact on the estimated redshifts of misidentification of the brightest cluster galaxy in the original LCDCS data. Histogram of the redshift error due to misidentification for all 34 candidates with confirmed red galaxy overdensities. The filled region denotes clusters with published estimated redshifts . Comparison of the revised estimates with the published values for the 34 confirmed targets.
4.1 BCG Identification
Because the LCDCS had no color information, the identification of the BCG was confined within a projected separation of 15, 80 kpc, from the centroid of the detected surface brightness fluctuation to minimize contamination. An evident concern is that the BCG may not lie within a projected separation of 15 and so we may overestimate the cluster redshift. To test whether this is a significant problem we have compared our initial results with those obtained using color-selected BCGs and much larger search radii and find only a modest effect (Nelson et al., 2002). We redo that test with these new data.
We define the BCG to be the brightest galaxy within a projected radius of 350 kpc from the peak of the galaxy distribution that has a color within 0.2 mag of the fitted E/S0-sequence. To implement color selection, we obtain a more precise measurement of the location of the E/S0 sequence by using the adaptive kernel to perform a second, finer grid search through color space using a narrower color window (0.2 mag) than we did for cluster identification. While the EDisCS data is employed for the color selection, we use the LCDCS survey data in the passband (the wide, optical filter used for the LCDCS) to obtain the magnitude of the brightest galaxy (the LCDCS magnitude-redshift relation is calibrated in the -band). The search radius is a compromise between maximizing the probability of including the BCG and minimizing the number of bright foreground galaxies with similar colors. We choose a radius of 350 kpc ( at ) because 90% of local BCG’s in Abell and ACO clusters lie within this radius of the cluster center (Postman & Lauer, 1995). Because three of the clusters (LCDCS 0632, LCDCS 0633, LCDCS 0634) are at small projected separations from one another, we decrease the search radius to 200 kpc for these three systems. We find that 79% of BCGs lie within 15 of the centroid of surface brightness fluctuation detected in the LCDCS. The concentration of color-selected BCGs at projected separations kpc (see Figure 4.2) suggests that the typical BCG is within this projected radius at both and .
4.2 Estimated Redshifts
Once the BCG is identified, we use the original LCDCS photometry and Equation 8 from Gonzalez et al. (2001) to determine revised estimated redshifts. Figure 4 presents a histogram of the differences in estimated redshifts relative to the original catalog. For the 34 candidates with confirmed galaxy overdensities from §3, the BCG identification differs from Gonzalez et al. (2001) in sixteen cases (47%). In 12 of these cases, the BCG from Gonzalez et al. (2001) fails the color selection (including three objects that are point sources in the deeper imaging). These objects are typical bluer than the red sequence and are likely foreground contaminants (although some may indeed be cluster galaxies with strong star formation). In the other four cases, the new BCG identification is a galaxy further than 15 from the published cluster location.
Despite the high incidence of BCG misidentification, in only six cases
(18%) does the new identification change the estimated redshift by
. This result is consistent with the published
rms uncertainties of 13% at and 20% at
for the estimated redshifts, although as noted by
Gonzalez et al. (2001) the uncertainties are not symmetric about .
In four of the six cases where the change in redshift is significant,
was overestimated because the BCG is at a projected radius that is
greater than the LCDCS search radius (). In the other two
cases a foreground galaxy and a star were mistakenly identified as the
brightest cluster galaxies in the LCDCS data (which is in a single
filter and has an average image quality of 1.5 arcsec). Figure
4 shows the impact of these errors. The net result
is that 3 of the candidates with published redshifts
should have estimated redshifts based upon the new BCG
identification (19%), while one cluster with published value
should have an estimated redshift . The
other cluster with a significantly underestimated redshift had a
published value
=0.78, and so remains
in the high-redshift bin. A definitive assessment of the robustness
of the redshift estimates awaits spectroscopic observations of the
EDisCS candidates, but this analysis indicates that targeted searches
using the LCDCS catalog should expect of order 15-20% of candidates
to have redshifts that differ from that published by
due to BCG misidentification. This conclusion agrees with that of
Gonzalez et al. (2001).
![[Uncaptioned image]](/html/astro-ph/0207243/assets/x11.png)
![[Uncaptioned image]](/html/astro-ph/0207243/assets/x12.png) - The distribution of angular separations between the published LCDCS
coordinates and the peak galaxy overdensity for the 37 candidates with
3 detections within 1 of the published coordinates.
- The solid histogram is the distribution of projected separations (in kpc) between the LCDCS coordinates and the BCG for the 34 candidates with
confirmed red galaxy overdensities
from §3. For comparison, the overlaid dashed
histogram shows the separations between the LCDCS coordinates and peak
galaxy density for these clusters.
- The distribution of angular separations between the published LCDCS
coordinates and the peak galaxy overdensity for the 37 candidates with
3 detections within 1 of the published coordinates.
- The solid histogram is the distribution of projected separations (in kpc) between the LCDCS coordinates and the BCG for the 34 candidates with
confirmed red galaxy overdensities
from §3. For comparison, the overlaid dashed
histogram shows the separations between the LCDCS coordinates and peak
galaxy density for these clusters.
4.3 Alignments and Structure
The LCDCS detection of “clustered” photons does not discriminate
amongst the possible sources of those photons. The surface brightness
feature could be dominated by unresolved galaxies or the extended BCG
halo. The degree to which each of those contributes to the surface
brightness fluctuation dictates what type of cluster we are most
likely to identify and impacts the estimate of the cluster mass.
We compare the alignment of the BCGs and peak galaxy overdensities
with
![[Uncaptioned image]](/html/astro-ph/0207243/assets/x13.png)
![[Uncaptioned image]](/html/astro-ph/0207243/assets/x14.png) (a) Absolute magnitude of the red sequences as a function of
surface brightness, . The surface brightness has been multiplied by
to account for E+ corrections and cosmological dimming (Gonzalez et al., 2000).
The cross in the lower left corner denotes the typical error bars for each data point
(including redshift uncertainty), while the arrow shows the magnitude and direction
by which a data point would move if the redshift estimate were increased by 0.1.
(b) Significance of galaxy overdensity as a function of .
(a) Absolute magnitude of the red sequences as a function of
surface brightness, . The surface brightness has been multiplied by
to account for E+ corrections and cosmological dimming (Gonzalez et al., 2000).
The cross in the lower left corner denotes the typical error bars for each data point
(including redshift uncertainty), while the arrow shows the magnitude and direction
by which a data point would move if the redshift estimate were increased by 0.1.
(b) Significance of galaxy overdensity as a function of .
the LCDCS detections in Figure 4.2. It appears that these clusters have established their dynamical centers and that galaxies within the core region have relaxed into a common potential well by . While the brightest cluster galaxy locations are well-correlated with the LCDCS detections (79% lie within 15), we note that they are no better aligned than the peak galaxy overdensity. For the six cases in which the peak galaxy overdensity and BCG location are not coincident ( separation), the LCDCS coordinates are closer to those of the galaxy overdensity than to those of the BCG in four instances. Thus, the LCDCS surface brightness detections appear to be more sensitive to the contribution of the unresolved cluster galaxies than to the light from the extended halo of the BCG.
5 The LCDCS Mass Estimates
In addition to redshift estimates, the LCDCS also provides a coarse means of estimating cluster masses. Specifically, Gonzalez et al. (2001) finds that the peak surface brightness of the LCDCS cluster detections, , is strongly correlated with X-ray temperature and velocity dispersion (linear correlation coefficients =0.80 and =0.82) for a calibration sample of roughly ten clusters. While we are unable to test these mass predictions with the current data set, we do check whether the peak surface brightness is correlated with either the absolute magnitude of the cluster red sequence (Figure 4.3) or the significance of the galaxy overdensity detection (Figure 4.3). For the former, we compute the total background-subtracted magnitude for galaxies within 100kpc of the peak galaxy overdensity with colors within 0.2 mag of the red sequence. We then compute the absolute magnitude for a flat CDM cosmology. We find that there is a weak correlation between the absolute magnitude of the red sequence and the peak surface brightness (=0.4); however, we refrain from deriving quantitative conclusions at present. Redshift errors move points on a track nearly parallel to the observed correlation (as indicated by the arrow in the Figure), and are sufficiently large to preclude robust conclusions. Spectroscopic redshifts will be required to disentangle this effect. We also find that the significance of the galaxy overdensity peak is weakly correlated with the absolute magnitude of the red sequence (=0.4). However, we find no significant correlation between the strength of the galaxy overdensity and the LCDCS surface brightness (Figure 4.3), possibly due to the large scatter in both quantities.
6 Summary and Discussion
In this paper we present results from the initial phase of the ESO Distant Cluster Survey (EDisCS), using VLT imaging to better characterize the Las Campanas Distant Cluster Survey catalog. We first use smooth density maps of the color-selected galaxy distribution to confirm cluster candidates. We find that 93% (28/30) of the EDisCS targets are coincident with statistically significant overdensities of red galaxies, as are 60% (6/10) of serendipitously imaged LCDCS candidates. The latter number is consistent with the contamination rate published by Gonzalez et al. (2001) for a randomly-selected subsample of the LCDCS with the same redshift distribution. In addition to confirming a set of promising LCDCS candidates for further study, we also use the photometry to identify the brightest cluster galaxies and use these identifications to test the robustness of the estimated redshifts published in the LCDCS catalog. We find that misidentification leads to redshift errors in 6/34 cases (18%), which is also consistent with predictions from Gonzalez et al. (2001). In addition, we find that the surface brightness detection technique appears to be slightly more sensitive to the overdensity of unresolved cluster galaxies than it is to diffuse emission from the extended halos of brightest cluster galaxies, indicating that the redshifts are most likely to be overestimated for dynamically unrelaxed systems in which the BCG and peak galaxy overdensity are not aligned.
Of more general interest are our findings that 1) the distribution of red cluster galaxies is generally regular and highly centrally concentrated out to , and 2) that the BCGs are also found near the concentrations of red galaxies, suggesting that the cores of clusters out to are typically dynamically relaxed. The use of photometric and spectroscopic redshifts obtained as part of EDisCS will help establish whether these conclusions hold once cluster members are identified. The above results verify that the surface brightness fluctuation technique proposed by Dalcanton (1995,1996) and employed by Gonzalez et al. (2001) is an effective method of identifying distant clusters, and demonstrate that the utility of the LCDCS catalog redshifts is not seriously compromised by misidentification of the BCG. Upcoming spectroscopy for the EDisCS will improve upon this analysis by directly testing the robustness of the redshift estimates, as well as the LCDCS predictions for the cluster velocity dispersions. These data define the sample of clusters that will comprise the EDisCS.
7 Acknowledgments
The authors thank the anonymous referee for suggestions that improved this manuscript. DZ acknowledges a fellowship from the David and Lucile Packard Foundation.
References
- Aragon-Salamanca, Baugh, & Kauffmann (1998) Aragon-Salamanca, A., Baugh, C. M., Kauffmann, G. 1998, MNRAS, 297, 427
- Aragon-Salamanca et al (1993) Aragon-Salamanca, A., Ellis, R. S., Couch, W. J., Carter, D. 1993, MNRAS, 262, 764
- Bertin & Arnouts (1996) Bertin, E., & Arnouts, S. 1996, A&AS, 313, 21
- Bruzual & Charlot (1993) Bruzual, A., Charlot, S. 1993, ApJ, 405, 538
- Burke, Collins, & Mann (2000) Burke, D.J., Collins, C.A., & Mann, R.G. 2000, ApJ, 532, L105
- Charlot, Worthey, & Bressnan (1996) Charlot, S., Worthey, G., & Bressnan, A. 1996, ApJ, 4 57, 625
- Collins & Mann (1998) Collins, C. A., & Mann, R. G. 1998, MNRAS, 297, 128
- Dalcanton (1995,1996) Dalcanton, J. J. 1995, Ph. D. thesis
- Dalcanton (1996) Dalcanton, J. J. 1996, ApJ, 466, 9
- Gladders & Yee (2000) Gladders, M.D., & Yee, H.K.C. 2000, AJ, 120, 214
- Gonzalez (2000) Gonzalez, A. H. 2000, Ph. D. Thesis, University of California at Santa Cruz.
- Gonzalez et al. (2000) Gonzalez, A. H., Zabludoff, A.I., Zaritsky, D., & Dalcanton, J. J. 2000, ApJ, 536, 561
- Gonzalez et al. (2001) Gonzalez, A. H., Zaritsky, D., Dalcanton, J. J., & Nelson, A. E. 2001, ApJS, 137, 117
- Gonzalez, Zaritsky, & Wechsler (2002) Gonzalez, A.H., Zaritsky, D., & Wechsler, R.H. 2002, ApJ, in press
- Merritt & Tremblay (1994) Merritt, D. & Tremblay, B. 1994, AJ, 108, 514
- Nelson et al. (2001) Nelson, A.E., Zaritsky, D., Gonzalez, A.H., & Dalcanton, J.J. 2001, ApJ, 563, 629
- Nelson et al. (2002) Nelson, A.E., Gonzalez, A.H., Zaritsky, D., and & Dalcanton, J.J. 2002, ApJ, 566, 103
- Olsen et al. (2001) Olsen, L. F. et al. 2001, A&A, 380, 460
- Postman & Lauer (1995) Postman, M., & Lauer, T.R., 1995, ApJ, 440, 28
- Postman et al. (1996) Postman, M., et al. 1996, AJ, 111, 615
- Sandage (1988) Sandage, A. 1988, ARA&A, 26, 561
- Stanford, Eisenhardt, & Dickinson (1998) Stanford, A., Eisenhardt, P., & Dickinson, M. 1998, ApJ, 492, 461
- White et al. (2002) White, S. D. M., et al. 2002, in prep.
- Zaritsky et al. (1997) Zaritsky, D., Nelson, A. E., Dalcanton, J. J., & Gonzalez, A. H. 1997, ApJ, 480, L91
| Primary EDisCS Targets | Serendipitously Observed Candidates | ||||||
|---|---|---|---|---|---|---|---|
| Candidate | Comments | Candidate | Comments | ||||
| LCDCS 0057 | 0.47 | 4.9 | |||||
| LCDCS 0110 | 0.78 | 5.4 | = | LCDCS 0109 | 0.44 | 2.8 | |
| LCDCS 0130 | 0.80 | 6.4 | LCDCS 0127 | 0.38 | 4.1 | (25) | |
| LCDCS 0172 | 0.76 | 4.9 | |||||
| LCDCS 0173 | 0.83 | 6.8 | |||||
| LCDCS 0188 | 0.52 | 6.4 | = | LCDCS 0190 | 0.60 | 4.9 | (25) |
| LCDCS 0198 | 0.83 | 6.6 | |||||
| LCDCS 0237 | 0.78 | 3.7 | = | ||||
| LCDCS 0252 | 0.63 | 7.5 | |||||
| LCDCS 0275 | 0.77 | 3.4 | |||||
| LCDCS 0294 | 0.75 | 7.0 | |||||
| LCDCS 0340 | 0.85 | 5.3 | = | LCDCS 0337 | 0.47 | 4.1 | |
| LCDCS 0430 | 0.49 | 4.2 | |||||
| LCDCS 0458 | 0.79 | 3.9 | (25) | LCDCS 0457 | 0.74 | 6.7 | |
| LCDCS 0504 | 0.80 | 10.4 | |||||
| LCDCS 0531 | 0.79 | 6.1 | |||||
| LCDCS 0541 | 0.48 | 5.3 | |||||
| LCDCS 0567 | 0.47 | 2.9 | |||||
| LCDCS 0634 | 0.48 | 6.0 | LCDCS 0632 | 0.57 | 4.0 | ||
| LCDCS 0633 | 0.43 | 5.1 | |||||
| LCDCS 0642 | 0.54 | 4.3 | LCDCS 0641 | 0.66 | 3.8 | ||
| LCDCS 0665 | 0.78 | 3.5 | |||||
| LCDCS 0674 | 0.78 | 4.2 | |||||
| LCDCS 0713 | 0.53 | 5.0 | = | ||||
| LCDCS 0849 | 0.50 | 4.4 | |||||
| LCDCS 0853 | 0.84 | 8.6 | |||||
| LCDCS 0855 | 0.51 | 5.3 | LCDCS 0854 | 0.43 | 3.4 | ||
| LCDCS 0925 | 0.47 | 10.4 | LCDCS 0926 | 0.68 | 1.1 | Spurious (LSB) | |
| LCDCS 0952 | 0.49 | 5.2 | |||||
| LCDCS 0975 | 0.78 | 4.9 | = | ||||
| LCDCS 1027 | 0.77 | 3.0 | |||||
Note. — In the comments, 25 refers to the separation between the peak galaxy overdensity and the published LCDCS coordinates, while denotes the change in estimated redshift due to the revised identification of the BCG. We only list this value for candidates where the redshift estimate changed by .