CHANDRA Detects Relativistic Broad Absorption Lines from APM 08279+5255
Abstract
We report the discovery of X-ray broad absorption lines (BALs) from the BALQSO APM 08279+5255 originating from material moving at relativistic velocities with respect to the central source. The large flux magnification by a factor of 100 provided by the gravitational lens effect combined with the large redshift () of the quasar have facilitated the acquisition of the first high signal-to-noise X-ray spectrum of a quasar containing X-ray BALs. Our analysis of the X-ray spectrum of APM 08279+5255 places the rest-frame energies of the two observed absorption lines at 8.1 and 9.8 keV. The detection of each of these lines is significant at the 99.9% confidence level based on the -test. Assuming that the absorption lines are from Fe xxv K, the implied bulk velocities of the X-ray BALs are and , respectively. The observed high bulk velocities of the X-ray BALs combined with the relatively short recombination time-scales of the X-ray absorbing gas imply that the absorbers responsible for the X-ray BALs are located at radii of 2 1017 cm, within the expected location of the UV absorber. With this implied geometry the X-ray gas could provide the necessary shielding to prevent the UV absorber from being completely ionized by the central X-ray source, consistent with hydrodynamical simulations of line-driven disk winds. Estimated mass-outflow rates for the gas creating the X-ray BALs are typically less than a solar mass per year. Our spectral analysis also indicates that the continuum X-ray emission of APM 08279+5255 is consistent with that of a typical radio-quiet quasar with a spectral slope of = 1.72.
1 INTRODUCTION
It is commonly accepted that most quasars contain energetic outflows of ionized gas emerging from their accretion disks at speeds ranging from 5,000–30,000 km s-1 (e.g., Turnshek et al. 1988; Weymann et al. 1991). These outflows imprint broad absorption features bluewards of the resonant UV emission lines of C iv, Si iv, N v, and O vi. Broad absorption features are expected to be observed only for lines of sight that traverse the outflow. The outflow is thought to be driven by radiation pressure on spectral lines from UV photons of the central source (e.g., Arav et al. 1995; Murray et al. 1995; Proga, Stone, & Kallman 2000; Srianand et al. 2002). An estimate of the mass-outflow rate may result from the study of the properties of the outflowing winds of quasars. This quantity may be used to evaluate the contribution of outflowing winds in distributing accretion-disk material into the vicinity of the quasar central engine and into the host galaxy over a typical life time of a quasar. Constraining this rate is also important for understanding the connection between black hole and bulge growth in the host galaxy (e.g., Fabian 1999).
An estimate of the mass-outflow rate requires knowledge of the velocities and locations of the various ions that contribute to the wind. Broad absorption features in the UV band often show multiple detached components with different velocities, column densities, and ionization states. One needs to include the contributions of all components to obtain an accurate value of the total mass-outflow rate. Present estimates of mass-outflow rates are based mostly on the contributions from ions absorbing in the rest-frame UV band. The present X-ray data for BALQSOs are sparse, and only poor to moderate signal-to-noise ratio (S/N) spectra are available (e.g., Chartas et al. 2001; Gallagher et al. 2001; Green et al. 2001; Oshima et al. 2001; Brinkmann et al. 2002; Gallagher et al. 2002). The few moderate S/N X-ray spectra of BALQSOs available show that their X-ray faintness is due to absorption with typical hydrogen column densities ranging from 1022–1024 cm-2. The ionization, kinematic and spatial properties of the X-ray absorbing material are not well constrained. The physical relationship between the UV and X-ray absorbers is unclear. Is the X-ray absorber part of the outflow? Another unresolved issue is how moderately ionized species can survive the extreme UV and soft X-rays produced by the central source. To account for this, theoretical studies have postulated the presence of an optically thick layer of shielding gas between the central source and the outflow that prevents the outflow from becoming completely ionized (e.g., Murray et al. 1995). Recent simulations by Proga et al. (2000) indicate that the outflow is self-shielding, i.e., the shielding gas is an integral component of the outflow. The observed X-ray absorbing gas in BALQSOs has been suggested as a candidate for the shielding gas; however, there has been little direct observational evidence for this association. Recently, narrow absorption lines (NALs) in the X-ray band have been detected in Chandra and XMM-Newton observations of bright Seyfert 1 galaxies (e.g., Kaspi et al. 2002). The NALs are blueshifted relative to the systemic velocity suggesting that the NAL material is part of an outflow with a mean outflow velocity of a few hundred km s-1.
To improve our understanding of the X-ray absorption in BALQSOs, we performed a long Chandra observation of the bright gravitationally lensed BAL quasar APM 08279+5255. The flux magnification of APM 08279+5255, estimated to be 100 (Egami et al. 2000; Muñoz et al. 2001) in the X-ray band, and its high redshift of allowed us to study the kinematic and ionization properties of a BAL quasar in the X-ray band. Specifically, the high redshift of APM 08279+5255 places the strong Fe K features at energies where the telescope effective area is much larger. Here we present the results of these observations.
2 OBSERVATION AND DATA REDUCTION
APM 08279+5255 was observed as part of the guaranteed time observer program with the Advanced CCD Imaging Spectrometer (ACIS) instrument (G. P. Garmire et al. 2002, in preparation) onboard the Chandra X-ray Observatory (CXO) on 2000 October 11 and on 2002 February 24 for 9.2 ks and 88.8 ks, respectively. The pointing of the telescope placed APM 08279+5255 on the back-illuminated S3 chip of ACIS. In Table 1 we list the observation epochs, exposure times and detected event rates for the lensed images (see 3). For preparing the Chandra data for analysis we used the CIAO 2.2 and CALDB 2.12 products provided by the Chandra X-ray Center (CXC). To improve the spatial resolution we removed a 025 randomization applied to the event positions in the CXC processing and employed a sub-pixel resolution technique developed by Tsunemi et al. (2001). To account for the recently observed quantum efficiency decay of ACIS, possibly caused by molecular contamination of the ACIS filters, we have applied a time-dependent correction to the ACIS quantum efficiency based on the presently available information from the CXC. The ACIS quantum efficiency decay is insignificant for energies above 1 keV and does not affect the main results of our analysis.
3 RELATIVE ASTROMETRY AND PHOTOMETRY
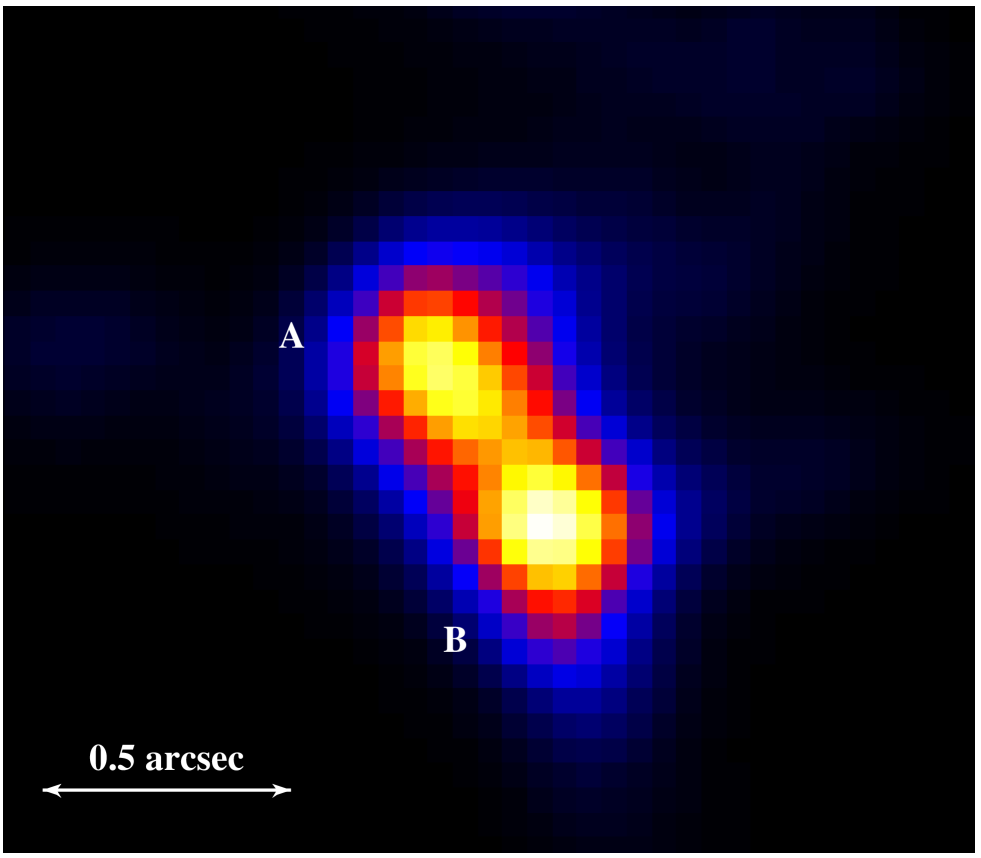
The Chandra image of APM 08279+5255 obtained from the 88.8 ks observation is
shown in Figure 1. To improve the spatial resolution we have
applied the Lucy-Richardson (L-R) maximum likelihood
deconvolution technique (Richardson 1972; Lucy 1974). For the deconvolution we supplied a
point spread function (PSF) created by the simulation tool MARX (Wise
et al. 1997). The X-ray spectrum used to generate the PSF was that
determined from our spectral analysis (see 4).
We find a separation between the X-ray images A and B of 038 001.
Recent observations of APM 08279+5255 with the NICMOS camera onboard
HST (Ibata et al. 1999) imply the presence of three
images with a separation between the two brightest
images A and B of =038
and between A and the fainter image C of =01.
To estimate the X-ray flux ratios we modeled the Chandra images of A, B and C with
point spread functions generated by the simulation tool MARX.
The X-ray event locations were binned with a bin-size of 00246.
The simulated PSFs were fit to the Chandra data by minimizing the
Cash statistic formed between the observed and simulated images
of APM 08279+5255. The relative positions of the images were fixed to
the observed NICMOS values. We find X-ray flux ratios of
and .
The X-ray flux ratios are close to the flux ratios measured in the
HST F160 band of
and .
We briefly comment that X-ray flux variability is detected in both images of APM 08279+5255,
and this issue will be the focus of a future paper.
4 SPECTRAL ANALYSIS
Spectra of APM 08279+5255 from the combined images for the two epochs were first extracted and analyzed separately to search for any significant long-term variability. The source spectra were extracted from circular regions centered on the midpoint between images A and B with radii of 3′′. The background was determined by extracting events within a source-free annulus centered on the midpoint between images A and B with inner and outer radii of 10′′ and 30′′, respectively. All derived errors below are at the 90% confidence level unless quoted otherwise. Results from spectral fits to the 9.1 ks observation of APM 08279+5255 were reported in Gallagher et al. (2002). The X-ray flux of APM 08279+5255 appears to have decreased by a factor of 2 between the first and second epochs (see Table 1). Unfortunately, there was a moderate degree of photon pile-up in the first observation of APM 08279+5255 which can lead to spectral distortions and loss of events. We therefore did not combine the spectra of the first and second epochs. The second observation of APM 08279+5255 was performed in a sub-array mode to reduce the effects of pile-up. The reduced X-ray flux of APM 08279+5255 during the second epoch and the reduced CCD frame-time of 2.5 s used for this observation significantly reduced the effects of pile-up, which is negligible in the subsequent analysis. In the spectral analysis that follows we focus on the data obtained from the 88.8 ks observation of APM 08279+5255.
A variety of models were fit to the 88.8 ks spectrum of APM 08279+5255 employing the software tool XSPEC v11 (Arnaud 1996). The spectrum was initially fit with a model consisting of a simple power law with Galactic absorption due to neutral cold gas with a column density of = 3.9 1020 cm-2 (Stark et al. 1992). The model also included neutral intrinsic absorption at . Our fits support the presence of an intrinsic absorber with a column density of = (6.0) 1022 cm-2 (see Table 2). The fit is not acceptable in a statistical sense with = 182.1 for 109 degrees of freedom (dof). The fit residuals show several absorption features between 1.5–3 keV that contribute to the unacceptable fit. To illustrate better the presence of these absorption features and the absorption at energies below 1 keV, we fit the APM 08279+5255 data above the rest frame energy of 10.8 keV with a simple power-law model modified by Galactic absorption and extrapolated this model to lower energies. The spectrum above 10.8 keV (rest-frame) is less susceptible to intrinsic absorption and excludes the absorption features. Following this analysis strategy, the low-energy residuals indicate that intrinsic absorption is present in the spectrum. In addition, the spectrum shows two strong absorption lines from 1.5–3 keV; these are presented in Figure 2a. We attempt to model the residual features by considering a range of models of increasing complexity. We first add to our absorbed power-law model a redshifted Gaussian component near the most obvious absorption feature appearing at an energy of 1.65 keV (observed frame). Including one Gaussian component in our model leads to a significant improvement in fit quality at the 99.9% confidence level (according to the -test) with = 146.9 for 106 dof. The best-fit energy of the absorption feature is = 8.05 keV (rest frame). This absorption feature is in a well-calibrated energy region, and the combined effective area of the Chandra mirrors and ACIS is known to vary smoothly near this energy. The absorption feature is not resolved by ACIS; we place an upper limit on its width of 140 eV (corresponding to a FWHM of 12,300 km s-1) at the 90% confidence level. We next add a second Gaussian component near 1.9 keV to model the remaining residuals near this energy. This fit is significantly improved compared to the previous fit at the 99.9% confidence level and yields = 106.7 for 103 dof; the fit is now statistically acceptable. The best-fit value for the photon index is , consistent with the range of measured for large samples of radio-quiet quasars at lower redshifts (e.g., George et al. 2000; Reeves & Turner 2000). The best-fit energy for the second absorption line is = 9.79 keV with a width of = 0.41 keV. The second absorption feature falls near the instrumental iridium edge produced by the Chandra mirrors. To ascertain any systematic calibration uncertainties near the mirror edge we have fit the spectra of several test-sources111The test-sources observed with ACIS S3 are the supernova remnant G21.5-0.9 observed on 2001 March 18, the millisecond pulsar J0437-4715 observed on 2000 May 29 and the radio-loud quasar Q0957+561 observed on 2000 April 16. with expected smooth power-law spectra near the 2 keV iridium edge. Since residuals depend on the statistics, we filtered the test-source data in time to produce spectra with a total number of counts equal to that observed in the second observation of APM 08279+5255. Typical residuals for these test-sources near the mirror edge are less than 1 indicating that the observed 5 residuals near 2 keV are real and not due to systematic errors in the calibration of the effective area of the Chandra mirrors. We find a ratio of 0.5 between data and model near the two absorption features for the second observation of APM 08279+5255. This ratio is significantly less than the observed ratio of 0.95 between data and model for our test-sources. The fit that includes two Gaussian absorption-line components shows positive residuals near 8.4 keV and 11.2 keV (rest frame). These residuals may at least partially be the result of the simplistic absorption-line models that we have adopted in the present analysis. UV BALs usually show multiple absorption components with non-Gaussian profiles, and such complex profiles may also be present in X-ray BALs. To test further the robustness of our modeling we also attempted to fit the 1.5–3 keV residuals in Figure 2a with a model that included an absorption edge. Specifically, for a model consisting of a simple power law with Galactic absorption, intrinsic absorption, and one absorption edge we find a best fit energy and optical depth of the edge of = 7.68 keV and = 0.37, respectively. This model did not provide an acceptable fit with = 146 for 107 dof. In Figure 2b we show that the fit of the APM 08279+5255 spectrum with a one-edge model produces significant residuals. The reason for these large residuals is that the absorption edge is too broad to fit the narrow absorption lines. The addition of a second absorption edge to the model did not result in a significant improvement of the fit.
5 DISCUSSION AND CONCLUSIONS
Our analysis of the Chandra spectrum of APM 08279+5255 shows strong evidence for the presence of absorption lines at rest-frame energies of 8.05 keV and 9.79 keV (fit 3 of Table 2). Of all the abundant elements, iron absorption lines would be the closest in energy to the observed features. In this sense, our interpretation that the absorption lines are associated with Fe K absorption is the most conservative one possible (e.g., absorption lines from relativistic oxygen would require much larger blueshifts). At higher atomic numbers than iron (corresponding to higher absorption-line energies), there are no abundant elements. Observationally, Fe K absorption lines have been seen from other objects, such as the X-ray binaries GRS 1915+105 (Kotani et al. 2000), Circinus X-1 (Brandt & Schulz 2000), and GX 13+1 (Ueda et al. 2001) and possibly the AGN NGC 3516 (Nandra et al. 1999). We note that the expected ratios of the energies of the iron K to K transitions of Fe xxv and Fe xxvi are just outside the 2 confidence limits of the ratio of the energies of the two observed absorption lines. Because of the possible presence of multiple components within each of the observed absorption lines, we expect that future X-ray observations of APM 08279+5255 with higher energy resolution will unambiguously show whether the observed absorption lines correspond to the K and K transitions of Fe xxv or Fe xxvi.
A plausible site that may be producing the absorption features is the outflowing disk wind. Complex absorption features are also observed in the UV spectrum of APM 08279+5255. In particular, recent high resolution spectroscopy of APM 08279+5255 reveals multiple velocity components of C iv (1548 Å, 1551 Å), at 4670 km s-1, 9670 km s-1, and 12,400 km s-1 (Srianand & Petitjean 2000). Broad absorption due to O vi (1032 Å, 1037 Å), N v(1238 Å, 1242 Å) and Si iv (1393 Å, 1402 Å) is also detected. The wide range of ionization levels, velocities and column densities inferred from the UV BALs of APM 08279+5255 imply that the wind may be composed of multiple regions of different densities, with large ionization gradients (Srianand & Petitjean 2000). For our estimate of the ejection velocities of the absorbers we assume as argued above that the X-ray absorption features are due to absorption from Fe ions in the flow. The rest energies of the most likely resonant absorption lines of Fe are 6.70 keV (Fe xxv K), 7.88 keV (Fe xxv K), 6.97 keV (Fe xxvi K) and 8.25 keV (Fe xxvi K). We estimate that the 8.05 keV and 9.79 keV absorption features correspond to wind velocities (depending on the ionization state of Fe) of (Fe xxv K), (Fe xxvi K) and (Fe xxv K), (Fe xxvi K) respectively, relative to the systemic redshift of . For the velocity calculations we considered the special relativistic velocity correction and assumed that the angle between the wind velocity and our line of sight is 20∘. This angle is not constrained with the present data; however, hydrodynamical simulations indicate that the BAL wind opening angle may range between 10∘–30∘ depending on the location of the inner radius of the disk. We examined the low-resolution optical spectrum of APM 08279+5255 presented in Ellison et al. (1999) for evidence of notable absorption in C iv, Si iv, and N v with velocities consistent with the X-ray absorption lines. In the spectral region covered, no strong systems were apparent, though a detailed analysis of a high-resolution spectrum (such as that presented in Srianand & Petitjean 2000 for lower velocities) remains to be done. The non-detection of these ions is not a serious problem as they probably are not present in such a highly ionized gas.
To obtain some insight into the kinematics of the wind flow and the relative locations of the UV and X-ray absorbers, we calculated the wind velocity as a function of radius. More realistic velocity profiles of disk outflows have been obtained from hydrodynamical calculations (e.g., Proga et al. 2000) that predict radial and azimuthal variations of the wind velocity. For the purposes of our simple analysis we assume that the velocity of an outflow produced by radiation pressure from a central source with a UV luminosity of and a mass of is given by:
| (1) |
where is the Eddington luminosity, is the force multiplier (see the discussion of in Laor & Brandt 2002), is the radius at which the wind is launched from the disk, and is the distance of the accelerated portion of the flow from the central source. In Figure 3 we plot wind velocity versus radius for material launched at radii of 2 1017 cm, 5 1017 cm and 1 1018 cm. We have assumed = 100 (e.g., Arav, Li, & Begelman 1994), = 4 1046 erg s-1, = 2 1047 erg s-1, and / = 0.1. Simulations performed by Proga et al. (2000) for a disk accreting onto a 108 black hole yield a minimum launching radius for the UV absorber of 1016 cm. Scaling this result for the likely black hole mass of APM 08279+5255 of 2 1010 , we estimate a minimum launching radius for the UV absorber of 2 1017 cm for this luminous quasar. From a qualitative perspective our velocity curves indicate that the wind reaches nearly its terminal velocity close to the launching radius. A possible explanation of the relatively large velocities of the X-ray BALs compared to the UV BALs is that the material creating the X-ray BALs is launched at smaller radii; the relatively small launching radii implied are consistent with the higher degree of ionization needed to produce the observed absorption lines if they are due to Fe xxv and/or Fe xxvi. A rigorous calculation of the velocity of the X-ray BAL wind is beyond the scope of this letter. We note, however, that the largest unknown in this estimation is the value of , which will depend on the ionization state and velocity structure of the gas. If the observed X-ray absorption is due to Fe xxv, the high ionization parameter of this gas indicates that only heavier metals will still have any electrons. In this case, the dominant radiation pressure may be provided by X-rays rather than UV photons. Specifically, such highly ionized gas will be driven primarily by bound-free absorption and Compton scattering, though considerable non-thermal broadening may cause bound-bound absorption to contribute significantly as well (e.g., Chelouche & Netzer 2001; D. Chelouche 2002, private communication). A comparison between the recombination time-scale of the ionized wind, , and the travel-time, , for the gas to reach a certain distance from the launching radius can constrain the location of the material making the X-ray BALs. For we expect the X-ray BAL material to be at small radii (near the launching radius) to account for the high ionization. If the X-ray BAL can be located significantly away from the launching radius. The recombination time-scale for Fe xxv is s, where K is the electron temperature and cm-3 is the electron number density (Allen 1973). For a range of electron densities of 1 107 cm-3 to 1 1010 cm-3 (hydrodynamical models of line-driven disk winds by Proga et al. 2000 predict electron number densities at the base of the wind of 5 107 cm-3 to 5 109 cm-3) we find the recombination time-scales to range between 4.4 103 s and 4.4 s. For a launching radius of 2 1016 cm the amount of time needed for the radiatively driven gas to reach a distance of 5 1016 cm from the launching radius is 4 106 s. We conclude that implying that the X-ray BAL material is located at relatively small radii ( 2 1017 cm ) near the launching radius of the wind. Again this geometry explains both the high velocity of the observed X-ray BALs and the high ionization needed to obtain Fe xxv or Fe xxvi.
Using a curve of growth analysis (Spitzer 1978) we estimated the hydrogen column densities implied by the observed equivalent widths of the two absorption lines at 8.05 and 9.79 keV. Assuming the ion species responsible for the X-ray absorption in both lines is Fe xxv and parameters of the order of the observed widths of the lines (, where is the velocity width of the line), we calculate that the column densities of the absorbers are (3.4) 1018 cm-2 and (3.8) 1018 cm-2, respectively. For no ionization correction and assuming solar abundances, the implied total hydrogen column densities of these absorbers are (1.0) 1023 cm-2 and (1.1) 1023 cm-2, respectively. We emphasize that there are significant limitations with the present curve of growth analysis; the absorption lines may contain multiple unresolved components implying that the equivalent widths and parameters used should be considered as upper limits. In addition, the velocity widths estimated from fits of Gaussian lines to observed absorption features can only be used to derive parameters when the absorber is optically thin. It is not clear from the present data if the intrinsic absorber which attenuates the low-energy continuum and the absorber responsible for the absorption lines are the same. The models adopted in Table 2 assume neutral absorption at . For an ionized absorber or for the case where there is partial covering, one expects the estimated hydrogen column density to be even larger than the value estimated assuming a neutral absorber (i.e., a fit to the spectrum of APM 08279+5255 with an ionized absorber having an ionization parameter of yields a column density of = 7.5 1022 cm-2). We note that the low-energy absorption could include overlapping BALs from H-like and He-like ions of Mg, Si, and S that perhaps could still survive along with the highly ionized H-like and He-like ions of Fe (eg., Kallman & Bautista 2001). Based on our estimated column densities of the X-ray BALs, we calculated the strengths of the associated absorption edges of Fe xxv (Fe xxvi) to be 0.07( 0.04). We added these absorption edges to our spectral model for APM 08279+5255 (fit 3 of Table 2) and found that we do not expect them to be detectable, consistent with the data.
The observed relativistic velocities, crude estimates of the column densities, and locations of the X-ray BALs allow us to place constraints on the mass-outflow rate for APM 08279+5255. We estimated the mass-outflow rate as a function of the distance to the absorber for ranging from 1–10, where is the thickness of the absorber. We assumed a hydrogen column density of = 1 1023 cm-2, a covering fraction of 0.2, and a wind velocity of . To obtain a reasonable mass-outflow rate (e.g., Proga et al. 2000) of 1 M⊙ year-1 the radial location of the gas creating the X-ray BALs must be less than 1017 cm which is consistent with the radius implied from the observed high velocities and ionization states of the X-ray BALs.
To summarize, we have reported on the discovery of the first X-ray BALs in the gravitationally lensed quasar APM 08279+5255. The energies of the two observed absorption features of 8.05 keV and 9.79 keV (rest frame) suggest the presence of two distinct absorption systems with velocities of and , respectively. The combination of estimated short recombination time-scales for Fe xxv and/or Fe xxvi and the observed relativistic velocities suggest that the X-ray absorbers are launched at radii of 2 1017 cm. Curve of growth estimates imply column densities of the two X-ray BALS in APM 08279+5255 of the order of 1 1023 cm-2. One of the key implications of our results is that X-ray BALs appear to be located within the UV BAL region and may therefore represent the shielding gas proposed in several theoretical studies of line-driven disk winds (e.g., Murray et. al. 1995; Proga et al. 2000). We expect future follow-up observations of APM 08279+5255 with the Chandra high-energy transmission grating and the XMM-Newton RGS to identify the absorbing ions and resolve the X-ray absorption features into multiple components allowing for tighter constraints of the properties of X-ray BALs. We also plausibly expect variability of the absorption-line profiles over short time-scales of days based on our estimates of the launching radii of the X-ray absorbers.
During the review of this paper, a related paper was posted
on the ApJL web site by Hasinger, Schartel, & Komossa (2002). They report
the detection of an ionized Fe K edge in APM 08279+5255 with XMM-Newton.
A visual comparison between the XMM-Newton and Chandra spectra of APM 08279+5255 suggests the presence of the two absorption features in both cases; however, the
equivalent widths of the absorption features appear to be reduced
during the deep XMM-Newton observation. The edge model adopted in the analysis
of the XMM-Newton spectrum of APM 08279+5255 does not provide an acceptable fit to the Chandra spectrum of this object. This may imply significant variability of the
X-ray BALs as suggested in our paper.
We thank Michael Eracleous and Doron Chelouche for useful discussions and suggestions. We acknowledge financial support from NASA grants NAS 8-38252 and NAS 8-01128. WNB acknowledges financial support from NASA LTSA grant NAG5-8107 and NASA grant NAG5-9932. SCG acknowledges financial support from NASA GSRP grant NGT5-50277 and from the Pennsylvania Space Grant Consortium.
References
Arav, N., Li, Z., & Begelman, M. C. 1994, ApJ, 432, 62
Arav, N., Korista, K. T., Barlow, T. A., & Begelman, M. C. 1995, Nature, 376, 576
Arnaud, K. A. 1996, ASP Conf. Ser. 101: Astronomical Data Analysis Software and Systems V, 5, 17
Allen, C. W., 1973, Astrophysical Quantities. Athlone Press, London
Brandt, W. N. & Schulz, N. S. 2000, ApJ, 544, L123
Brinkmann, W., Ferrero, E., & Gliozzi, M. 2002, A&A, 385, L31
Chartas, G., Dai, X., Gallagher, S. C., Garmire, G. P., Bautz, M. W., Schechter, P. L., & Morgan, N. D. 2001, ApJ, 558, 119
Chelouche, D. & Netzer, H. 2001, MNRAS, 326, 916
Ellison, S. L., Lewis, G. F., Pettini, M., Sargent, W. L. W., Chaffee, F. H., Foltz, C. B., Rauch, M., & Irwin, M. J. 1999, PASP, 111, 946
Egami, E., Neugebauer, G., Soifer, B. T., Matthews, K., Ressler, M., Becklin, E. E., Murphy, T. W., & Dale, D. A. 2000, ApJ, 535, 561
Fabian, A. C. 1999, MNRAS, 308, L39
Gallagher, S. C., Brandt, W. N., Laor, A., Elvis, M., Mathur, S., Wills, B. J., & Iyomoto, N. 2001, ApJ, 546, 795
Gallagher, S. C., Brandt, W. N., Chartas, G., & Garmire, G. P. 2002, ApJ, 567, 37
George, I. M., Turner, T. J., Yaqoob, T., Netzer, H., Laor, A., Mushotzky, R. F., Nandra, K., & Takahashi, T. 2000, ApJ, 531, 52
Green, P. J., Aldcroft, T. L., Mathur, S., Wilkes, B. J., & Elvis, M. 2001, ApJ, 558, 109
Hasinger, G., Schartel, N., & Komossa, S. 2002, ApJ, 573, L77
Ibata, R. A., Lewis, G. F., Irwin, M. J., Lehár, J., & Totten, E. J. 1999, AJ, 118, 1922
Kaspi, S., Brandt, W. N., George, I. M., Netzer, H., Crenshaw, D. M., Gabel, J. R., Hamann, F. W., Kaiser, M. E., Koratkar, A., Kraemer, S. B., Kriss, G. A., Mathur, S., Mushotzky, R. F., Nandra, K., Peterson, B., Shields, J. C., Turner, T. J., & Zheng W. 2002, astro-ph/0203263
Kallman, T. & Bautista, M. 2001, ApJS, 133, 221
Kotani, T., Ebisawa, K., Dotani, T., Inoue, H., Nagase, F., Tanaka, Y., & Ueda, Y. 2000, ApJ, 539, 413
Laor, A. & Brandt, W. N. 2002, ApJ, 569, 641
Lucy, L. B. 1974, AJ, 79, 745
Muñoz, J. A., Kochanek, C. S., & Keeton, C. R. 2001, ApJ, 558, 657
Murray, N., Chiang, J., Grossman, S. A., & Voit, G. M. 1995, ApJ, 451, 498
Nandra, K., George, I. M., Mushotzky, R. F., Turner, T. J., & Yaqoob, T. 1999, ApJ, 523, L17
Oshima, T., Mitsuda, K., Fujimoto, R., Iyomoto, N., Futamoto, K., Hattori, M., Ota, N., Mori, K., Ikebe, Y., Miralles, J. M., & Kneib, J.-P., 2001, ApJ, 563, L103
Proga, D., Stone, J. M., & Kallman, T. R. 2000, ApJ, 543, 686
Reeves, J. N. & Turner, M. J. L. 2000, MNRAS, 316, 234
Richardson, W. H. 1972, Optical Society of America Journal, 62, 55
Spitzer, L. 1978, Physical Processes in the Interstellar Medium (New York: Wiley)
Srianand, R. & Petitjean, P. 2000, A&A, 357, 414
Srianand, R., Petitjean, P., Ledoux, C., & Hazard, C. 2002, MNRAS, in press, astro-ph/0205524
Stark, A. A., Gammie, C. F., Wilson, R. W., Bally, J., Linke, R. A., Heiles, C., & Hurwitz, M. 1992, ApJS, 79, 77
Turnshek, D. A., Grillmair, C. J., Foltz, C. B., & Weymann, R. J. 1988, ApJ, 325, 651
Tsunemi, H., Mori, K., Miyata, E., Baluta, C., Burrows, D. N., Garmire, G. P., & Chartas, G. 2001, ApJ, 554, 496
Ueda, Y., Asai, K., Yamaoka, K., Dotani, T., & Inoue, H. 2001, ApJ, 556, L87
Weymann, R. J., Morris, S. L., Foltz, C. B., & Hewett, P. C. 1991, ApJ, 373, 23
Wise, M. W., Davis, J. E., Huenemoerder, Houck, J. C., Dewey, D. Flanagan, K. A., and Baluta, C. 1997, The MARX 3.0 User Guide, CXC Internal Document available at http://space.mit.edu/ASC/MARX/
| TABLE 1 | |||||||
|---|---|---|---|---|---|---|---|
| Log of Observations of APM 08279+5255 | |||||||
| Observation | Obsid | Exposure | a | a | a | b | c |
| Date | Time | ||||||
| (s) | 10-2 cnts s-1 | 10-2 cnts s-1 | 10-2 cnts s-1 | 10-2 cnts s-1 | 10-6 cnts s-1 pixel-1 | ||
| 2000 Oct 11 | 1643 | 9,137 | d | d | d | 10.96 0.34 | 1.68 0.22 |
| 2002 Feb 24 | 2979 | 88,817 | 3.1 0.07 | 2.8 0.06 | 0.66 0.07 | 6.56 0.09 | 0.99 0.05 |
NOTES:
a , and are the event rates for images A, B and C estimated
from a two-dimensional fit to the Chandra image of APM 08279+5255.
Only events with standard ASCA grades 0,2,3,4,6
and with energies from 0.2–10 keV were used in the
binned image.
b is the detected event rate from APM 08279+5255 extracted from a circular region centered on the midpoint of images A and B
with a radius of 3′′. Only events with standard ASCA grades 0,2,3,4,6
and with energies from 0.2–10 keV were extracted.
c is the detected background event rate per ACIS pixel (1 ACIS pixel = 0492) extracted
from an annulus centered on APM 08279+5255 with inner and outer radii of 10′′ and 30′′, respectively.
Only events with standard ASCA grades 0,2,3,4,6
and with energies from 0.2–10 keV were extracted.
d It was not possible to determine the individual count rates
for the first observation of APM 08279+5255 due to the
low S/N and the presence of moderate photon pile-up.
| TABLE 2 | |||
|---|---|---|---|
| RESULTS FROM FITS TO THE COMBINED | |||
| SPECTRUM OF ALL IMAGES OF APM 08279+5255 | |||
| Fita | Model | Parameterb | Valuec |
| 1 | Power-Law (PL) and | 1.72 | |
| neutral absorption at | (6.0) 1022 cm-2 | ||
| source. | 182.1/109 | ||
| d | 1.4 10-5 | ||
| 2 | PL, neutral absorption | 1.73 | |
| at source, and one | (6.4) 1022 cm-2 | ||
| Gaussian absorption line | Eabs1 | 8.05 keV | |
| at source. | 0.140 keV | ||
| EWabs1 | 0.23 keV | ||
| 146.9/106 | |||
| d | 5.3 10-5 | ||
| 3 | PL, neutral absorption | 1.72 | |
| at source, and two | (6.7) 1022 cm-2 | ||
| Gaussian absorption lines | Eabs1 | 8.05 keV | |
| at source. | 0.140 keV | ||
| EWabs1 | 0.24 keV | ||
| Eabs2 | 9.79 keV | ||
| 0.41 keV | |||
| EWabs2 | 0.43 keV | ||
| 106.7/103 | |||
| d | 0.41 | ||
NOTES-
a All model fits include fixed, Galactic absorption of
cm-2 (Stark et al. 1992).
b All absorption-line parameters are calculated for the rest frame.
c All errors are for 90% confidence with all
parameters taken to be of interest except absolute normalization.
d is the probability of exceeding
for degrees of freedom.