Recent progress in understanding the hot and warm gas phases in the halos of star-forming galaxies
Abstract
In this contribution we present a few selected examples of how the latest generation of space-based instrumentation – NASA’s Chandra X-ray Observatory and the Far-Ultraviolet Spectroscopic Explorer (FUSE) – are finally answering old questions about the influence of massive star feedback on the warm and hot phases of the ISM and IGM. In particular, we discuss the physical origin of the soft thermal X-ray emission in the halos of star-forming and starburst galaxies, its relationship to extra-planar H emission, and plasma diagnostics using FUSE observations of O vi absorption and emission.
Dept. of Physics & Astronomy, The Johns Hopkins University, 3400 N. Charles St., Baltimore, MD 21218, USA.
NASA/GSFC, Code 662, Greenbelt, MD 20771, USA.
1. Introduction – the hot phases as viewed by Chandra and FUSE
Massive stars exercise a profound influence over the baryonic component of the Universe, through their return of ionizing radiation, and via supernovae (SNe), kinetic energy and metal-enriched gas, back into the ISM from which they form — usually called “feedback”. Feedback influences gas-phase conditions in the immediate environment of the clusters within which the massive stars form, on galactic-scales the phase structure and energetics of the ISM, and on multi-Mpc scales the thermodynamics and enrichment of the inter-galactic medium (IGM).
The vast range of spatial scales involved is only one of the difficulties encountered in attempting to study feedback. Another is the broad range of complicated gas-phase physics – (magneto)hydrodynamic effects such as shocks and turbulence, thermal conduction, and non-ionization equilibrium emission processes. A final complication is that much of the energy and metal-enriched material involved is in the hard-to-observe coronal ( K) and hot ( K) gas phases.
2. X-ray emission mechanisms and the micro-physics of superwinds
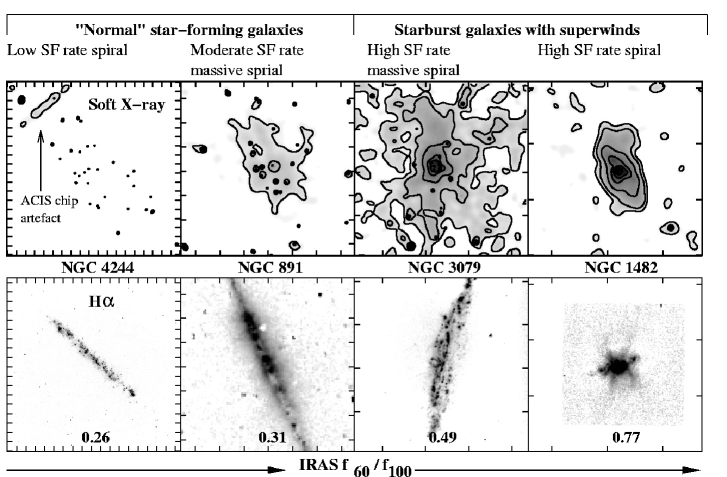
Local starburst galaxies show unambiguous evidence for multi-phase, km/s, bipolar outflows, characterized by kpc-scale extra-planar soft thermal X-ray, optical recombination and non-thermal radio emission (see Heckman, Armus & Miley 1990). These superwinds are driven by the pressure of the thermalized ejecta from the large numbers of core-collapse supernovae resulting for the starburst event. Superwinds, as perhaps the most-extreme, and least subtle, form of feedback are an ideal place to explore and test our understanding of the many physical processes encompassed within the subject. The relationship between superwinds and the extra-planar diffuse ionized gas or eDIG (Rand 1998; Dettmar 1993) in normal spiral galaxies, where kinematic evidence for outflow is lacking, is currently unclear.
A quantitative assessment of the energetics, mass and composition of superwinds, and possibly galactic fountains in non-starburst galaxies, depends on understanding the physical origin of the thermal X-ray emission in winds. Prior to Chandra, the poor spatial resolution of X-ray telescopes made it impossible to determine if the X-ray emission came directly from the (possibly mass-loaded, see below) volume-filling wind of SN ejecta (Suchkov et al. 1996), or merely from low-filling factor ambient disk or halo gas over-run by the wind (Suchkov et al. 1994; Strickland & Stevens 2000). Low spatial resolution also complicated X-ray spectral analysis, due contamination by unresolved point sources and the blending together of physically distinct regions (Weaver, Heckman & Dahlem 2000).
2.1. Spatially-correlated X-ray/H emission
Within the central kiloparsec of NGC 253, NGC 4945, NGC 3079 (see Fig. 2) and M82 (Strickland et al 2000; Strickland 2001; Schurch, Roberts & Warwick 2002; Strickland et al. 2002b) Chandra observations demonstrate the thermal X-ray emission matches up almost exactly to the filamentary, limb-brightened H emission. This proves that the X-ray emission arises in some form of interaction between the currently-invisible wind and the denser, cooler, ambient ISM responsible for the H emission.
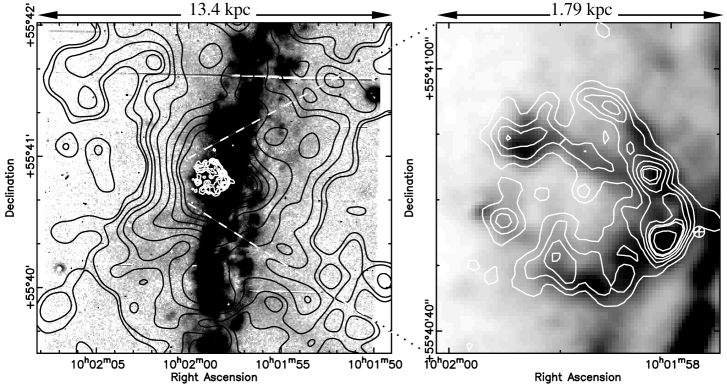
On larger, kpc scales, we have also convincing evidence that the X-ray emission is associated with H emission. The close association between halo X-ray and H emission has been know about in M82 for many years (see Dahlem, Weaver & Heckman 1998, and references therein), but we have also found X-ray emission associated with faint H filaments in the halos of NGC 253 (Strickland et al. 2002a), NGC 3628 (Strickland 2001) and NGC 3079. Any physical model for superwinds, in particular numerical models of outflows, must explain and reproduce this X-ray/H spatial correlation. Strickland et al. (2002a) discuss a variety of models that satisfy this criterion. On such model is that the H emission arises in a radiative shock driven into a several kpc-scale-height thick disk or halo medium, the X-ray emission coming from a reverse shock driven into the superwind. The semi-exponential surface brightness, and isothermal nature, of the minor axis X-ray emission we observe in many superwinds (see Fig. 3) is consistent with this model.

2.2. Shocks and the superwind X-ray/H flux ratio
Not only is there a strong similarity in morphology between the soft X-ray and optical H emission in superwinds, but the X-ray-to-H flux ratio always appears to between within a factor of unity throughout any superwind. Strickland et al. (2002a) discusses this with respect to NGC 253, the northern “cap” in M82 (Lehnert, Heckman & Weaver 1999) and Arp 220. We have, as reported at several prior conferences, also found in NGC 3079’s nuclear bubble, and generally throughout the NGC 1482 and M82 winds. Note that as the extinction , spatial variations in the extinction over the superwind do not alter significantly.
This result, in particular that that it appears to be a general rule over a variety of spatial-scales in many, possibly all, superwinds, is very significant. It can be used constrain the physical mechanisms responsible for the soft X-ray (and to a certain extent, the optical) emission in superwinds. For example, we can rule out a model where the tenuous superwind passes through a fully-radiative internal high-velocity shock, compressing and heating it to X-ray-emitting temperatures, followed by downstream cooling to K and H emission. In such a model only for – 300 km/s (see Fig. 4), but this predicts X-ray temperatures keV, well below the broad temperature range observed of – 0.7 keV. The predicted ratio of O vii to O viii emission is also an order of magnitude greater than that observed (see Strickland et al. 2002a). Other shock-related models (e.g. Lehnert et al. 1999) are quantitatively more successful (Strickland et al. 2002c).

2.3. X-ray-emission from mass-loaded winds revisited
One of the original aims of our Chandra observations of local superwinds was to see if we could spatially separate the volume-filling wind fluid from X-ray emission due to wind/ISM interactions. Only in the central few hundred parsecs might the wind fluid be bright enough to detect, necessitating arcsecond spatial resolution X-ray spectral-imaging.
In NGC 253, the closest bright starburst, we placed an upper limit of 20% of the X-ray emission coming from any volume-filling component (Strickland et al 2000), the overwhelming majority of the observed emission coming from a spectrally-uniform limb-brightened conical structure. Recently, Pietsch et al (2001) and Schurch et al. (2002) claim that the degree of limb-brightening in NGC 253 and NGC 4945 decreases at lower X-ray energies. Unfortunately these authors did not quantify the effect, but they interpret this as due to the increasing importance of emission from a “mass-loaded” wind111Mass-loaded is used here in the sense employed by Suchkov et al. (1996), where the X-ray emission from a superwind was modelled as coming from a volume-filling fluid, the density of which had been increased by uniformly mixing in material from the ISM the wind had over-run. component at lower X-ray energies.
We briefly mention another plausible interpretation for this observed effect, which we defend quantitatively in Strickland et al. (2002d). The column density of material is largest when looking at the limb of these outflow cones. Optical and FIR observations (e.g. Phillips 1993; Radovich, Kahanpää & Lemke (2001)) show that the dense filamentary material in the walls of superwinds contains significant amounts of neutral gas and dust. Soft X-rays coming from the limbs of the outflow cones will thus suffer more absorption than those coming from the front and rear walls. At higher X-ray energies this differential absorption is reduced, the net effect being to reduce the apparent degree of limb-brightening at lower X-ray energies without mass-loading.
3. Gas in the coronal phase and O vi
Radiative energies losses, in any realistic multi-phase model for the ISM, are dominated by gas at temperatures between and K, even if the majority of the energy is stored in hotter gas. A particularly powerful probe of gas in this “coronal” phase is the O vi doublet at and . Approximately 20% of the total cooling at K (in a Solar abundance plasma) is due to this doublet alone. With the high sensitivity and spectral resolution of FUSE, we can, for the first time, probe superwind kinematics in the hot phases, and directly see metals in outflow.
3.1. Ovi in absorption
In the proto-typical starbursting dwarf galaxy NGC 1705, FUSE observations (Heckman et al 2000) show that the coronal phase gas is flowing out of the galaxy at higher velocity than the warm ionized gas at K, which in turn are flowing outwards at higher velocity than the warm neutral medium. That the hot phases can have higher outflow velocities is of great physical significance, as it supports theoretical claims that the hot, metal-enriched, phases can be preferentially ejected into the IGM.
Heckman et al. (2002) demonstrate that the O vi column density, in a radiatively cooling plasma, is largely independent of the number density and metallicity of the gas, and depends only on a characteristic velocity in the cooling gas. Distinct physical processes, such as thermally-unstable collapsing gas clouds, gas in radiative shocks, turbulent mixing layers and conductive interfaces all produce the essentially the same O vi column density! This results applies in general to many high-ionization lines, and complicates the use of the column densities alone as a diagnostic tool. For example the presence and column densities of high ionization species in wind-blown bubbles (Boroson et al. 1997) do not provide unambiguous evidence for presence and action of conductive interfaces.
3.2. Ovi in emission
Emission lines from coronal phase gas can be used to place strong constraints on various physical models for the X-ray & optical emission from superwinds. For example, the km/s radiative shock model (Fig. 4) predicts an O vi line luminosity approximately an order of magnitude more luminous than the total soft X-ray emission, or the optical H emission.
The application of such diagnostics to superwinds has only just become possible with the launch of FUSE. We (PI: Hoopes) have begun a program looking for O vi emission at various locations in M82 and NGC 253’s winds, where we know the optical and X-ray properties from our existing data.
4. Summary
In the three years since their launch in mid-1999, the un-matched capabilities of both Chandra and FUSE, have allowed subtantial progress to be made in understanding the physics of the feedback in star-forming galaxies. Old questions have been answered, and new ones have arisen. With several, no-doubt productive, years left for each instrument, it is likely that progress will continue to be rapid in understanding the relationship between massive stars and the warm and hot phases of the ISM and IGM.
Acknowledgments.
We would like to thank S. Hameed for the use of his H image of NGC 1482. DKS is supported by NASA through Chandra Postdoctoral Fellowship Award Number PF0-10012, issued by the Chandra X-ray Observatory Center.
References
Boroson, B., McCray, R., Oelfke Clark, C., Slavin, J., Mac Low, M.-M., Chu, Y.-H., van Buren, D. 1997, ApJ, 478, 638
Dahlem, M, Weaver, K.A., Heckman, T.M. 1998, ApJS, 118, 401
Dettmar, R.J. 1993, Rev. Modern Astron., 6, 33
Dopita, M.A., Sutherland, R.S. 1996, ApJS, 102, 161
Heckman, T.M., Armus, L., & Miley, G.K. 1990, ApJS, 74, 833
Heckman, T.M., Norman, C.A., Strickland, D.K., Sembach, K.R. 2002, ApJ, in press
Heckman, T.M., Sembach, K.R., Meurer, G.R., Strickland, D.K., Martin, C.L., Calzetti, D., Leitherer, C. 2001, ApJ, 554, 1021
Lehnert, M.D., Heckman, T.M. 1996, ApJ, 462, 651
Lehnert, M.D., Heckman, T.M., Weaver, K.A. 1999, ApJ, 523, 575
Phillips, A.C., 1993, AJ, 105, 486
Pietsch, W., et al. 2001, A&A, 365, L174
Radovich, M., Kahanpää, J., Lemke, D., 2001, A&A, 377, 73
Rand, R.J. 1998, PASA, 15, 106
Schurch, N.J., Roberts, T.P., Warwick, R.S. 2002, MNRAS, in press (astro-ph/0204361)
Strickland, D.K., Heckman, T.M., Weaver, K.A., Dahlem, M. 2000, AJ, 120, 2965
Strickland, D.K., Heckman, T.M., Weaver, K.A., Hoopes, C.G., Dahlem, M. 2002a, ApJ, 568, 689
Strickland, D.K., Heckman, T.M., Colbert, E.J.M., Hoopes, C.G., Weaver, K.A. 2002b, ApJ submitted
———. 2002c, in preparation
———. 2002d, in preparation
Strickland, D.K., Stevens, I.R. 2000, MNRAS, 314, 511
Suchkov A. A., Berman V. G., Heckman T. M., Balsara D. S. 1996, ApJ, 463, 528
Suchkov A. A., Balsara D. S., Heckman T. M., Leitherer C. 1994, ApJ, 430, 511
Weaver, K.A., Heckman, T.M., Dahlem, M. 2000, ApJ, 534, 684