The high-energy gamma-ray fluence and energy spectrum of GRB 970417a from observations with Milagrito
Abstract
Evidence of TeV emission from GRB970417a has been previously reported using data from the Milagrito detector Atkins et al. 2000b . Constraints on the TeV fluence and the energy spectrum are now derived using additional data from a scaler system that recorded the rate of signals from the Milagrito photomultipliers. This analysis shows that if emission from GRB970417a has been observed, it must contain photons with energies above 650 GeV. Some consequences of this observation are discussed.
Subject headings: gamma rays – bursts, observations
1 Introduction
Some of the most important contributions to our understanding of gamma-ray bursts (GRBs) have come from observations of afterglows over a wide spectral range. Comparisons between these observations and predictions of GRB afterglow properties both as a function of time and of wavelength have provided stringent tests of GRB models van Paradijs, Kouveliotou & Wijers (2000). However, far less is known about the multiwavelength spectrum during the prompt phase of GRBs because of its very short duration.
Almost all GRBs have been detected in the energy range between 20 keV and 1 MeV Fishman (1995). A few have been observed above 100 MeV by EGRET Schneid et al. (1992); Sommer et al. (1994); Hurley et al. (1994); Schneid et al. (1995) indicating that at least some GRB spectra extend up to hundreds of MeV. However, the upper extent of GRB energy spectra is unknown. There may be a second (higher energy) component of emission, similar to that seen in several TeV sources Dermer, Chiang & Mitman (1999); Pilla & Loeb (1998).
The Milagro gamma-ray observatory, which began full operations in January 2000, is a wide field-of-view instrument that operates with a duty cycle near 100 %. It is particularly well suited to extending observations of the prompt phase of GRBs up to TeV energies. A prototype of Milagro, Milagrito Atkins et al. 2000a , found evidence for TeV emission from one of the 54 gamma-ray bursts observed by BATSE that were within the Milagrito field of view with a probability of of being a background fluctuation Atkins et al. 2000b . An excess of events was observed from the direction of GRB 970417a during the time BATSE observed emission. In this paper, we use additional data from Milagrito to examine the fluence and spectrum of the possible high-energy emission of GRB970417a.
Milagrito detected secondary particles reaching the ground produced by the interaction of TeV gamma rays in the atmosphere. The Milagrito detector consisted of a single layer of 228 photomultiplier tubes (PMT) placed on a 2.8 m 2.8 m grid approximately 1 meter below the surface of a large covered pond of water Atkins et al. 2000a . An air shower was registered when relativistic charged particles, radiating Cherenkov light in the water, caused 100 PMTs to detect light within a 200-ns time interval. The direction of the gamma ray initiating the shower was reconstructed from the relative timing of the PMT signals.
It is very difficult to obtain information on the energy of the individual events contributing to the TeV gamma-ray excess observed with Milagrito. While the observed number of shower particles is related to the energy of the primary gamma-ray, it also depends on the height in the atmosphere of the first interaction and on the distance of the shower core from the pond. The area of Milagrito was small relative to the lateral extent of a typical shower, so it is usually not possible to determine the location of the core. Consequently, the number of PMTs hit in the pond is only weakly related to the energy of the gamma-ray primary. Also, the trigger required 100 of the 228 PMTs to register a signal, so there is very little dynamic range over which to identify a variation due to different source spectra.
Instead, information about the distribution of the gamma-ray energies can be obtained using additional information about the summed count rates of the individual PMTs in the pond. Very-high-energy (VHE) gamma rays of too low an energy to trigger the detector can give rise to an increase in these rates. Measurement of the rates therefore allows constraints to be placed on the spectrum of the putative TeV gamma-ray flux observed from GRB970417a.
2 Observations with the Triggered Milagrito Data
The angular resolution of Milagrito was substantially better than that of BATSE. Thus it was decided a priori to perform a search for a TeV excess everywhere within the area of the BATSE 90% positional uncertainty (statistical+systematic) Briggs et al. (1999) for the T90 period reported by BATSE ( s for GRB970417a). The search area from BATSE was tiled with an overlapping array of 1.6∘ radius circular bins (appropriate for the angular resolution of Milagrito) centered on points on a grid. The Poisson probability that the observed number of events was a fluctuation of the background was calculated for each bin. The bin with lowest probability of being a background fluctuation for GRB970417a contains 18 events. In the null hypothesis (in which we assume there is no signal), the best estimate of the background is events. The Poisson probability of observing 18 events in a given bin with the background level of 3.46 is . After accounting for the oversampling in this method, the chance probability of such an observation anywhere within the search region for GRB970417a is Atkins et al. 2000b . Since 54 gamma-ray bursts were examined for VHE emission, the probability that this excess was a chance coincidence was 1.5.
If we assume that the observation of GRB970417a is due to signal plus background events, then the best estimate of the background level in the signal region is different from that obtained assuming the null hypothesis. This is because the search method will tend to select the bin with an upward fluctuation of the background in addition to the signal. A Monte Carlo simulation was performed to find the average number of signal events that results in an excess of 18 events in the most significant bin, given a mean background level of 3.46. The result is that the average number of signal events in the most significant bin is in this case: the remaining 4.7 events are background.
3 Observations using the Milagrito Scaler System
The Milagrito scaler system recorded the PMT counting rates once per second for two brightness thresholds. Low threshold, which is the rate at which the PMTs detected 0.25 photoelectrons or more, and high threshold, which is the rate at which the PMTs detected 5 or more photoelectrons. Here we discuss the results from the scalers recording the PMT rates above the low-discriminator threshold (about 0.25 photoelectrons). The PMT signals were processed in groups of 16 by the electronics Atkins et al. 2000a . Each of the 16 PMTs in a group was connected to one of four scalers. The connections were arranged so that no pair of nearest or diagonal neighbor PMTs were connected to the same scaler. Each of these scaler outputs was a logical OR of the signals from four PMTs. Consequently, if two or more PMTs connected to the same scaler were hit within about 30 ns of each other, only one output count was generated.
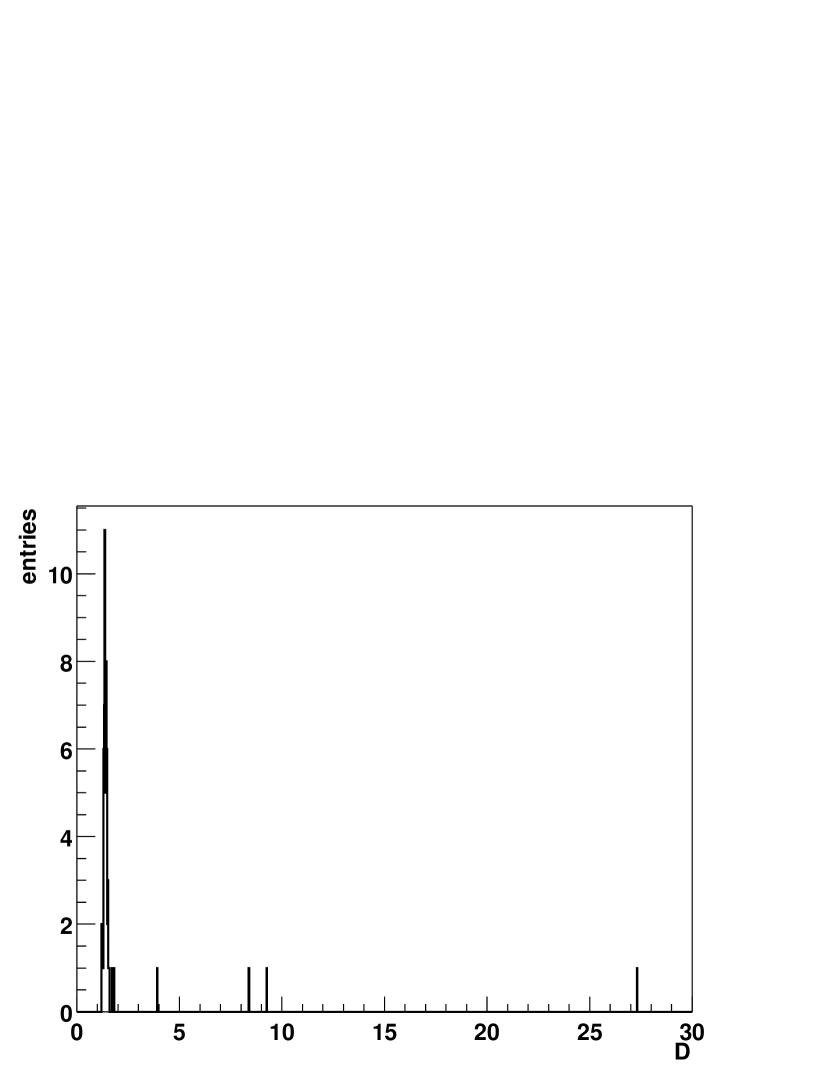
The analysis of the scaler data involves a search for a significant increase in the PMT scaler rates at the time of GRB970417a. Noisy channels were eliminated from the analysis to improve the sensitivity of the PMT singles-rate analysis. There were a few PMTs that were noisy and several PMTs that had large rate variations due to pinhole light leaks in the pond cover. GRB970417a occurred 82 minutes after sunrise at the Milagro site, so that light leaks cannot be ignored. Noisy PMTs were identified by examining the rms fluctuations in the count rates of each scaler channel. Figure 1 shows the distribution of for the 60 scaler channels, for an hour-long period centered on the burst trigger time. for channels in which the scaler counts follow a Poisson distribution, while noisy channels will have 1. The four channels with 2 were excluded from further analysis. The remaining channels have , somewhat larger than is expected for Poisson statistics.
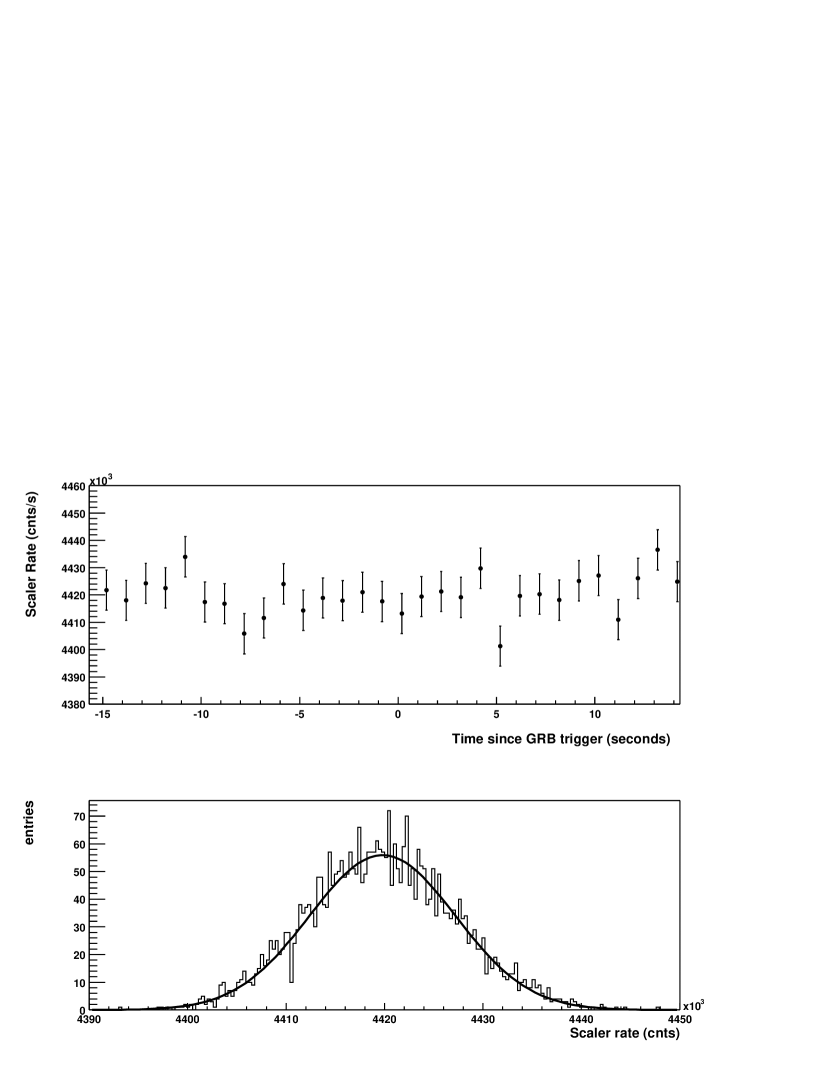
The 56 scaler channels without excessive noise were added together to give the summed scaler rate as a function of time. Figure 2 shows the summed scaler rate for the 30-second interval centered on the start time of GRB970417a and the distribution of values of the summed scaler rate for 60 minutes around the time of the burst. No increase in the summed scaler rate is apparent at the time of GRB970417a.
We wish to look for an excess in the summed scaler rate during T90, as this was the interval over which the triggered excess was observed in Milagrito. The BATSE trigger time for GRB970417a was 50016.71 s on MJD 50555: the start of the T90 interval was offset by -1.024 s from the trigger time, and the duration of T90 was s. It is necessary to examine a 9-second time bin to fully contain the T90 interval as the scaler data were recorded once per second. Figure 3 shows the summed scaler data for 9-second intervals.
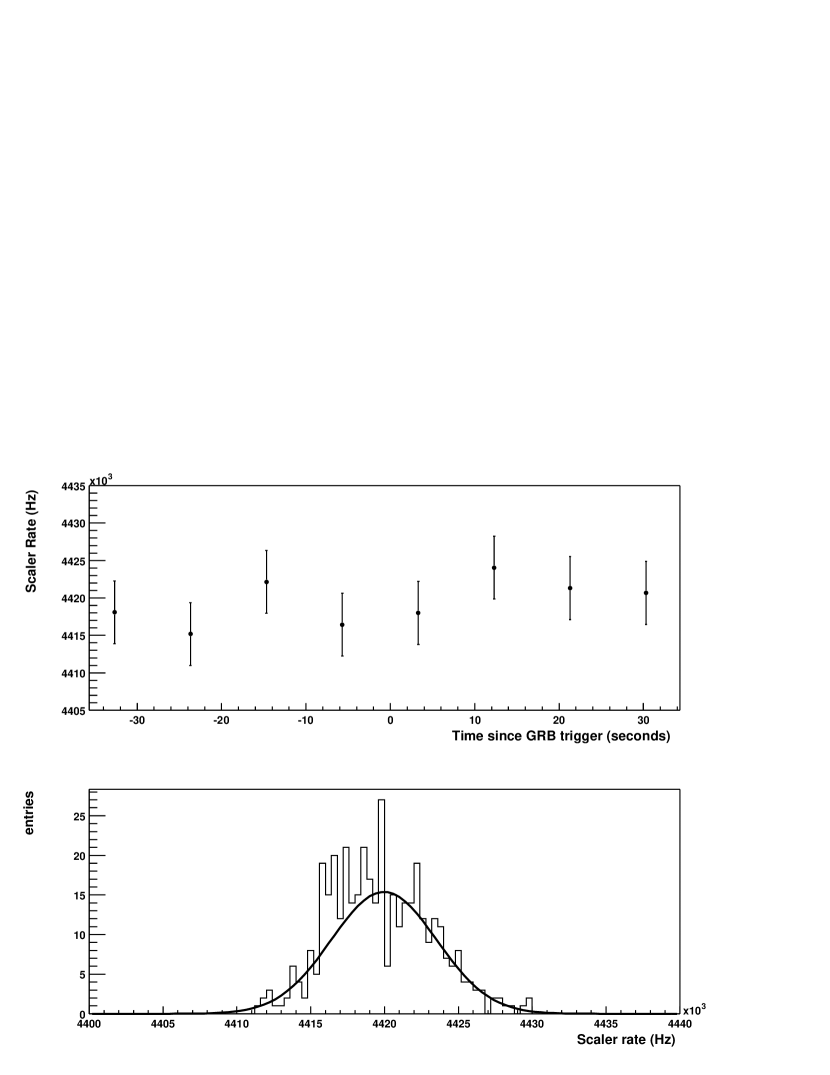
The summed scaler rate during the 9 seconds that contained the burst was 4.418 MHz, which is 0.5 standard deviations below the mean of 4.420 MHz. Thus there is no evidence for an increase in the summed scaler rate during T90 of GRB970417a. The 99.9% confidence level upper limit on the number of excess summed scaler counts due to gamma rays during T90 of GRB970417a has been calculated using the method described in Helene (1988), assuming that the distribution of summed scaler rates due to background is a Gaussian with the mean and standard deviation shown in Figure 3. This background distribution is significantly broader than expected from Poisson statistics due to correlations between hits. Monte Carlo studies show that this distribution is expected to be broadened due to correlations between the scaler channels as several PMTs can detect light from a single shower particle. This distribution also incorporates systematic fluctuations at a 9 second time scale. Using the above distribution to calculate the upper limit, these effects are taken into account. The result is that fewer than 67000 excess counts from the scalers were detected over T90 of the burst. This quantity is defined as (scaler).
4 Sensitivity of the Milagrito Detector
The scalers could register counts from showers that were too low in energy to trigger 100 PMTs in Milagrito. Thus the observation of an excess in the triggered data but not in the summed scaler rate would imply that the observed excess is not due solely to a large flux of low-energy gamma rays. A simulation of the energy-dependent response of the Milagrito trigger and of the summed scaler rate is needed to quantify the constraints on the gamma-ray flux. The simulation reflected the instrumental conditions at the time of the burst, including the fact that 9 PMTs were not operational at that time. The four noisy scaler channels were also discarded in the simulation of the scalers. For simulations of the triggered Milagrito data (summed scaler rate), showers were thrown at discrete energies from 50 (10) GeV to 50 TeV at zenith angles from 20-25 degrees. GRB970417a was at a zenith angle of 22 degrees for Milagrito.
If simulated showers are thrown with cores uniformly distributed over a sufficiently large area, , so that there is only a negligible probability of showers outside that area triggering the detector, then the effective area, , is given by:
| (1) |
where is the number of simulated events that would trigger the detector. Similarly an effective area for the summed scalers is defined by:
| (2) |
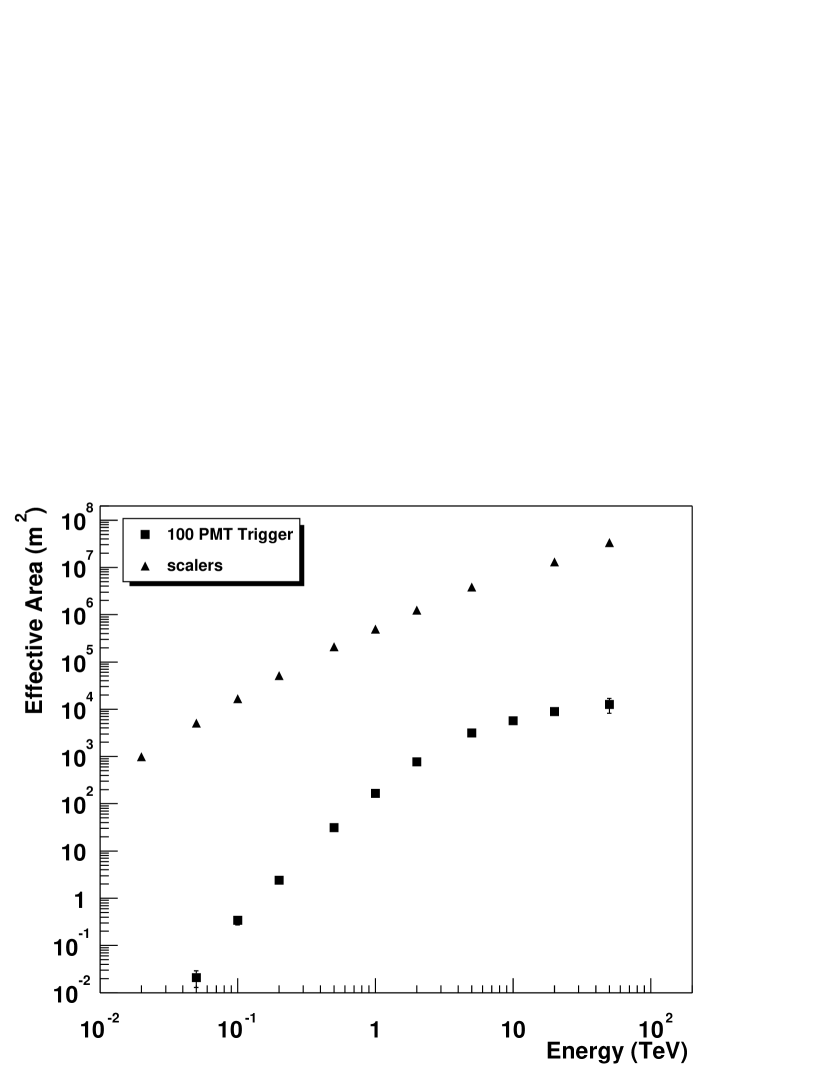
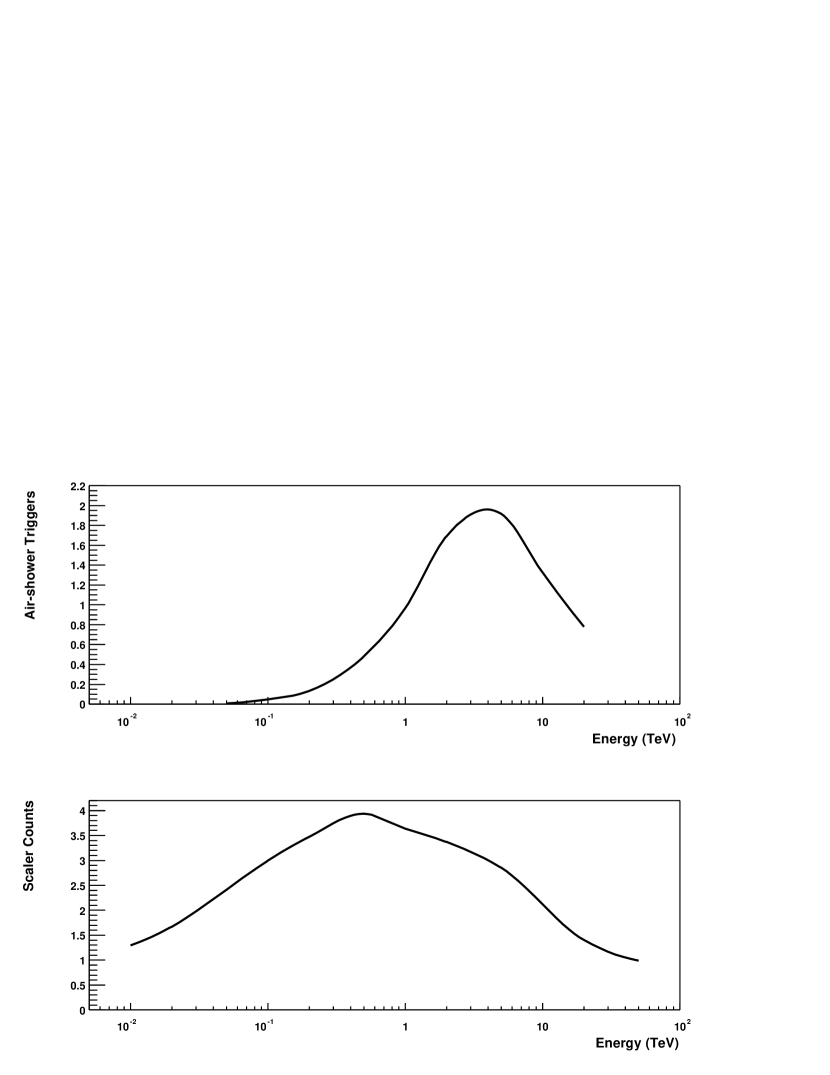
where is the number of simulated scaler counts that would be recorded by the detector. Note that more than one scaler count can result from a single shower. Table 1 and Figure 4 give the effective areas for triggers and scalers as functions of incident gamma-ray energy. Each simulated shower was used only once in deriving the effective areas.
| Energy (GeV) | (m2) | (m2) |
| 10 | - | |
| 20 | - | |
| 50 | ||
| 100 | ||
| 200 | ||
| 500 | ||
| 1000 | ||
| 2000 | ||
| 5000 | ||
| 10000 | ||
| 20000 | ||
| 50000 |
.
If the effective area is convolved with a test input spectrum, the result is the expected distribution of gamma-ray energies for events detected by Milagrito for that spectrum. Figure 5 shows this distribution for triggers (top) and the summed scalers (bottom) assuming an input gamma-ray spectrum with a differential power law index of -2.4 and no upper energy cutoff. The scaler response extends to considerably lower energies, so that the contribution of the scalers becomes enhanced relative to the triggered data as one introduces and reduces an upper energy cutoff.
5 Constraints on photon energies and the fluence from GRB970417a
The true spectrum of the gamma rays responsible for the observed excess from GRB970417a at TeV energies is unknown. However, constraints can be derived by requiring the photon energy spectrum and fluence to be consistent with the Milagrito observations. In particular, the spectrum convolved with the Milagrito response functions should reproduce the observed excess in the triggered data while not exceeding the upper limit, , obtained in the scaler analysis.
5.1 Monoenergetic Spectrum
It is instructive to first consider the case of a monoenergetic gamma-ray spectrum. The number of triggered events produced by a monoenergetic flux, , in a burst lasting T seconds is given by:
| (3) |
where is the trigger effective area for incident gamma rays with energy .
Similarly, the number of summed scaler counts produced by the flux is given by:
| (4) |
It is common practice to describe the output of a GRB by its fluence, which is the integral of the flux over energy and time: thus the fluence for a steady monoenergetic flux at an energy is simply .
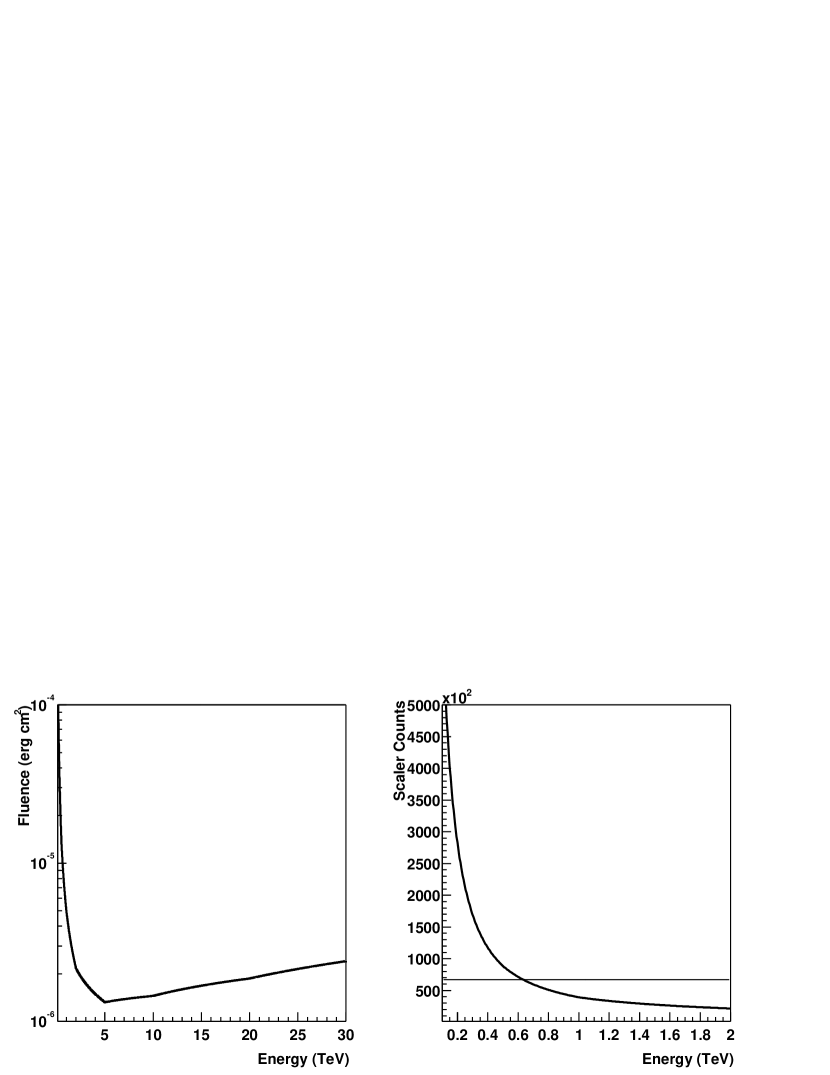
Figure 6 shows the fluence implied by the triggered-event excess observed in Milagrito assuming a monoenergetic spectrum for different energy gamma-rays. The fluence has a minimum of ergs/cm2 for a monoenergetic flux at 5 TeV. This is the minimum fluence that could be responsible for the triggered-event excess observed in Milagrito regardless of spectral shape. Also shown in Figure 6 is the expected number of excess summed scaler counts as a function of energy for a monoenergetic spectrum with the fluence necessary to produce the observed triggered-event excess. The horizontal line show (scaler)67000, the 99.9% upper limit on the summed scaler excess derived above. Because the summed scaler excess must be less than (scaler), GRB970417a cannot have a monoenergetic flux with any energy below 650 GeV. The Milagrito observation cannot be due solely to gamma rays with energies below 650 GeV regardless of spectral shape.
5.2 Truncated power law Spectrum
In reality GRBs probably have an upper energy cutoff due to the intrinsic radiation emission mechanism at the source Baring & Harding (1997); Lithwick & Sari (2001), attenuation via pair production with intergalactic photon fields Primack, Bullock, Somerville & MacMinn (1999); Salamon & Stecker (1998), or both. As an example of how the analysis of the Milagrito result can be applied to a more realistic spectral shape, we assume that the photon spectrum is a truncated power law:
| (5) |
| (6) |
where N is the number of photons at energy E, is the spectral index, and c is a normalization factor. The number of events detected by Milagrito for this spectrum is given by:
| (7) |
Inserting the Milagrito effective area for the summed scalers (triggered data) in this equation results in the predicted number of excess summed scaler counts (triggered events). Since 13.3 excess triggered events were observed, any combination of , and can be used in equation (7) to find c (the normalization constant) as a function of and ), and thus the number of predicted summed scaler counts.
We take so that the contribution to the observed Milagrito triggered event excess from the portion of the spectrum below this energy is negligible. We then allow and to vary and search for combinations of and that satisfy the requirement that the predicted number of summed scaler counts be less than (scaler). (Strictly speaking there is contribution to the summed scaler counts from events below 50 GeV, but this is small for the cases discussed below).
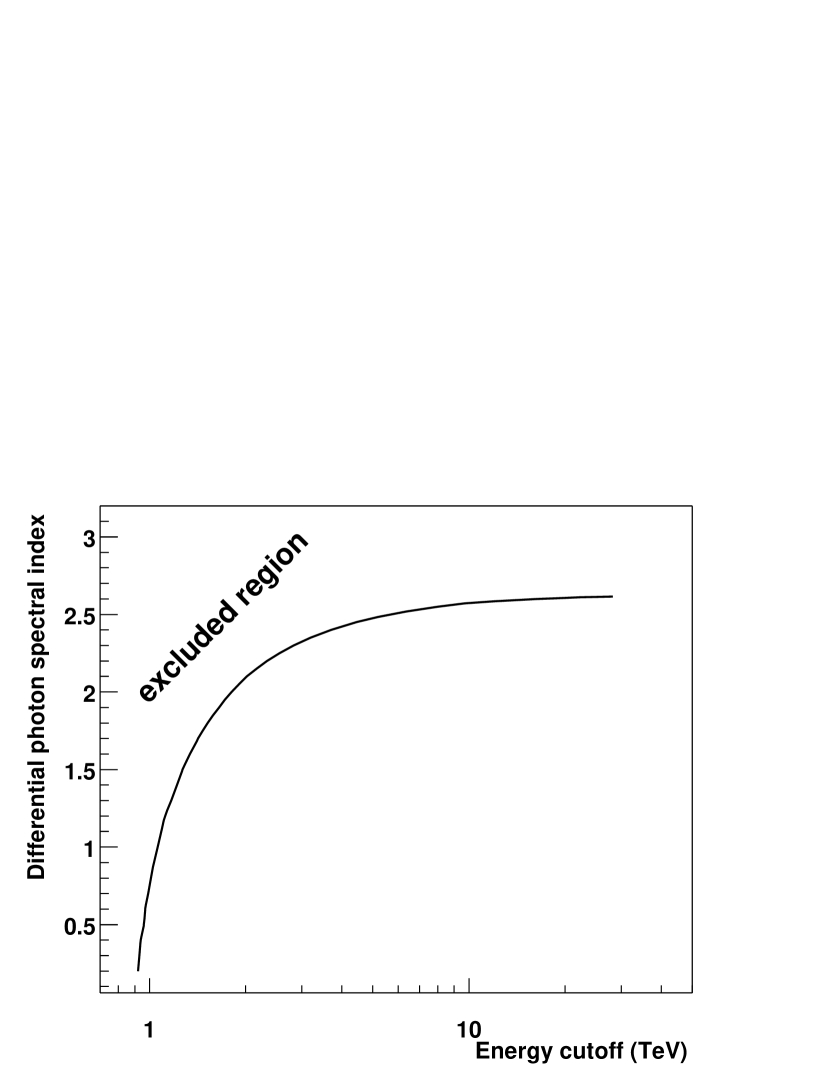
Figure 7 shows the combinations of spectral index and maximum energy that satisfy the condition that the number of summed scaler counts equals . Regions above and to the left of this curve (lower energy cutoff or softer spectra) result in a summed scaler excess greater than 67000, and are thus inconsistent with the Milagrito observations. This plot shows that for a differential photon spectrum (a very hard spectrum), the spectrum must extend up to at least 1 TeV to be consistent with the Milagrito observations. For a spectral index of -2.4, more typical of what is observed from other VHE sources, the spectrum must extend to at least 5 TeV. Note that photon energies from GRB970417a must extend to higher energies for a truncated power-law spectrum than for a monoenergetic spectrum.
The results obtained here incorporate the effects of statistical and systematic fluctuations in the scaler rate. However, there may also systematic uncertainties in the calculation of the detector response. Previous studies have shown that the Monte Carlo simulation of the Milagrito detector correctly predicts the trigger rate from cosmic-ray protons, helium and CNO Atkins et al. (1999). This implies that the Milagrito effective area for cosmic rays is correctly modeled to within , and that the energy scale of the response of Milagrito agrees with the simulation to within . There may also be systematic errors associated with simulating shower proipagation, which could cause an additional small uncertainty for the flux from GRB970417a due to the triggering efficiency of cosmic-rays relative to gamma-rays. The simulation of the scaler response is subject to many of the same systematic errors as the triggered response of Milagrito. However, there are additional systematic uncertainties in the modeling of the scaler data since they are more sensitive to fluctuations in the tails of the air-shower distributions. It is difficult to quantify these additional systematic uncertainties, but we note that seasonal fluctuations of around 15% are observed in the scaler rates (but not the trigger rate). These seasonal fluctuations in the scaler rates are probably due to changes in the vertical density profile of the atmosphere. Overall we estimate the systematic uncertainty in the constraints on maximum energy to be around 35%.
6 Comparison with other observations of GRB970417a
GRB970417a was a weak, soft GRB as observed by BATSE. The fluence in the 50–300 keV range was ergs/cm2. The low fluence implies that spectral fits to these data are poorly constrained. A fit to a broken power law Band et al. (1993) yields a relatively low break-energy of keV, with an undefined low energy spectral index and a soft power law above the break with a spectral index of Connaughton (1999). A power law with no break fits the BATSE data equally well with a spectral index of Kaneko (2000). In what follows, we use this spectral form for this burst, since the need for fewer parameters results in a more tightly constrained fit.
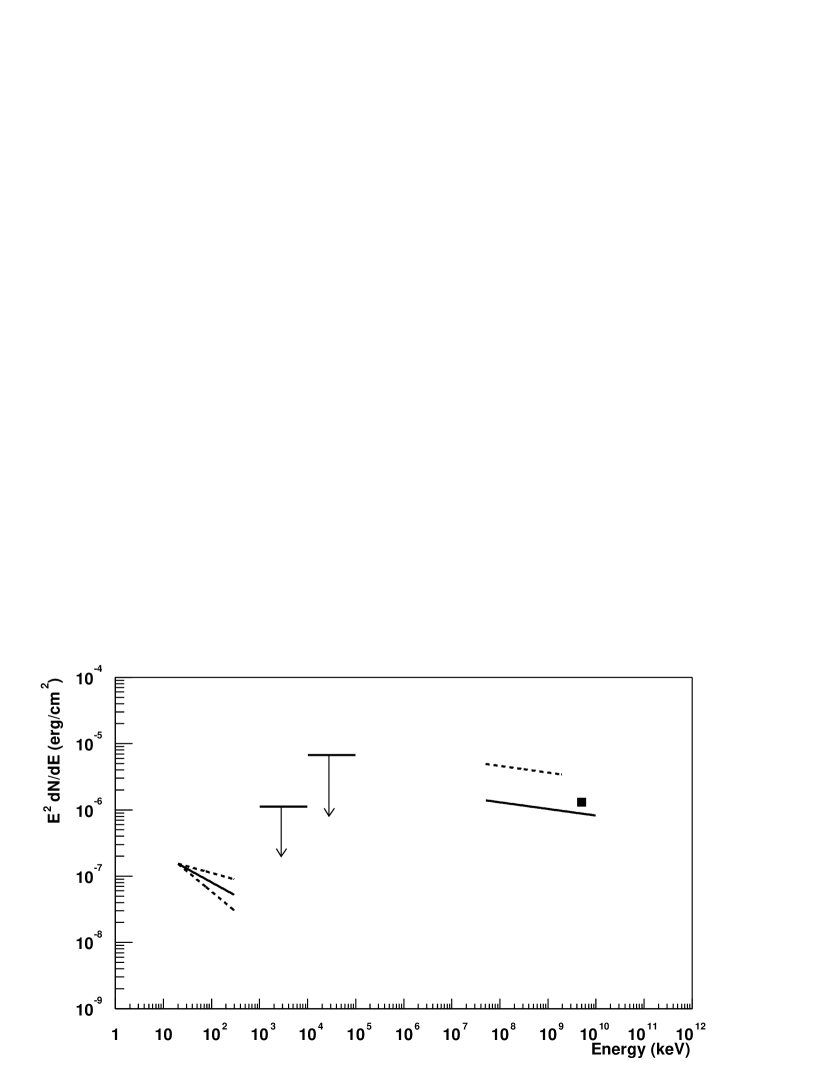
We have calculated upper limits for the fluence in the ranges 1–10 MeV and 10–100 MeV using data from the EGRET Total Absorption Scintillation Counter (TASC) detector. Figure 8 shows the spectral energy distribution for GRB970417a, including the fit BATSE spectrum, the upper limits from the EGRET TASC detector, and the VHE flux implied by the Milagrito observations assuming 3 possible spectral forms:
1) The square symbol assumes a monoenergetic flux at 5 TeV: this is the lowest VHE fluence compatible with the Milagrito observations.
2) The lower (solid) line assumes a power law spectrum with differential photon index of -2.1.
3) The upper (dashed) line assumes a power-law spectrum with differential photon index of -2.1 and a sharp cutoff at 2 TeV.
7 Discussion
As shown above, if the excess triggered events observed by Milagrito were indeed associated with GRB970417a, then they must be due to photons of at least 650 GeV, the highest energy photons detected from a GRB. Figure 8 shows that the VHE fluence must be at least an order of magnitude greater than the sub-MeV fluence measured by BATSE. In the following, assuming that high-energy emission from GRB970417a was detected by Milagrito, this section explores some of the consequences of the observation.
The Milagrito observations at VHE energies are not consistent with a straightforward extrapolation of the spectrum measured by BATSE, so they would be the first evidence for the existence of a second (higher energy) emission component in a gamma-ray burst. We note that while the implied fluence at VHE energies is considerably larger than that measured by BATSE, the actual peak of the spectral energy distribution may lie below the energy range measured by BATSE. Thus, while it appears that the power in the high energy component is greater than that in the low energy component, this need not necessarily be the case since a low energy peak was not measured. However, this would be a very unusual GRB spectrum, as peak energies are typically between 100 keV and 1 MeV Preece et al. (2000).
The existence of a higher energy component of emission is predicted by many emission models. For models in which the sub-MeV emission is due to non-thermal emission from a population of relativistic electrons, a fraction of these photons can be upscattered to the GeV-TeV range via inverse Compton scattering Meszaros & Rees (1993); Chiang & Dermer (1999); Pilla & Loeb (1998). The emergence of this component is expected to be prompt and coincident with the synchrotron radiation seen in the keV-MeV range. Protons may also be accelerated to very high energies: GeV-TeV gamma rays can be produced by synchrotron radiation from these protons, or from decaying pions produced by high energy protons interacting with photons Boettcher & Dermer (1998).
The possible VHE detection of GRB 970417a has significant implications on the distance scale and energy production in the GRB. VHE gamma rays interact with lower-energy photons to produce electron-positron pairs Gould & Schreder (1966); Jelley (1966); Primack, Bullock, Somerville & MacMinn (1999); Salamon & Stecker (1998). Thus gamma rays from distant sources may suffer significant attenuation on the intergalactic background radiation fields as they traverse the Universe en route to Earth. There is an energy dependent horizon beyond which gamma rays cannot be detected. The magnitude of this effect is a function of gamma-ray energy, the density and spectrum of the background radiation fields, and the distance to the source. The observation of photons with energies of at least 650 GeV coupled with an estimate of the opacity for VHE photons would constrain the redshift of GRB 970417a. The results of Primack et al (1999) imply that the opacity of the Universe to 650 GeV photons is one at a redshift of 0.1. While it is possible that GRB 970417a may lie beyond this, it would then require an enormous source flux of VHE photons to produce the excess observed by Milagrito.
If the redshift of GRB970417a is less than 0.1, then with the exception of GRB980425 it is much closer than all of the GRBs with measured redshifts. However only long, bright bursts have been localized sufficiently well to allow the measurement of afterglows, so the sample of GRBs with measured redshifts may not be representative of the entire class of GRBs. While GRB970147a was a long burst, it was also dim and would not have been localized by past or current detectors.
There have been several attempts to extend information on the GRB redshift distribution to bursts without measured redshifts. Several authors have investigated the gamma-ray properties of bursts with known redshifts (and thus luminosities) to find observable gamma-ray parameters that may be indicators of the luminosity. The spectral evolution of pulse structures appears to be anticorrelated with peak luminosity (i.e. bursts with a long lag between low-energy and high-energy detection by BATSE are dimmer) Norris (2000) and bursts with a greater degree of variability appear to be more distant Fenimore (2001). Although GRB970417a was too dim at sub-MeV energies to allow the calculation of the variability parameter to be used as a luminosity indicator, it was included in a recent study of the lag-luminosity relation Norris (2002). However, because GRB970417a was both dim and of relatively short duration, the large uncertainty in the measured lag precludes obtaining a reliable estimate of its luminosity Norris 2002a . Other distance indicators are obtained from the global properties of GRBs due to deviations from Euclidean geometry for sources at cosmological distances. For example, Schmidt (2001) shows that GRBs with harder MeV spectra are more distant than those with soft spectra, and in fact the spectrum of GRB970417a, as measured by BATSE, is soft.
In addition to suffering attenuation via pair production in intergalactic space, VHE photons may also be absorbed in the source itself. The very rapid variability (small emission region) and high luminosity of GRBs implies a very large photon density. If the source is non-relativistic, the optical depth of high-energy photons is so large that the photons could not emerge. If the emission region is moving relativistically, then the pair production optical depth is decreased because the photon energies and densities in the rest frame of the emission region are lower than they appear to the observer Baring & Harding (1997); Lithwick & Sari (2001). Using the method of (Lithwick and Sari), we can use the requirement that the burst be optically thin to 650 GeV photons to place a lower limit on the Lorentz factor () of the expansion. Assuming a variability timescale of 1 second, a broken power law spectral fit to the BATSE data and a redshift of 0.1 we find a lower limit to the Lorentz factor of 95 for GRB970417a. Therefore, unusually large Lorentz factors are not required for GRB970417a, primarily because the implied luminosity of such a nearby burst is low resulting in a relatively low photon density.
The future of these studies holds great interest. Milagro, a more sensitive detector than Milagrito, is now operating. SWIFT will launch in 2003 and is expected to detect and localize several hundred bursts per year. A large fraction of the SWIFT detections will have measured distances. Milagro will observe these nearby GRBs detected by SWIFT to determine the fraction of GRBs with TeV emission as well as the flux of that TeV emission.
References
- (1) Atkins, R. et al. 2000a, Nuclear Instruments and Methods in Physics Research A, 449, 478
- (2) Atkins, R. et al. 2000b, ApJ, 533, L119
- Atkins et al. (1999) Atkins, R. et al. 1999, ApJ, 525, L25
- Band et al. (1993) Band, D. et al. 1993, ApJ, 413, 281.
- Baring & Harding (1997) Baring, M. G. & Harding, A. K. 1997, ApJ, 491, 663
- Boettcher & Dermer (1998) Bottcher, M. & Dermer, C. D. 1998, ApJ, 499, L131
- Briggs et al. (1999) Briggs, M. S., Pendleton, G. N., Kippen, R. M. , Brainerd, J. J., Hurley, K. , Connaughton, V. & Meegan, C. A. 1999, ApJS, 122, 503
- Chiang & Dermer (1999) Chiang, J. & Dermer, C. D. 1999, ApJ, 512, 699
- Connaughton (1999) Connaughton, V. 1999 (private communication)
- Dermer, Chiang & Mitman (1999) Dermer, C.D., Chiang, J., & Mitman, K.E. 1999, ApJ(submitted)
- Fenimore (2001) Fenimore, E. at al. 2001, ApJ, 552, 57
- Fishman (1995) Fishman, G. J. 1995, PASP, 107, 1145
- Gould & Schreder (1966) Gould, R.J. & Schreder, G. 1966, Phys. Rev. Lett., 16(6), 252
- Helene (1983) Helene, O., et al. 1983, Nucl. Instr. Meth. Phys. Res. 212, 319
- Hurley et al. (1994) Hurley, K., et al. 1994, Nature, 372, 652
- Jelley (1966) Jelley, J.V. 1966, Phys. Rev. Lett., 16(11), 479
- Kaneko (2000) Kaneko, Y. (private communication)
- Lithwick & Sari (2001) Lithwick, Y. & Sari, R. 2001, ApJ, 555, 540
- Meszaros & Rees (1993) Meszaros, P. & Rees, M. J. 1993, ApJ, 418, L59
- Norris (2000) Norris, J. 2000, ApJ, 534, 248
- Norris (2002) Norris, J. 2002, astro-ph 0201503
- (22) Norris, J. 2002, private communication.
- van Paradijs, Kouveliotou & Wijers (2000) van Paradijs, J., Kouveliotou, C., & Wijers, R. A. M. J. 2000, ARA&A, 38, 379
- Pilla & Loeb (1998) Pilla, R. P. & Loeb, A. 1998, ApJ, 494, L167
- Preece et al. (2000) Preece, R. D., Briggs, M. S., Mallozzi, R. S., Pendleton, G. N., Paciesas, W. S., & Band, D. L. 2000, ApJS, 126, 19
- Preece (1999) Preece, R. 1999, (private communication)
- Primack, Bullock, Somerville & MacMinn (1999) Primack, J. R., Bullock, J. S., Somerville, R. S. & MacMinn, D. 1999, Astroparticle Physics, 11, 93
- Salamon & Stecker (1998) Salamon, M. H. & Stecker, F. W. 1998, ApJ, 493, 547
- Schmidt (2001) Schmidt, M. 2001, ApJ, 552, 36
- Schneid et al. (1992) Schneid, E. J. et al. 1992, A&A, 255, L13
- Schneid et al. (1995) Schneid, E. J. et al. 1995, ApJ, 453, 95
- Sommer et al. (1994) Sommer, M. et al. 1994, ApJ, 422, L63