BeppoSAX Wide Field Cameras observations of six type I X-ray bursters
We have discovered three certain (SAX J1324.56313, 2S 1711339 and SAX J1828.51037) and two likely (SAX J1818.71424 and SAX J2224.95421) new thermonuclear X-ray burst sources with the BeppoSAX Wide Field Cameras, and observed a second burst ever from a sixth one (2S 0918549). Four of them (excluding 2S 1711339 and 2S 0918549) are newly detected X-ray sources from which we observed single bursts, but no persistent emission. We observe the first 11 bursts ever from 2S 1711339; persistent flux was detected during the first ten bursts, but not around the last burst. A single burst was recently detected from 2S 0918549 by Jonker et al. (2001); we observe a second burst showing radius expansion, from which a distance of 4.2 kpc is derived. According to theory, bursts from very low flux levels should last s. Such is indeed the case for the last burst from 2S 1711339, the single burst from SAX J1828.51037 and the two bursts from 2S 0918549, but not for the bursts from SAX J1324.56313, SAX J1818.71424 and SAX J2224.95421. The bursts from the latter sources all last 20 s. We suggest that SAX J1324.56313, SAX J1818.71424, SAX J1828.51037 and SAX J2224.95421 are members of the recently proposed class of bursters with distinctively low persistent flux levels, and show that the galactic distribution of this class is compatible with that of the standard low-mass X-ray binaries.
Key Words.:
accretion, accretion disks – binaries: close – stars: individual (SAX J1324.56313, SAX J1818.71424, SAX J1828.51037, SAX J2224.95421, 2S 1711339, 2S 0918549) – stars: neutron – X-rays: bursts1 Introduction
About 40% of the low mass X-ray binaries in our Galaxy occasionally show (so-called Type I) X-ray bursts, which are thermonuclear flashes due to unstable helium and/or hydrogen burning of matter accreted on a neutron star surface (for a review see e.g. Lewin et al. 1993). A typical burst shows a fast rise ( s) and exponential decay, softening during the decay (interpreted as cooling of the neutron star photosphere), and a spectrum which can be well described with black-body radiation. At the moment, about 70 X-ray bursters are known, approximately 20 of which have been discovered with BeppoSAX (e.g., in ’t Zand 2001).
Most X-ray bursters are detected with persistent X-ray flux observed before and after bursts. But some sources have been detected during bursts only, with upper-limits on the persistent emission. These limits vary widely, as they depend on the sensitivity of the instrument used. For example, the X-ray sources in the globular clusters Terzan 1 and Terzan 5 were detected with the Hakucho satellite during bursts only, but EXOSAT and ROSAT also detected the persistent emission (Makishima et al. 1981, Warwick et al. 1988, Verbunt et al. 1995).
The study of X-ray bursts serves various purposes. First, applying the theory of X-ray bursts to observations provides information about the neutron star (e.g., its radius when the distance is known) and about its companion (e.g., whether the matter transferred from the companion is hydrogen-rich or not). Second, the bursts unambiguously decide which of the low-mass X-ray binaries contain a neutron star as opposed to a black hole, and provide (an upper limit to) the distance of the binary, from the condition that its luminosity should be less than the Eddington luminosity. Third, new low-mass X-ray binaries may be discovered by the detection of bursts, in cases where the persistent flux is too low. The last two points help in forming a more accurate view of the total number and distribution of low mass X-ray binaries in our Galaxy, and of the fraction that contains a neutron star.
In this paper we describe the observation with the BeppoSAX Wide Field Cameras of six type I burst sources. Four of these are new X-ray sources with a persistent flux below the detection threshold of the Wide Field Cameras of . The fifth source is a known X-ray source, from which we detect bursts for the first time. The sixth source is also a previously known X-ray source, the first burst of which was recently discovered by Jonker et al. (2001); we describe a second burst from this source and use it to determine its distance. In Sect. 2 we describe the observations and data reduction; the results are described in Sect. 3. Because of their diversity, the sources are discussed in separate subsections, each of which is accompanied by a sub-subsection in which comparison with other observations are made. Finally, in Sect. 4 we discuss some implications of our results for the theory of bursts (Sect. 4.1) and for various sub-populations of the low-mass X-ray binaries with neutron stars (Sect. 4.2).
| SAX | SAX | SAX | SAX | 2S | 2S | |
| J1324.56313 | J1818.7+1424 | J1828.5-1037 | J2224.95421 | 1711339 | 0918549 | |
| Source parameters | ||||||
| Burst time (MJD) | 50672.151 | 50683.770 | 51988.863 | 51488.454 | b1-11, Table 2 | 51335.049 |
| RA (J2000) | ||||||
| Dec (J2000) | ||||||
| (99% confidence.) | ||||||
| (day) | 58 | 31 | 25 | 65 | 66 | 62 |
| (ks) | 18.5 | 16.2 | 12.7 | 40.2 | 314 | 36 |
| ( ) | 1.5a | 0.1a | 1.9a | 0.5a | 1.5b | 0.24c |
| ( ) | () | () | () | () | ||
| (kpc) | 4.2 | |||||
| Burst parameters | ||||||
| (s) | 11.20.6 | 2.60.2 | ||||
| x | 8 | 4 | 7 | 6 | 6 | 5 |
| (s) | 21.51.3 | 3.90.7 | ||||
| (s) | 4.70.6 | 1.80.3 | ||||
| black-body fit | ||||||
| (s) | 9.3 | 6.0 | 25.1 | 4.0 | - | 86.4 |
| (kev) | 2.30.2 | 2.50.3 | 1.60.1 | 2.260.05 | ||
| (km) at | 4.70.9 | 4.70.5 | 5.511.9 | 6.30.2 | ||
| ( ) | 1.080.40 | 1.000.42 | 4.050.27 | |||
| ( ) | 1.650.73 | 1.660.89 | 6.10.5 | |||
| ( ) | 4.31.6 | 3.31.5 | ||||
| ( ) | 2.6 | 0.86 | 4.3 | 0.67 | - | 52 |
| (d.o.f.) | 1.0 (26) | 0.6 (26) | 0.7(26) | 1.0(26) | 0.9 (270) | 1.6 (26) |
| bremsstrahlung fit | ||||||
| (keV) | 44. | 50. | - | 6414 | ||
| (d.o.f.) | 1.4 (26) | 0.5 (26) | 1.1(26) | 1.1(26) | - | 9.7 (26) |
| power law fit | ||||||
| 1.40.2 | 1.40.2 | - | 1.310.04 | |||
| (d.o.f.) | 1.5 (26) | 0.5 (26) | 1.1(26) | 1.1(26) | - | 10 (26) |
a Interpolated from Dickey & Lockman (1990); bFrom NFI, see Sect. 3.2.1; c From Christian & Swank (1997); dValues for b8.
2 Observations and data analysis
Our observations were obtained from mid 1996 to the end of 2001 with the Wide Field Cameras (Jager et al. 1997) on board of the BeppoSAX satellite (Boella et al. 1997). The Wide Field Cameras are two identical coded mask aperture cameras with a (full width to zero response) field of view and angular resolution. The source location accuracy is between and , and the passband is 2 to 28 keV. Data are collected with a time resolution of 0.5 ms. The sensitivity depends on the off-axis angle, but is on average a few mCrab in a s exposure.
The large sky coverage together with the good angular and time resolution make the Wide Field Cameras an excellent experiment to detect fast transient X-ray phenomena at unexpected sky positions and simultaneously study the behavior of a large fraction of the low mass X-ray binary population in our Galaxy.
Roughly 90% of all observations of the Wide Field Cameras are carried out in the so-called ’secondary mode’, in which the pointing of the satellite is set for the Narrow Field Instruments. The pointing of the Wide Field Cameras is arbitrary, except for solar angle constraints and the constraint that the two Wide Field Cameras point in opposite directions, perpendicular to the direction of the Narrow Field Instruments. The remaining 10% of the Wide Field Camera observations are ’primary mode’ observations, in which one of the two cameras is pointed at the Galactic Center (and the other, thus, at the anti-center).
We search for X-ray bursts in the lightcurve of the total detector (i.e., a superposition of all the sources in the field of view). With this method we detect a burst if the fast fluctuations in the overall count-rate are small (), and if the burst lasts 10 to 100 seconds and reaches a peak count-rate of at least a few times . If a burst-like event is observed, a sky image is reconstructed by cross-correlating the detector image with the coded mask (Jager et al. 1997). During this reconstruction the background is subtracted automatically. By comparing the sky image with a catalogue of X-ray sources the burst event can be attributed to a known, or previously unknown, X-ray burster. In this way we discovered bursts from SAX J1324.56313, SAX J1828.51037, SAX J1818.7+1424, SAX J2224.95421 and 2S 0918549. The burst positions of the newly discovered sources are then used to search for persistent emission and other, possibly somewhat fainter, X-ray bursts in all Wide Field Cameras observations of these sources.
During primary mode, lightcurves for individual sources are created and are searched for bursts. In these data we discovered bursts from 2S 1711339.
The SAX positions for new X-ray sources are also used to generate studies with the RXTE All-Sky Monitor (ASM; Levine et al. 1997), which has smaller cameras than the WFC but typically provides many measurements per day for every X-ray source. Retrospective ASM light curves are obtained by re-fitting the coded mask data as a superposition of the mask shadows for all of the sources in a particular camera exposure (90 s), including the new target of interest. This reprocessing effort yields light curves that track the behavior of X-ray sources with substantially greater sensitivity compared to the threshold for generic identifications of new transients at random sky positions.


3 Results
3.1 New sources
A single burst was detected at four locations where no X-ray source is known from previous observations, including the ROSAT All Sky Survey (Voges et al. 1999). We conclude that we have detected four new sources and designated them with SAX names in Table 1.
All new sources are detected only during the burst: the Wide Field Cameras show no persistent emission or other burst between August 1996 and December 2001 in any of the four cases. To compute the upper limits listed in Table 1, we employ absorption columns interpolated from HI maps by Dickey & Lockman (1990), and a power law spectrum with photon index =1.0. (This value is typical for burst sources at low luminosities; see for example Sect. 3.3 below.) For a photon index of =2.0 the flux values would be 70% lower.
The All-sky Monitor onboard RXTE satellite (RXTE/ASM) scanned the positions of the four new sources. During the course of our analysis the lightcurves of these sources became available. These lightcurves rather uniformly cover a five year period with, most of the time, several 90 s observations per day and actual exposure times of s and s, respectively. None of the four lightcurves show a clear detection during this period at an upper-limit of (2-10 keV) in 7 days of observation.
The lightcurves of the bursts in various passbands are shown in Fig. 1. They have a fast-rise (13 s) and exponential-like decay (for SAX J1828.51037 this is evident mainly at the lower energies). The decay is faster at higher energies, indicative of spectral softening; decay times are listed in Table 1 together with the spectral fits for the bursts.
The burst profile of SAX J1828.51037, as shown in Fig. 1, looks rather strange even considering the low statistical quality. But it is precedented by profiles from at least one well established burster (4U 1636536; van Paradijs et al. 1986). Thus, it would be interesting to observe more bursts from SAX J1828.51037 with better sensitivity.
To obtain a spectrum we integrate the spectrum over the burst duration; the exact integration times are given in Table 1. We fit the spectra with a black-body, power law, and bremsstrahlung model. The black-body gives the best description for three of the four bursts and is acceptable for SAX J1818.7+1424, as expected for type I bursts.
If they are indeed type I bursts, their peak flux must be less than or equal to the Eddington limit of (for canonical neutron star values), and we can use the observed peak flux to obtain an upper limit to the distance (e.g. Lewin et al. 1993); these upper limits are also listed in Table 1. We note that due to systematic uncertainties the errors on the distance are (e.g. Kuulkers et al. 2002).
To prove that the above-discussed bursts are genuine type I X-ray bursts it must be shown that a black body gives the only acceptable description of their spectrum. From Table 1 we see that this is the case only for SAX J1324.56313; for the other three bursts bremsstrahlung or power-law spectra are still acceptable. That is why we consider the two alternative explanations for these three bursts, i.e. that they are stellar X-ray flares or X-ray flashes.
Stellar X-ray flares are generally much longer (hours) and have much lower peak fluxes than the bursts that we have observed (e.g. Greiner et al. 1994, Haisch & Strong 1991). We therefore consider it unlikely that any of the three bursts is a stellar flare.
X-ray flashes are related to gamma-ray bursts in the sense that they look like the prompt X-ray counterparts to Gamma ray bursts but lack the -ray emission: they have similar time scales, have the same variety of time profiles (including fast-rise exponential-decay shapes), and have spectra that are best described by a power law rather than black body radiation (Heise et al. 2001). X-ray flashes are non-repetitive, and if they are related to gamma-ray bursts no detectable X-ray emission is expected before or lang after the flash. The Wide Field Cameras have observed about 25 of these (in ’t Zand et al., in prep.).
SAX J1828.51037 was previously observed during a ROSAT observation (see Sect. 3.1.1), leaving only doubts on the nature of SAX J1818.71424 and SAX J2224.95421. If these two bursts were X-ray flashes with fast-rise exponential-decay time profiles, they would be the shortest two of all, and they would be the only ones for which the black body model for the spectrum can not be unambiguously ruled out. Together with the fact that the bursts were at positions near the Galactic plane where type I bursters are likely to occur we think that the most probable explanation for all four bursts is therefore that they are type I X-ray bursts.
3.1.1 Other observations
HD 168344, a 7.6 magnitude K2-type star is within the error-radius at a distance of from the centroid of SAX J1818.7+1424. There are 18 stars of magnitude 8 or brighter within a 4 field around SAX J1818.7+1424 (ESA 1997). This makes the chance probability of having an 8th magnitude or brighter star within the error radius 0.8%. This probability is so small that we consider the possibility that the event was an X-ray flare from HD 168344.
According to the Tycho Catalogue (ESA 1997) it is a K2 star with and , a parallax of and a proper motion of about 0.029′′/yr. A main sequence K2 star with this apparent magnitude would have a distance of only pc, incompatible with the small observed parallax. In contrast, a K2 III star of the observed magnitude would be at a distance of 230-270 pc, compatible with the observed parallax, and its velocity perpendicular to the line of sight would be comparable with the observed radial velocity.
The too short burst time scale of 10 s and the high peak luminosity of at a distance of 230 pc, both exclude that the burst observed by us was a stellar flare on HD 168344. (No stellar flare this short and bright has ever been observed to our knowledge; e.g. Haisch & Strong 1991.) If a neutron star were a companion of HD 168344, the peak flux of its burst would be of the Eddington flux. This also is unlikely We conclude that HD 168344 is not the optical counterpart of SAX J1818.7+1424.
Whereas none of the four burst positions coincides with a catalogued ROSAT source, we find that SAX J1828.51037 is in the field of view of a 9.4 ks ROSAT/PSPC pointed observation obtained on April 4 1993. We have analyzed this observation and detect seven sources (in channels 50-240), one of which is in the Wide Field Cameras error-circle. With a radius for the ROSAT field of view of the chance probability that one of seven sources falls in the SAX J1828.51037 error-circle of is about 2%. Thus the ROSAT source is probably the counterpart of SAX J1828.51037, confirming that SAX J1828.51037 was not an X-ray flasher. The position of the ROSAT source is RA=, Dec= (J2000) with an error of (1). The source is not detected in channels 11-50, as expected for a highly absorbed source. The countrate of 0.0110.002 cts s-1 corresponds to an unabsorbed flux between 0.5-2.5 keV of for a power law with photon index . At a distance of 6.2 kpc this corresponds to a luminosity of .

3.2 2S 1711339
2S 1711339 is an X-ray source that was bright between July 1998 and May 1999. The Wide Field Cameras covered this outburst in August-October 1998 and February-April 1999. Ten short bursts were detected which we designate b1, b2,…,b10. All these bursts appear to have a similar shape. In the left panel of Fig. 3 we show the best example (b5) of these bursts. To fit the average persistent emission before and after the bursts, we employ the absorption column derived in Sect. 3.2.1. A cut-off power law with a photon-index of 0.70.5 and a high-energy cut off of 2.80.8 keV provides a satisfactory fit; the flux of the persistent emission is given in Table 1.

During a 40 ks observation on March 22 2000 an eleventh burst (b11) was detected while the persistent emission level before and after the burst was below the detection limit. Assuming that the spectral parameters of the persistent flux observed with bursts b1-b10 still apply, we obtain a upper-limit on the persistent flux of (2-28 keV); this is a factor of ten lower than during bursts b1-b10. This burst, which is shown in the right panel of Fig. 3, has a different shape than the previous 10 bursts. Both the rise and decay time for burst b11 are longer. In Table 2 we summarize the characteristics for the 11 individual bursts. In Fig. 2 we show the RXTE/ASM long-term lightcurve of 2S 1711339 which shows that the first 10 bursts occurred during an outburst.
It is clear from Table 2 that none of the exponential fits to the decay is formally acceptable. Also, for none of the individual bursts cooling can be unambiguously shown. Therefore, we decided to combine the light curves of burst b1 to b10. The last burst, b11, is excluded because of its deviating shape. To combine the bursts we created lightcurves with a time resolution of 1 s. We took the highest bin as the peak for each burst and the corresponding time as t=0 s. Then the bursts were combined, by averaging the count rates and determining the statistical error in the mean. Fig. 1 shows the resulting profile.
| burst | Start time | CRpeak | ||
|---|---|---|---|---|
| (MJD) | (cm-2 s-1) | (s) | 47 d.o.f. | |
| b1 | 51058.024301 | 1.150.05 | 6.90.4 | 1.3 |
| b2 | 51087.268967 | 1.730.04 | 7.00.3 | 1.5 |
| b3 | 51229.857483 | 1.720.04 | 6.30.2 | 1.3 |
| b4 | 51232.083607 | 1.690.04 | 3.60.1 | 1.4 |
| b5 | 51234.270915 | 1.630.06 | 5.20.2 | 1.6 |
| b6 | 51249.958462 | 0.940.03 | 14.50.8 | 1.4 |
| b7 | 51262.473439 | 1.290.03 | 11.50.4 | 1.4 |
| b8 | 51274.775982 | 1.880.04 | 6.90.2 | 1.5 |
| b9 | 51278.327360 | 1.250.07 | 10.50.9 | 1.5 |
| b10 | 51278.992006 | could not be constrained | ||
| b11 | 51625.046991 | 1.180.04 | 15.00.7 | 1.3 |
A black-body spectrum was fit to the burst spectrum of all 11 burst. We assumed a fixed absorption column, (see Sec. 3.2.1). We fitted the 11 burst spectra simultaneously; the black-body temperature was forced to be the same for all bursts, whereas the black-body radius was allowed to vary. In Table 1 we have summarized the results for fits to the spectrum and to the exponential decays in different passbands. Instead of giving the radius of each individual burst we indicate the range of radii in Table 1. Varying the temperature and forcing the radius to be the same for all bursts simultaneously gives a range of temperatures between 1.2-2.0 keV and a radius of 7.80.9 km (at 7.5 kpc). Burst b8 has the highest peak flux. The temperatures and the radii found are typical values for Type I bursts. We conclude that the 11 events are Type I bursts.
From the observed peak flux during the burst and the constraint that this must be less than the Eddington limit, we derive from the brightest burst b8 an upper limit to the distance of 2S 1711339 of 7.5 kpc.
3.2.1 Other observations of 2S 1711339
A Chandra/ACIS-S observation of 2S 1711339 was performed on June 9 2000 for a total of 949 s. A single relatively bright source with a countrate of 0.460.02 cts s-1 is detected at a position RA=, Dec= (J2000) with a conservative error-radius of .
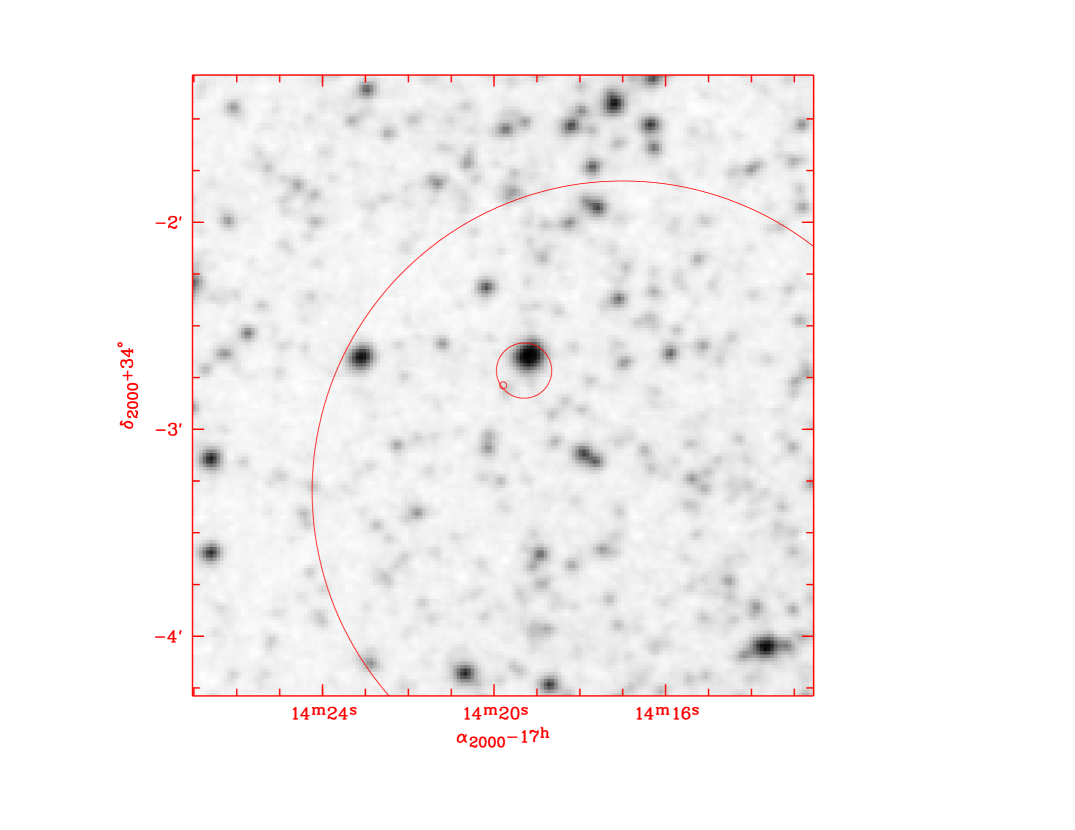
Our WFC position for 2S 1711339 (Table 1), the position of the Ariel V source A 171034 (Carpenter et al. 1977), and the position of the source RXS J171419.3340243 from the ROSAT All Sky Survey (Voges et al. 1999) are all compatible with the Chandra position of 2S 1711339 as illustrated in Fig. 4. We conclude that they are all the same source. We note that the nearest source with comparable (ROSAT) brightness in the ROSAT All Sky Survey is at a distance of .
The spectrum during a BeppoSAX Narrow Field Instrument (NFI) observation on February 29, 2000 (MJD 51603) of 2S 1711339 is best described by an absorbed power law model with photon index 2.2 and an absorption column of for the persistent emission (Migliari, di Salvo, Belloni, in preparation). Use of this spectrum for the persistent flux measured with the Wide Field Cameras does not significantly change the numbers given in Sect. 3.2 and Table 1. The flux between 2 and 6 keV in units of for 2S 1711339 varied from in February 1975 to 200 in September 1976 (Carpenter et al. 1977), to 5 during the EXOSAT Galactic Plane Survey (Warwick et al. 1988). Assuming the spectrum as observed by the NFI we obtain fluxes between 2 and 6 keV in units of of 2 during the ROSAT All Sky Survey, 2.4 during the NFI observations, and 0.3 during the Chandra/ACIS-S observations. The large range of fluxes shows that 2S 1711339 is a genuine transient.
3.3 2S 0918-549
A single bright burst was detected from the X-ray source 2S 0918-549 on June 6.049, 1999. The burst has a fast rise, a flat top and an exponential decay. In Table 1 we summarize exponential-decay fits in different passbands and the results of spectral modeling. We fix the interstellar column at the value found from Einstein X-ray data (Christian & Swank 1997).
The persistent flux is satisfactorily described by a cut-off power law spectrum with a photon index of 0.90.6 and a high-energy cut-off of 5.23.8 keV, or a bremsstrahlung spectrum with a temperature of 8.91.8 keV (the flux is only marginally different between the two models). The black-body model gives the best fit to the burst spectrum. We also performed time-resolved spectral fits for the burst. The values of and Rbb are plotted as a function of time in Fig. 5. We notice that the burst shows the characteristics of a radius-expansion burst (an increase in the black-body radius, and a drop in the black-body temperature while the flux stays constant). A distance of 4.2 kpc (with an uncertainty of 30%; see e.g. Kuulkers et al. 2002) and a persistent luminosity of are implied.
3.3.1 Other observations
It turns out that 2S 0918549 is in the field of view of a 4.8 ks ROSAT PSPC observation of HD 81188, with a countrate (channels 11-240) of 9.830.05 cts s-1. We have analyzed its spectrum and tried to model it with the combination of a 2 keV black body and 2 keV thermal bremsstrahlung spectrum as fitted by Christian & Swank (1997) to Einstein data of this source. This model is not acceptable. An acceptable fit (, 9 d.o.f.) is obtained for a combination of a 0.1 keV black body and 3.0 keV thermal bremsstrahlung spectrum, absorbed by . The ratio of the black-body to the bremsstrahlung flux in the 0.5-2.5 keV band is 1.45. For this fit the 2-10 keV flux is due to the bremsstrahlung only, and is , a factor two below the level observed with the Wide Field Cameras. The flux in the 0.5-20 keV range is , a factor four higher than the level observed with Einstein.

Jonker et al. (2001) were the first to detect a burst of 2S 0918549. The data analyzed by Jonker et al. do not combine good time resolution with spectral resolution. Therefore Jonker et al. cannot and indeed do not establish that the burst they observed is at the Eddington-limit. However, they estimate a peak luminosity of about (2-20 keV), close to the peak flux of the burst we observed. Accordingly, their distance upper-limit of 4.9 kpc is comparable to our measurement. We conclude that the burst observed by Jonker et al. must be at, or close to, the Eddington limit as well; indeed, the lightcurve presented Jonker et al. is highly suggestive of a radius-expansion burst. The upper-limit (2-20 keV) for the persistent flux before the burst derived by Jonker et al. is compatible with (and close to) the persistent flux that we detect.
The optical counterpart of 2S 0918549 was identified by Chevalier & Ilovaisky (1987), as a blue star (21.0, 0.3) in the error circle of the Einstein position for the X-ray source. The X-ray to optical flux ratio of indicates that the source is a low-mass X-ray binary. Chevalier & Ilovaisky assume a distance of 15 kpc, and note that the X-ray and optical luminosities are low, as compared to those of average low-mass X-ray binaries. Our distance estimate of 4.2 kpc leads to lower luminosities with 6.9 (for 1.0), and .
The visual extinction is estimated by assuming that 0 a common value for low-mass X-ray binaries and is roughly compatible with the value estimated for the X-ray absorption, using the relation between the latter and the visual extinction according to Predehl & Schmitt (1995).
4 Discussion
Our observations add at least three and possibly five bursters to the list of X-ray bursters in our Galaxy and provide a distance estimate for a recently discovered burster. In this section we discuss the implications of our results for the theory of bursts (in Sect. 4.1) and make a comparison between the class of bursters with low persistent luminosities – to which we have added four members – with other low-mass X-ray binaries (in Sect. 4.2).
4.1 Comparison with burst theory
We compare the properties of the bursts with theory. Fujimoto et al. (1987, see also Bildsten 2000) propose three classes of bursts. At the lowest accretion rates, M M⊙ yr-1, a burst is triggered by thermally unstable hydrogen burning, and can last between 102 to 104 s. At intermediate accretion rates, M⊙ yr-1, a pure helium burst occurs with a duration of order 10 s. In the high accretion regime, M⊙ yr-1, a burst with a duration of tens of seconds may occur in a mixed He/H environment. At even higher or lower accretion rates no bursts are expected to occur. To consider our observations, we first converted accretion rates to fractions of the Eddington limit. The pure helium bursts occur when the accretion rate is in the range 0.014 - 0.070 of the Eddington accretion rate. The ratio of (the upper limit to) the persistent flux and the peak flux during the burst, where the latter is (a lower limit to) the Eddington flux, provides an estimate of the fraction of the Eddington limit at which a source is accreting. This assumes that the emission is isotropic and that the persistent flux in the range 2-28 keV is close to the bolometric flux. With the values listed in Table 1 we obtain for SAX J1324.56313, for SAX J1818.7+1424, for SAX J1828.51037, for SAX J2224.95421, for 2S 1711339 at bursts b1-b10, and at burst b11, and for 2S 0918549.
We thus note that, with the exception of 2S 1711339 during bursts b1-b10, all sources are in the low accretion regime, and thus according to theory should emit bursts lasting longer than about 100 s. Source 2S 1711339 follows this prediction nicely, showing short (10-20 s) bursts b1-b10 when accretion was in the intermediate range, and a longer (60 s) burst b11 when the accretion had dropped to the low regime. Also the burst from SAX J1828.51037 lasts about 60 s, pointing towards the low accretion regime. Similarly, the bursts observed by Jonker et al. (2001) and by us for 2S 0918549 are long (150 s), as predicted from the low accretion rate.
In remarkable contrast, the bursts from SAX J1324.56313, SAX J1818.7+1424 and SAX J2224.95421 are all short (10-20 s), even though these systems appear to be in the low accretion regime. Can it be that the true accretion rate is higher than we estimate? One possibility is that the emission is anisotropic. However, to our knowledge no indication has been found for anisotropies in other burst systems. A second possibility would be that most of the persistent flux is outside the observed 2-28 keV range. However, we estimate that more than 50% of the persistent flux is in this range. We therefore consider it unlikely that these effects are sufficient to bring especially SAX J1324.56313 and SAX J2224.95421 to the intermediate accretion regime.
A third possibility is that the accretion is limited to a small area of the neutron star, e.g. a ring connected with the accretion disk (Popham & Sunyaev 2001). This enhances the local accretion rate, which is the parameter determining the properties of the bursts (as discussed by Bildsten 2000). This would imply that the accreting surfaces in SAX J1324.56313 and SAX J2224.95421 are less than about 15% and 8% of the surface of the neutron star, respectively. This possibility cannot be excluded a priori, but raises the interesting question why the accreting surface areas would be so different between bursters – the rotation period of the neutron star could affect the area over which the accreted matter spreads out, for example.
A fourth possibility is that the persistent flux at the time of the burst is not representative of the time-averaged flux in the months before the burst. In transients like e.g. Aql X-1, Cen X-4, XTE J1709267 and SAX J1750.82900, X-ray bursts were detected during the decline of the outburst, at times when the persistent flux, easily detectable at , was at an accretion rate of ordinary burst sources (Matsuoka et al. 1980, Koyama et al. 1981, Cocchi et al. 1998, Natalucci et al. 1999). Also the transient SAX J1808.43658 showed a s long burst 30 days after the peak of an outburst, when the persistent flux had declined below the detection limit of the Wide Field Cameras, (in ’t Zand et al. 2001). However, the RXTE/ASM lightcurves show no detection of SAX J1324.56313 and SAX J1818.7+1424, at an upper-limit of making a transient outburst very unlikely.
One might propose the possibility that these systems are old and the companion has only pure helium left. In this case only helium bursts can occur independent of the accretion rate. However, calculations on bursts due to pure helium accretion show that at low accretion rates the burst duration increases to s (Bildsten 1995).
For pure helium bursts, the energy released during the burst due to nuclear fusion is about 1% of the accretion energy released when the same matter accreted onto the neutron star before the burst (see e.g. Lewin et al. 1993). From the observed burst fluences and the (upper limits to) the persistent flux, we can therefore derive (lower limits to) the interval to the previous burst. The computed waiting time of 16 d is sufficiently long to explain that only one burst was detected for 2S 0918549, whose WFC exposure times totalled for all observations between August 1996 and December 2001 is about 62 d. For SAX J1324.56313, SAX J1818.7+1424, SAX J1828.51037 and SAX J2224.95421 the total observation times between August 1996 and December 2001 are about 58 d, 30 d, 25 d and 65 d, respectively. For these sources the waiting times are d, d, d and d. The chance probability of observing at most one burst for these sources is then 0.07% or (much) less. The fact that only one burst was observed for each system suggests that the persistent emission levels are much lower than the upper-limits derived.
4.2 Low persistent emission bursters
Gotthelf & Kulkarni (1997) discovered a burst from a low-luminosity source in the globular cluster M 28, with a peak luminosity that is only 0.02% of the Eddington limit. This low peak flux discriminates it from the bursters discussed by Cocchi et al. (2001) and in this paper, that have fluxes close to the Eddington limit: if their peak fluxes were as low as that of the M 28 source, they would be a local population near the Sun, which is clearly incompatible with their galactic length and latitude distributions.
As discussed by Cocchi et al. (2001), a class of bursters with low persistent emission has emerged in recent years. The four sources discussed in Sect. 3.1 also appear to be member of this class, strenghtening its existence. Whereas most bursters emit their bursts at persistent luminosities , most of the members of this new class emit bursts at luminosities below the RXTE/ASM detection-limit of . How much lower is not clear, and we briefly consider three possibilities. One is that the sources are steady in the range , as suggested for the bursters 1RXS J171824.2402934 (Kaptein et al. 2000) and SAX J1828.51037 (this paper), whose persistent emission levels were detected at this level with ROSAT a few years before the burst. The second possibility is that the sources are steady at the level , the quiescent level of soft X-ray transients with neutron stars; and the third possibility is that they are usually at this low level, but emit their bursts during or soon after faint ( ) outbursts, as suggested by the case of 2S 1711339. More sensitive X-ray observations are required to discriminate between these various possibilities.
| Name | (s) | |||
| SAX J1324.5-6313 | 540 | 6.0 | ||
| RX J171824.2-402934a | 90 | 47.5 | ||
| GRS 1741.9-2853b | 130 | 8.8 | ||
| 180 | 11.0 | |||
| 100 | 16.0 | |||
| SAX J1752.4-3138c | 120 | 21.9 | ||
| SAX J1753.5-2349d | 180 | 8.9 | ||
| SAX J1806.5-2215d | 200 | 4.0 | ||
| 210 | 9.0 | |||
| SAX J1828.51037 | 226 | 11.2 | ||
| SAX J1818.7+1424 | 110 | 4.5 | ||
| SAX J2224.95421 | 940 | 2.6 | ||
| a Kaptein et al. (2000); b Cocchi et al. (1999). | ||||
| c Cocchi et al. (2001); d in ’t Zand et al. (1998). | ||||
However, a first test can be made on the basis of the spatial distributions. In Figure 6 we compare the distributions of galactic length and latitude for the bursters with low persistent luminosity – listed in Table 3 – with those of the low-mass X-ray binaries. For the latter we use exponential distributions in galactic longitude and latitude with scale angles of and , respectively, as determined by van Paradijs & White (1995). Kolmogorov-Smirnov tests indicate that the bursters with low persistent luminosity may indeed be drawn from the distribution of low-mass X-ray binaries.
A new class of faint transients has been discovered with BeppoSAX: transients whose outbursts are rather fainter (peaking below ) and often also shorter (lasting less than a month) than the outbursts of the ordinary soft X-ray transients which reach the Eddington limit and may last months (Heise et al. 2000). It is tempting to assume that the bursters at low persistent emission are an extension of this class of faint transients. Remarkably, this new class of faint transients is more concentrated towards the galactic center than the ordinary low-mass X-ray binaries (In ’t Zand 2001). A Kolmogorov-Smirnov test shows that the galactic longitudes of bursters with low persistent emission cannot be drawn from the longitude distribution of the faint transients, as illustrated in Fig. 6.
We conclude that the bursters at low persistent emission are probably not from the same class as the faint transients, which makes the transient explanation even more unlikely.

Acknowledgements.
We thank Gerrit Wiersma for discussions on the Wide Field Cameras exposures. We thank Darragh O’Donoghue for optical observations of the bright star near the position of 2S 1711339. The BeppoSAX satellite is a joint Italian and Dutch program. We made use of quick-look results provided by the ASM/RXTE team.References
- Bildsten (1995) Bildsten, L. 1995, ApJ 438, 852
- Bildsten (2000) Bildsten, L. 2000, in S. Holt, W. Zhang (eds.), Cosmic explosions, AIP, p. E65
- Boella et al. (1997) Boella, G., Butler, R., Perola, G., et al. 1997, A&AS 122, 299
- Carpenter et al. (1977) Carpenter, G.F., Eyles, C.J., Skinner, G.K., Wilson, A.M., & Willmore, A.P. 1977, MNRAS 179, 27
- Chevalier & Ilovaisky (1987) Chevalier, C., & Ilovaisky, S.A. 1987, A&A 172, 167
- Cocchi et al. (1998) Cocchi, M., Bazzano, A., Natalucci, L., et al. 1998, ApJ 508, L163
- Cocchi et al. (1999) Cocchi, M., Bazzano, A., Natalucci, L., et al. 1999, A&A 346, L45
- Cocchi et al. (2001) Cocchi, M., Bazzano, A., Natalucci, L., et al. 2001, A&A 378, L71
- Christian & Swank (1997) Christian, D.J., & Swank, J.H. 1997, ApJS 109, 177
- Dickey & Lockman (1990) Dickey, J.M., & Lockman, F.J. 1990, ARA&A 28, 215
- ESA (1997) ESA, 1997, The Hipparcos and Tycho Catalogues, ESA SP-1200
- Fujimoto et al. (1987) Fujimoto, M.Y, Sztajno, M., Lewin, W.H.G., & van Paradijs, J. 1987, ApJ 319, 902
- Gotthelf & Kulkarni (1997) Gotthelf, E., & Kulkarni, S. 1997, ApJ 490, L161
- Greiner et al (1994) Greiner, J., Duerbeck, H.W., & Gershberg, R.E., eds. 1994, Flares and Flashes (Berlin: Springer)
- Haisch & Strong (1991) Haisch, B., & Strong, K.T. 1991, ARA&A 29, 275
- Heise et al (2000) Heise, J. in ’t Zand, J.J.M., & Kuulkers, E. 2000, HEAD 32, 28.03
- Heise et al (2001) Heise, J., In ’t Zand, J.J.M., Kippen, & R.M., Woods, P.M., 2001, in E. Costa, F. Frontera, J. Hjorth (eds.), Gamma-Ray Bursts in the Afterglow Era, ESO Astrophys. Symp. Ser., p. 16
- In ’t Zand et al (1998) in ’t Zand, J.J.M., Heise, J., Muller, J.M., et al 1998, Nucl. Phys. B 69/1-3, 228
- In ’t Zand (2002) in ’t Zand, J.J.M., 2001, in A. Gimenez, V. Reglero, & C. Winkler (eds.), Exploring the gamma-ray universe, ESA Pub. Div., p. 463
- In ’t Zand et al (2001) in ’t Zand, J.J.M., Cornelisse, R., Kuulkers, K., et al 2001, A&A 372, 916
- Jager et al. (1997) Jager, R., Mels, W., Brinkman, A., et al. 1997, A&AS 125, 557
- Jonker et al. (2001) Jonker, P. G., van der Klis, M., Homan, J., et al. 2001, ApJ 553, 335
- Kaptein et al. (2000) Kaptein, R.G., in ’t Zand, J.J.M., Kuulkers, E., et al. 2000, A&A 358, L71
- Koyama et al. (1981) Koyama, K., Inoue, H., Makishima, K., et al. 1981, ApJ 247, L27
- Kuulkers et al. (2002) Kuulkers, E., Homan, J., van der Klis, M., et al. 2002, A&A 382, 947
- Levine et al. (1996) Levine, A.M., Bradt, H., Cui, W., et al. 1996, ApJ 469, L33
- Lewin et al. (1993) Lewin, W., van Paradijs, J., & Taam, R. 1993, Space Sci. Rev. 62, 223
- Makishima et al. (1981) Makishima, K., Ohashi, T., Inoue, H., et al. 1981, ApJ 247, L23
- Matsuoka et al. (1980) Matsuoka, M., Inoue, H., Koyama, K., et al. 1980, ApJ 240, L137
- Natalucci et al. (1999) Natalucci, L., Cornelisse, R., Bazzano, A., et al. 1999, ApJ 523, L45
- van Paradijs et al. (1986) van Paradijs, J., Sztajno, M., Lewin, W.H.G., et al. 1986, MNRAS 221, 617
- van Paradijs & White (1995) van Paradijs, J., & White, N. 1995, ApJ 447, 33
- Popham & Sunyaev (2001) Popham, R., & Sunyaev, R. 2001, ApJ 547, 355
- van Predehl & Schmitt (1995) Predehl, P., & Schmitt, J.H.M.M. 1995, A&A 293, 889
- Verbunt et al. (1995) Verbunt, F., Bunk, W., Hasinger, G., & Johnston, H.M. 1995, A&A 300, 732
- Voges et al. (1999) Voges, W., Aschenbach, B., Boller, T., et al. 1999, A&A 349, 389
- Warwick et al. (1988) Warwick, R.S., Norton, A.J., Turner, M.J.L., Watson, M.G., & Willingale, R. 1988, MNRAS 232, 551