The Molecular Continuum Opacity of 24MgH in Cool Stellar Atmospheres
Abstract
The opacity due to photodissociation of 24MgH is investigated in the atmospheres of cool stars. The lowest two electronic transitions and are considered where the cross sections for the latter were published previously (Weck, Stancil, & Kirby 2002a) while the former are presented in this work. Model atmospheres calculated with the PHOENIX code are used to investigate the effect of the photodissociation opacity on spectra of cool stars. The photodissociation cross sections are obtained using a combination of ab initio and experimentally derived potential curves and dipole transition moments. Partial cross sections have been evaluated over the accessible wavelength range Å for all rotational transitions from the vibrational levels . Assuming a Boltzmann distribution of the rovibrational levels of the state, LTE photodissociation cross sections are presented for temperatures between 1000 and 5000 K. Shape resonances, arising from rotational predissociation of quasi-bound levels of the state near threshold, characterize the LTE photodissociation cross sections. A sum rule is proposed as a check on the accuracy of the photodissociation calculations.
1 Introduction
The lack of accurate and complete molecular line and continuum opacity data has been a serious limitation to developing atmospheric models of cool stars (M and later), solar system planets, and Extrasolar Giant Planets (EGPs). Sophisticated modeling programs, such as PHOENIX (Hauschildt & Baron, 1999), require high quality opacity data in order to produce synthetic spectra and predict physical parameters (e.g., surface chemical composition, effective temperature, etc). Typically, atmosphere models include molecular bands with hundreds of millions of spectral lines, mostly derived from molecular band or Hamiltonian models. Moreover, atmospheric models do not consider the effect of molecular photodissociation processes, which may play a role in the opacity at visible and UV wavelengths. An exception is the work of Kurucz, van Dishoeck, & Tarafdar (1987) who included LTE photodissociation calculations of CH and OH in solar and cool stellar atmosphere models. Further, it has been suggested by Short & Lester (1994, 1996) that a missing opacity source between 2500 and 4000 Å might be due to MgH, based on the ground rovibrational photodissociation cross section of Kirby et al. (1979) which peaks at 2920 Å , but has a threshold at 3100 Å. However, the LTE MgH calculations of Weck et al. (2002a) find that the cross sections have significant amplitude to nearly 4500 Å.
In the present work, we have performed extensive calculations of rovibrationally-resolved photodissociation cross sections of 24MgH through the transition, using the most accurate available molecular data. Calculations were performed for the full range of 313 rovibrational levels in the ground electronic state. Assuming a Boltzmann distribution of the rovibrational levels of the state, LTE photodissociation cross sections are also presented for temperatures between 1000 and 5000 K. These photodissociation cross sections as well as those of Weck et al. (2002a) for the transition have been included in cool stellar atmosphere calculations to test if MgH photodissociation is the missing opacity postulated by Short & Lester (1994, 1996). In this paper we investigate the importance of the bound–free opacity in both very cool dwarfs and the objects discussed in Short & Lester (1994, 1996) (K type giants and solar type dwarfs).
Atomic units are used throughout to discuss the molecular calculations unless otherwise stated.
2 Theory of Photodissociation
Potential curves of the and electronic states of MgH calculated by Saxon, Kirby & Liu (1978), as well as the connecting dipole transition moment, were used in the present study. Shifts have been applied to the potential curves, in order to correct for discrepancies between the theoretical dissociation energy and the experimental values given by Balfour & Cartwright (1976) and Balfour & Lindgren (1978). Details about this procedure, together with the fits used for short- and long-range internuclear separations, have been described in a previous publication (Weck et al., 2002b).
For absorption into the rovibrational continuum of electronic state from the rovibrational state of electronic state , the partial rotational photodissociation cross section can be written as (Weck et al., 2002a)
| (1) |
where is the energy of the absorbed photon and are the Hönl-London factors defined, for the transition as
| (5) |
according to the convention proposed by Whiting & Nicholls (1974). In equation (1), the term is the matrix element of the electric dipole transition moment responsible for absorption from the into the electronic state. The continuum wave functions are normalized such that they behave asymptotically as
| (6) |
The continuum and bound wave functions and , respectively, were obtained by solution of the radial Schrödinger equation for the and states, respectively, using a standard numerical method (Cooley, 1961). Wave functions were obtained on a grid with a stepsize of over the internuclear distance range .
3 Photodissociation Calculations
In Figures 1-3 are shown some representative rovibrationally-resolved cross sections for photodissociation through the transition111The complete list of data for photodissociation cross sections is available online at the UGA Molecular Opacity Project Database website http://www.physast.uga.edu/ugamop/.
Figure 1 presents our results for the partial cross sections , as a function of wavelength, for the transitions from the vibrational level with the rotational quantum numbers , 10, 20, 30 and 44 of the electronic state. From the quantitative point of view, cross sections are seen to be small, if compared to the values obtained for photodissociation through the which are several orders of magnitude larger for the same wavelength range (Weck et al., 2002a). This could be expected since the bound states of the and electronic states largely overlap, i.e., the sum of the Franck-Condon factors over all the upper vibrational levels is close to unity as originally pointed out by Kirby et al. (1979). Since the photodissociation cross sections are very small, a sum rule with rotational resolution has also been proposed as a check on the accuracy of our numerical calculations and is presented in the Appendix. On the other hand, some interesting qualitative features are observed, such as nearly periodic nodes and antinodes. This reflects the strongly oscillating behaviour of the continuum wave functions, since the dipole transition moment decreases monotonically to zero as the internuclear separation increases. It is also worth noting the presence of shape resonances generated by predissociation of quasi-bound rotational levels near threshold. The magnitude of such resonances can reach several decades, as can be seen for , the topmost rotational level for .
Partial cross sections for transitions from vibrational levels , 4, 8 and 11 with the rotational quantum number of the electronic state are presented in Figure 2. As can be seen in the previous figure, the threshold limit extends to larger wavelengths as and/or increase, corresponding to a decrease in the amount of energy necessary to reach the dissociation limit. In this connection, it is worth mentioning that the cross section value at threshold increases significantly with the vibrational quantum number . This may be explained by the fact that the broad maximum of the continuum wave function near the left turning point overlaps with the dipole transition moment over a wider range of internuclear distances.
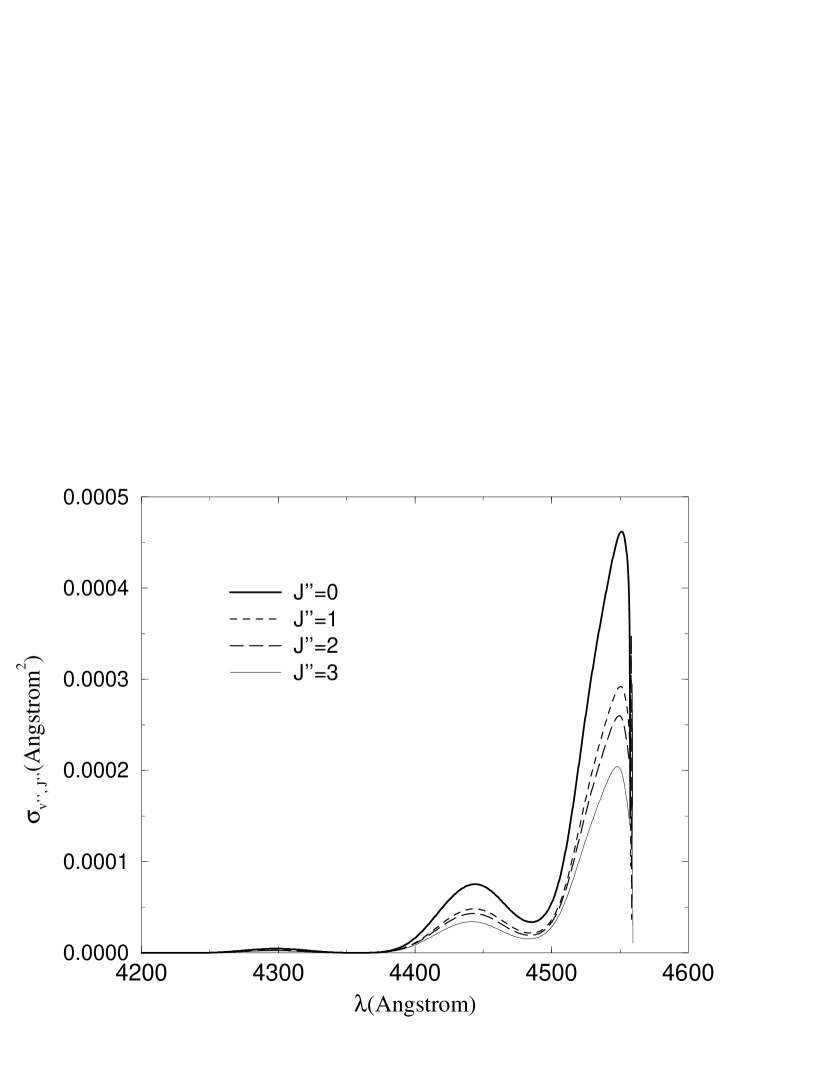
Figure 3 shows the partial cross sections for transitions from the topmost vibrational level with the rotational quantum numbers , 1, 2 and 3 of the electronic state. Few qualitative differences are observed between the maximum rotational number and . In fact, in the case of such high-lying vibrational states, the spacing between all the rotational levels is small, thus resulting in few diferences between their respective wave functions which sample almost the same potential region.
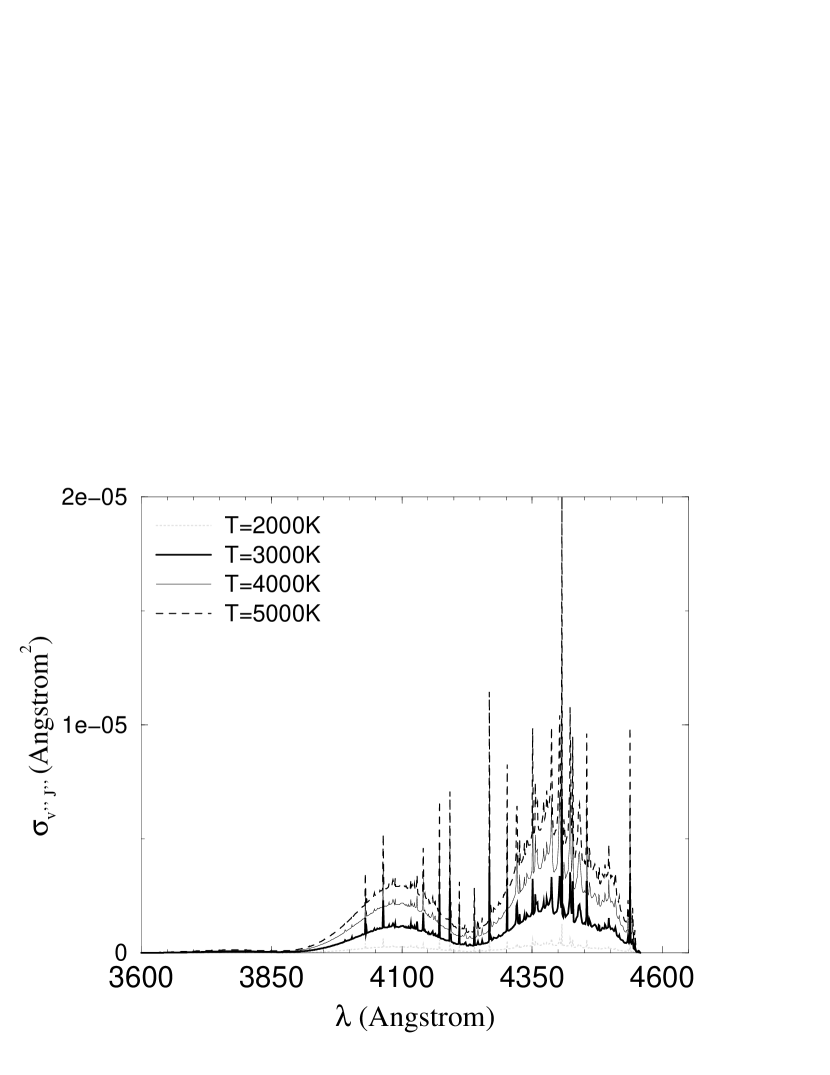
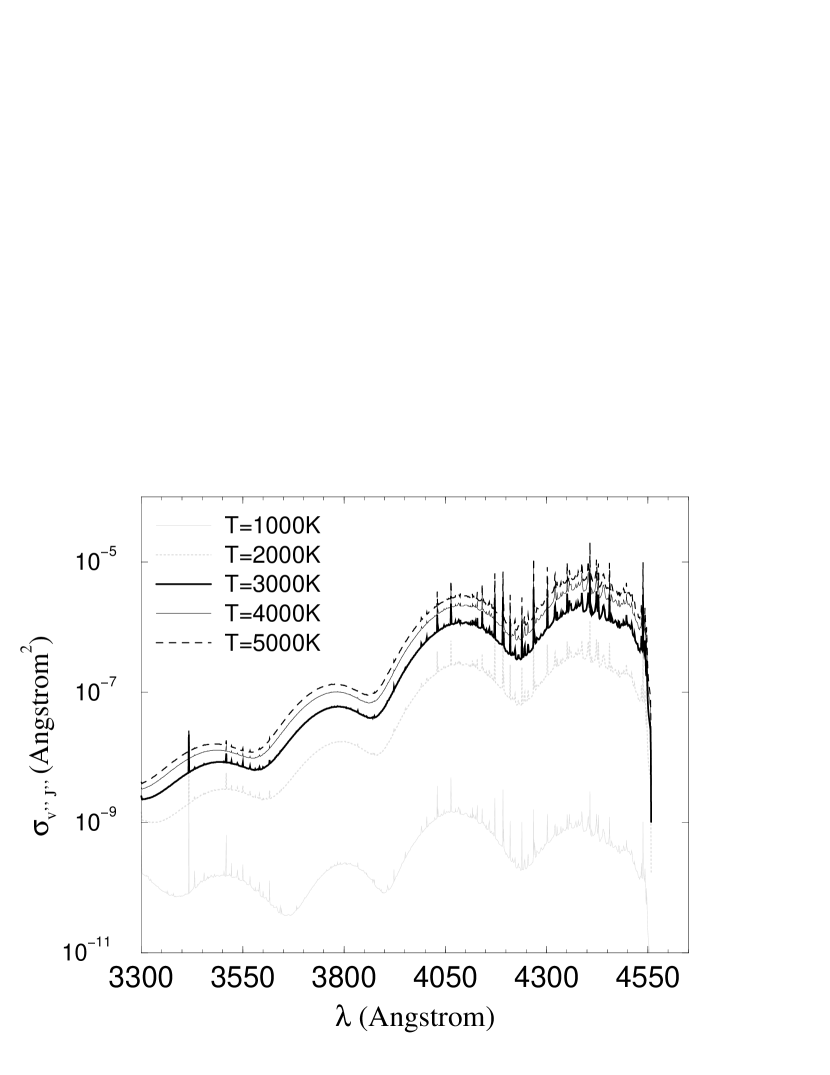
Assuming a Boltzmann population distribution of the rovibrational levels of the electronic ground state , the LTE photodissociation cross section as a function of the wavelength is shown in Figure 4 for temperatures between and 5000 K. The LTE cross section shows strong shape resonances, arising from rotational predissociation of quasi-bound levels near thresholds, as was observed previously for the partial cross sections represented in Figure 1. The cross section exhibits two broad peaks centered around and Å, respectively. Two broad peaks were also observed for the LTE cross sections, but centered near 2780 Å and 3800 Å , with a mininum at 3200 Å (Weck et al., 2002a). For the transition, the relative minimum observed around Å appears to be the result of a node common to most of the high-lying vibrational states, whose partial cross sections strongly contribute to the LTE photodissociation cross section. This feature is clearly illustrated in Figure 2 for the vibrational levels and on the wavelength range Å, where the LTE cross section shows maxima. Let us note that the LTE cross sections increase with temperature, as expected, since more high-lying rovibrational states with lower thresholds are occupied at high temperature.
3.1 Atmosphere Models
The models used for this work were calculated as described in Allard et al. (2001). These models and their comparisons to earlier versions are the subject of a separate publication Allard et al. (2001) and we thus do not repeat the detailed description of the models here. However, we will briefly summarize the major physical properties. The models are based on the Ames H2O and TiO line lists by Partridge & Schwenke (1997) and Schwenke (1998) and also include as a new addition the linelists for FeH by Phillips & Davis (1993) and for VO and CrH by R. Freedman (NASA-Ames, private communication). The models account for equilibrium formation of dust and condensates and include grain opacities for 40 species. In the following, the models will be referred to as “AMES-dusty” for models in which the dust particles stay in the layers in which they have formed and “AMES-cond” for models in which the dust particles have sunk below the atmosphere from the layers in which they originally formed. We stress that large uncertainties persist in the water opacities for parts of the temperature range of this work (Allard et al., 2000). However, the MgH bound-free transitions are in the optical and only slightly affected by the quality of the water opacities.
In addition to the opacities sources listed above and in Allard et al. (2001, and references therein) we added the new photodissociation opacity sources from this work and from Weck et al. (2002a) to our opacity database. In order to assess the effects of the new MgH photodissociation data, we compare spectra calculated with and without these opacity sources. The original AMES grid was calculated for effective temperatures of M, L and T dwrafs. The hotter models in this work are based on the same physics as the AMES grid and merely differ in the effective temperature. The models used in the following discussion were all iterated to convergence for the parameters indicated. The high resolution spectra which have the individual opacity sources selected are calculated on top of the models. The MgH photodissociation data turned out to be too weak to influence the temperature structure of the atmosphere.
We calculated models with log()=5.0 and effective temperatures of 2000 K, 3000 K, and 4000 K as typical M and L dwarf parameters. To test if MgH is the missing opacity found by Short & Lester (1994, 1996), we calculated spectra with log()=4.5 and =5800 K (as a model to be close to a solar model) and with log()=1.5 and =3900 (as a typical K giant). We found changes in all spectra of typically less then 2% when including the MgH photodissociation data. This is demonstrated in Figure 5 where the relative flux differences are shown. As can be seen, only the resonant dissociation transitions are strong enough to be visible. This is true for both the AMES-Dusty and AMES-Cond models although the absolute flux changes are smaller in the AMES-Dusty model since there is less flux in the optical due to strong dust opacity. The differences in the solar model are of the order of the numerical accuracy. We also tested a model with metallicity (=3000 K and log()=5.0) and found the effect due to the bound-free opacities to be practically unchanged compared to the models with solar abundances.
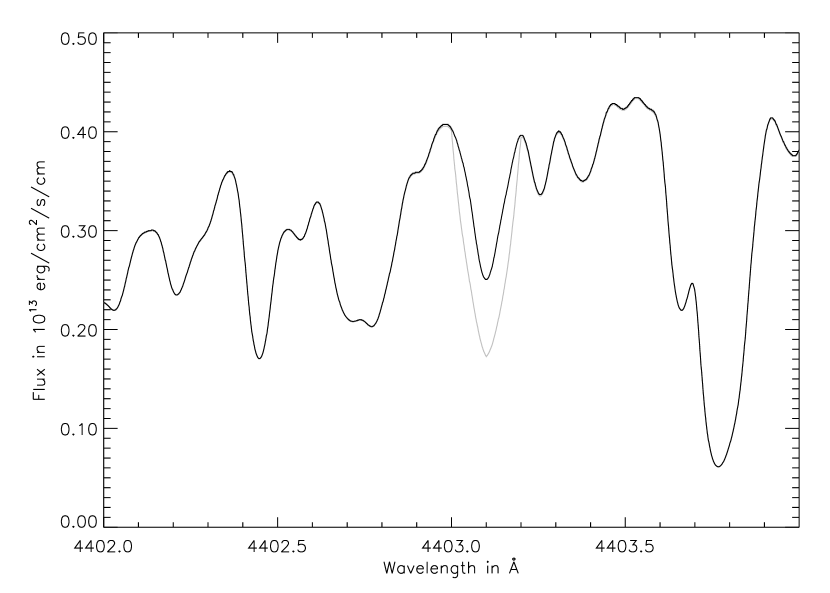
In Figure 6 we show very high resolution synthetic spectra in the region of the strongest resonance with and without MgH bound-free data for the model with =3000 K. The feature is due to photodissociation from the and levels of the state to quasi-bound levels of the state. However, the calculated wavelength of 4403 Å is uncertain due to uncertainties in the long-range behavior of both the and potential energy curves.
4 Conclusion
Photodissociation cross sections have been calculated for the transition of 24MgH for all rotational transitions from the vibrational levels and over the accessible wavelength range Å. As predicted earlier by Kirby et al. (1979), using the Franck-Condon picture, photodissociation cross sections through the are several orders of magnitude smaller than through the pathway. However, interesting features such as a large number of shape resonances, arising from rotational predissociation near thresholds, appear in the LTE photodissociation cross sections calculated for temperatures between 1000 and 5000 K using a Boltzmann distribution of the rovibrational levels of the state. Inclusion of the 24MgH and photodissociation cross sections in atmosphere models of cool stars results in only minor changes of the computed spectra. Though it does not explain the missing opacity found by Short & Lester (1994, 1996), the MgH bound-free opacities will have to be considered for the analysis of high resolution spectroscopy at high S/N. Further, as MgH is a trace molecule, the opacity due to photodissociation may be more significant for molecules with larger abundances such as H2O.
Appendix A Appendix
As a check on the accuracy of our numerical calculations, the sum rule for vibrational matrix elements proposed by Stephens & Dalgarno (1972) is extended to rotational resolution. If is a complete set of discrete, bound rovibrational wave functions and energy normalized continuum wave functions , and an operator, then, from the equality case of the Schwarz inequality, we obtain
| (A1) |
with, for transitions between bound states of the and electronic states,
| (A2) | |||||
and, for transitions from bound states of the electronic state to continuum states of the electronic state,
| (A3) | |||||
where we have introduced the Hönl-London factors , and defined in equation (5) for the -, - and -branches, respectively.
For absorption from the rotational levels of the vibrational state, the sum rule, using the photodissociation cross section presented here and the bound-bound oscillator strengths of Weck et al. (2002b), was satisfied to within an error of for () up to a maximum error of for the highest-lying rotational level, (). As the vibrational and rotational quantum numbers of the ground electronic state increase, the error increases, for example, with errors of for and () and for the topmost rotational level of , ().
As a remark, let us note that the present sum rule is aimed at checking the accuracy of the numerical calculations and in no way reflects the validity of the potential surfaces and the dipole transition moment.
References
- Allard et al. (2001) Allard, F., Hauschildt, P. H., Alexander, D. R., Tamanai A., & Schweitzer, A. 2001, ApJ, 556, 357
- Allard et al. (2000) Allard, F., Hauschildt, P. H., & Schweitzer, A. 2000, ApJ, 539, 366
- Balfour & Cartwright (1976) Balfour, W. J., & Cartwright, H. M. 1976, A&AS, 26, 389
- Balfour & Lindgren (1978) Balfour, W. J., & Lindgren, B. 1978, Can. J. Phys. , 56, 767
- Cooley (1961) Cooley, J. W. 1961, Math. Computation, 15, 363
- Hauschildt & Baron (1999) Hauschildt, P. H., & Baron, E. 1999, J. Comp. App. Math., 102, 41
- Jørgensen et al. (2001) Jørgensen, U. G., Jensen, P., Sørensen, G. O., & Aringer, B. 2001, A&A, 372, 249
- Kirby et al. (1979) Kirby, K., Saxon, R. P., & Liu, B. 1979, ApJ, 231, 637
- Kurucz, van Dishoeck, & Tarafdar (1987) Kurucz, R. L., van Dishoeck, E. F., & Tarafdar, S. P. 1987, ApJ, 322, 992
- Partridge & Schwenke (1997) Partridge, H., & Schwenke, D. W. 1997, J. Chem. Phys., 106, 4618
- Phillips & Davis (1993) Phillips, J. G., & Davis S. P. 1993, ApJ, 409, 860
- Saxon et al. (1978) Saxon, R. P., Kirby, K., & Liu, B. 1978, J. Chem. Phys., 12, 5301
- Schwenke (1998) Schwenke, D. W. 1998, Chemistry and Physics of Molecules and Grains in Space. Faraday Discussion, 109, 321
- Short & Lester (1994) Short, C. I. & Lester, J. B. 1994, ApJ, 436, L165
- Short & Lester (1996) —–, 1996, ApJ, 469, 898
- Stephens & Dalgarno (1972) Stephens, T. L., & Dalgarno, A. 1972, J. Quant. Spectrosc. Radiat. Transfer., 12, 569
- Weck et al. (2002a) Weck, P. F., Stancil, P. C., & Kirby, K. 2002a, ApJ, submitted
- Weck et al. (2002b) Weck, P. F., Schweitzer, A., Stancil, P. C., Hauschildt, P. H., & Kirby, K. 2002b, ApJ, submitted
- Whiting & Nicholls (1974) Whiting, E. E. & Nicholls, R. W. 1974, ApJS, 27, 1