On the heating source of the Orion KL hot core
Abstract
We present images of the J=10–9 rotational lines of HC3N in the vibrationally excited levels 1v7, 1v6 and 1v5 of the hot core (HC) in Orion KL. The images show that the spatial distribution and the size emission from the 1v7 and 1v5 levels are different. While the J=10–9 1v7 line has a size of and peaks NE of the 3 mm continuum peak, the J=10–9 1v5 line emission is unresolved () and peaks south of the 3 mm peak. This is a clear indication that the HC is composed of condensations with very different temperatures (170 K for the 1v7 peak and K for the 1v5 peak). The temperature derived from the 1v7 and 1v5 lines increases with the projected distance to the suspected main heating source I. Projection effects along the line of sight could explain the temperature gradient as produced by source I. However, the large luminosity required for source I, L⊙, to explain the 1v5 line suggests that external heating by this source may not dominate the heating of the HC. Simple model calculations of the vibrationally excited emission indicate that the HC can be internally heated by a source with a luminosity of L⊙, located SW of the 1v5 line peak ( south of source I). We also report the first detection of high-velocity gas from vibrationally excited HC3N emission. Based on excitation arguments we conclude that the main heating source is also driving the molecular outflow. We speculate that all the data presented in this letter and the IR images are consistent with a young massive protostar embedded in an edge-on disk.
1 Introduction
Located at only 450 pc from the sun, the Orion KL region has been the prototype source to study the formation of high mass stars. This region shows all the signatures of massive star formation. It contains a plethora of IR cores () (Dougados et al., 1993; Gezari et al., 1998), H2O masers (Genzel et al., 1981; Gaume et al., 1998), millimeter continuum emission (Plambeck et al., 1995; Blake et al., 1996), compact radio sources (Churchwell et al., 1987; Menten and Reid, 1995), and molecular hot cores and fast molecular outflows (Blake et al., 1996; Wright et al., 1996; Chandler and Wood, 1997; Rodríguez-Franco et al., 1999b).
It is believed that most of the IR sources in the Orion KL nebula are not self luminous but show reprocessed emission escaping through inhomegeneities of the dense material surrounding a deeply embedded source. Recently, Menten and Reid (1995) and Gezari et al. (1998) proposed that the main heating source in the region is radio source I. The lack of an IR counterpart to source I has led some authors to invoke large intrinsic foreground extinction towards source I. However, Blake et al. (1996),Wright et al. (1996) and Chandler and Wood (1997) have shown that the dust and molecular peak emission, coincide neither with radio source I nor with IRc2. The main peak of continuum emission at 1.3 mm, is east from source I. Furthermore, based on the distribution of the HC3N J=24–23 line in the 1v7 vibrationally excited state, Blake et al. (1996) have proposed that source I is the dominant energy source in the region, and that there is no evidence of internal heating within the molecular hot core (HC). However, Kaufman et al. (1998) based on a model for the heating of the HC concluded that it is internally heated by young embedded stars.
In this letter we investigate the thermal structure of the Orion KL HC by using the J=10–9 rotational line of HC3N in the vibrational excited levels 1v7, 1v6 and 1v5. If the hot core material is not internally heated and source I is the main heating source one would expect the emission from the HC3N rotational lines in the vibrational states (hereafter HC3N*) with larger excitation energy to peak close to source I. We find that the emission of the HC3N J=10–9 lines in the different vibrational levels peak at different positions indicating that the HC is internally heated.
2 Observations
We performed 3 snapshots of the Orion KL HC with three antennas of the IRAM Plateau de Bure Interferometer (PdBI) for the following hour angle ranges: (-2.9,1.8), (-3.4,-1.0) and (1.1,2.3). The instrumental parameters for these observations have been described by de Vicente et al. (2000). These observations were made with the C1 and Dc configurations and the 500 MHz IF band was centered at 91.2 GHz in order to measure simultaneously the HC3N J=10–9,1v5,1f, J=10–9,1v6,1e, J=10–9,1v7,1e and J=10–9,1v7,1f transitions. The half power size of the synthesized beam was 6.6′′3.8′′ PA: 2o. We used the sources 3C111 (3.8 Jy) and 0458-020 (1.8 Jy) as flux density and phase calibrators and 3C454.3 as bandpass calibrator.
3 Results
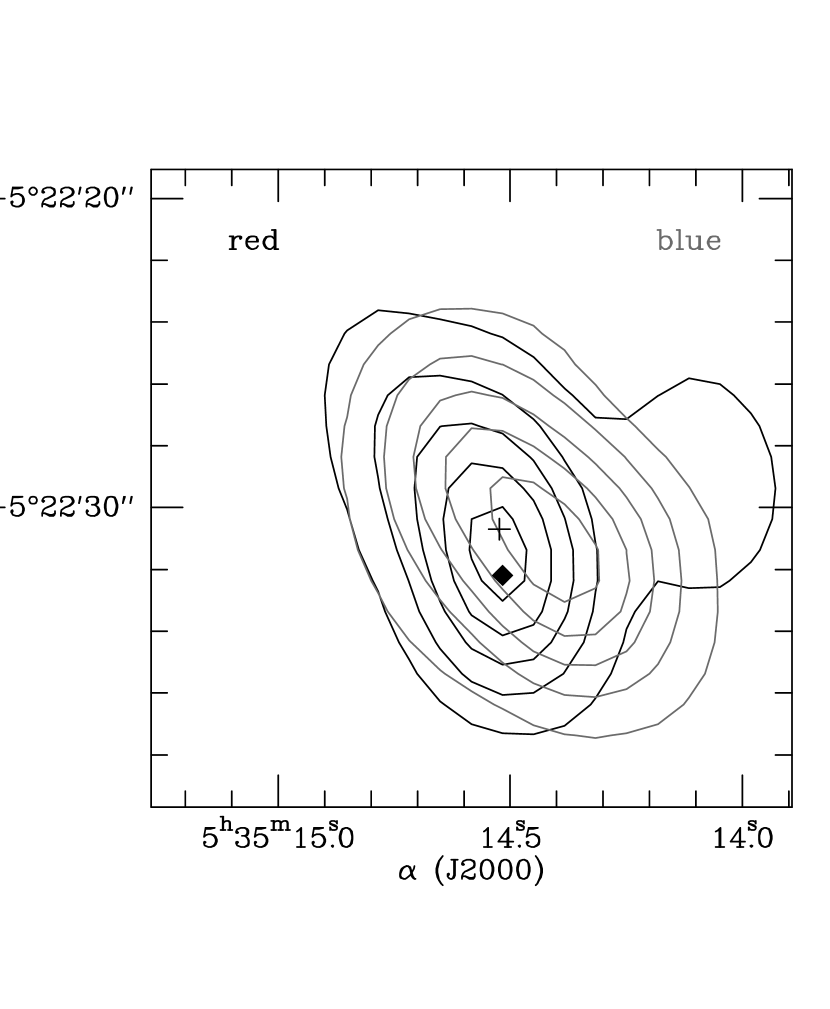
All the observed vibrationally excited lines have been detected. Figs. 1a and 1b show the spatial distribution of the HC3N J=10–9 1v7,1f and 1v5,1f transitions (hereafter 1v7 and 1v5 lines respectively) towards Orion KL. The maps represent the integrated intensity of the 1v7 and 1v5 lines for the main gaussian line (velocity interval from 3.5 to 7.7 kms-1) where the 1v5 line is detected. The most remarkable result is the different locations of the 3 mm continuum peak and those of the 1v7 and of the 1v5 lines. While the 1v7 line peaks NE of the 3 mm peak (a cross in Fig. 1), the 1v5 line peaks south of it. Since both lines and the continuum were observed simultaneously and in the same receiver band, the separations between the 1v7, 1v5 and the continuum peaks are not due to instrumental effects. From the signal to noise ratio () the uncertainty in the relative positions will be smaller than (Plambeck et al., 1995). Plambeck et al. (1995) have measured that source I is located west of the 3mm continuum peak. Since our data do not resolve source I, in the following we will consider that the uncertainty in the relative position between the 3mm continuum peak and I is . Then the separation between source I and the 1v5 peak is .
High angular resolution images in several molecular species show that the HC breaks into a number of clumps with different radial velocities and also likely at different distances from source I (Migenes et al. 1989; Blake et al. 1996; Chandler & Wood 1997). The 1v7 and the 1v5 peaks can be identified with clumps observed in other molecular species in the higher resolution images. The 1v7 and 1v5 peaks clearly appear in the high angular resolution () image of the dust emission at 1.3 mm (Blake et al., 1996) and the CS emission (Chandler and Wood, 1997). Our data show that the molecular HC is composed of molecular clumps with quite different physical conditions. In the following we will refer to HC1 and HC2 as the 1v5 and 1v7 peaks respectively. The 1v7 emission is extended with a deconvolved size of (PA: 16∘), in good agreement with the data from Blake et al. (1996). On the other hand, the emission from the 1v5 line is unresolved with a deconvolved size of (PA: -4∘).
Fig. 1c shows the spectra of the 1v7 and the 1v5 lines towards HC2 and at Tmax, the position of maximum temperature where the ratio between the 1v5 and 1v7 lines peaks. The 1v5 line shows a single gaussian profile centered at a radial velocity of 4.10.5 kms-1 and a linewidth of 7.00.2 kms-1, i.e the typical parameters for the Orion KL HC material. The linewidth of the 1v5 line towards Tmax is similar to that of the CS clump “located” south of source I (Chandler and Wood, 1997), indicating that the excitation of the molecular gas in the HC increases towards the south of source I. The 1v7 lines also show the gaussian profile of the 1v5 line but superimposed on a broad pedestal of high-velocity gas. Although high-velocity wings in the HC3N emission have been reported by Rodriguez-Franco et al. (1992), this is the first detection of high-velocity gas in HC3N*. Figure 2 shows the spatial distribution of the high velocity blueshifted (-5 to 1 kms-1) and redshifted (11 to 17 kms-1) 1v7 emission together with the location of the 3mm peak (cross) and HC1 (filled diamond). The high-velocity emission shows a weak bipolar structure around I/HC1. The bipolarity is in the same sense that the large scale molecular outflow observed in CO (Wilson et al., 1986). Very likely, the high-velocity gas detected in the 1v7 line is associated with the large bipolar outflow. With our angular resolution it is difficult to distinguish the powering source (HC1 or I) of the high velocity gas. As dicussed in section 5 the most likely powering source is also the heating source of HC1.
4 Physical conditions of the molecular gas
Fig. 1 shows that the ratio between the 1v5 and the 1v7 lines is different for HC1, HC2 and the high velocity gas. One can use the intensities of the vibrationally excited lines to estimate the excitation temperature of the molecular gas, using the Boltzmann equation. Assuming optically thin emission ( for the 1v7 line, see Rodriguez-Franco et al. (1992) for the ground state line), we derive excitation temperatures for HC1, HC2 and the high-velocity gas of, 230, 170 and 150 K respectively. The excitation temperature of 230 K derived for HC1 must be considered a lower limit because the contribution from HC2 dominates the 1v7 emission in HC1. In fact, this excitation temperature is smaller than the 330 K derived from high angular resolution images of the ground state and the 1v7 line (Wright et al., 1996).
The typical error in the excitation temperature is 15%. For the excitation temperatures derived above, the HC3N column densities for source sizes of are and for HC1 and HC2 respectivey, and and for the high velocity gas (red and blue wings respectively).
We can estimate the abundance of HC3N in the hot cores from our HC3N column density and the H2 column density obtained by integrating the continuum emission for a source size of . Combining our continuum emission at 3.4 mm with the integrated continuum emission at 1.3 mm of Blake et al. (1996) and considering a dust temperature of 200 K, similar to that of the HC3N excitation temperature, we obtain an H2 column density of for HC1 and for HC2. We obtain an HC3N abundance of in the hot cores. The HC3N abundance in the high velocity gas is more difficult to derive. This is because the line emission from other molecules in the velocity range of the HC3N* high velocity gas, is strongly contaminated by the emission of the ambient gas (Martin-Pintado et al., 1990).
5 On the excitation of the HC3N lines
As discussed by de Vicente et al. (2000) and references therein, the HC3N* vibrational levels are excited by IR emission at wavelengths between 14 and 48 m. This is because the H2 densities of required for the collisional excitation are at least two orders of magnitude larger than the typical densities estimated for the Orion HC. In this case of radiative excitation, the excitation temperatures derived from the vibrationally excited lines are a good estimate of the dust temperatures within the HC because the continuum emission from HC1 and HC2 at the wavelengths of the vibrational transitions 1v7, 1v6 and 1v5 is optically thick (opacities larger than 10). For the sizes and the dust temperatures obtained above we derive luminosities of L⊙ and L⊙ for HC1 and HC2 respectively.
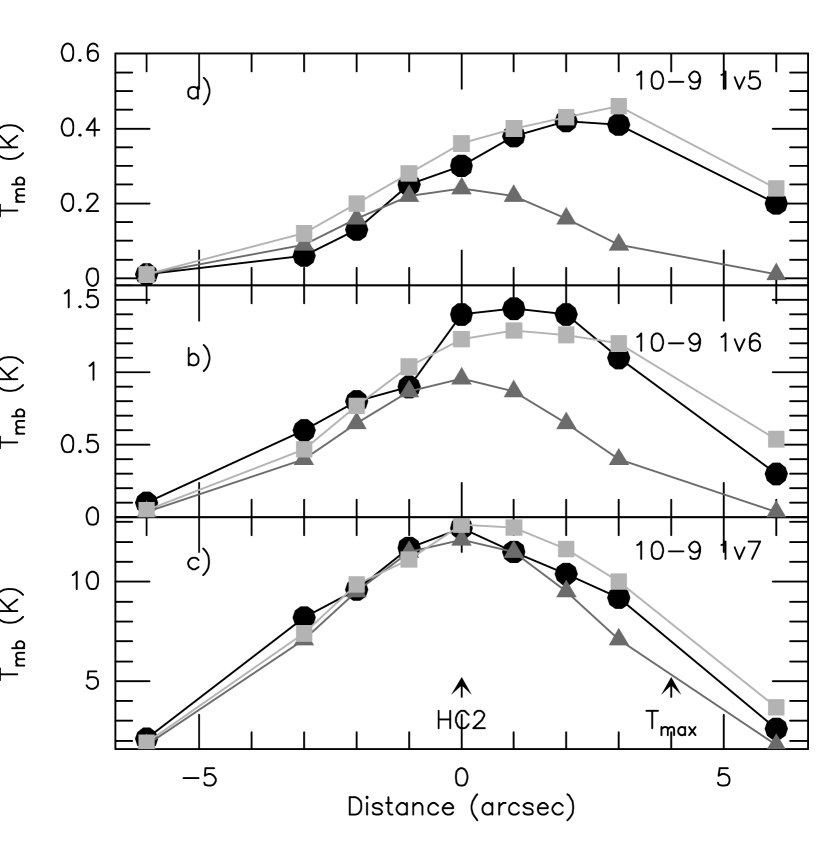
The luminosity and the location of the possible embedded IR sources heating HC1 and HC2 can be better estimated by modeling the excitation and the transfer of the 1v7, 1v6 and 1v5 lines in Orion KL. We have used the model developed by de Vicente et al. (2000) which considers IR excitation of the vibrational levels with a radiation temperature derived from the dust temperature profile obtained by Kaufman et al. (1998) for the Orion HC. In the inner part of the HC, the dust is optically thin at the wavelengths of the vibrational transitions and the IR radiation temperature differs from the dust temperature. To account for this effect, we have considered as the inner radius the location at which the dust optical depth at the frequency of the 1v5 transition is equal to unity.
We have considered two cases (parameters are summarized in Table 1): 1) one IR source located at the position of HC2 and 2) two IR sources, one located in Tmax and the other in HC2.
Figs. 3a, 3b and 3c show, respectively, the spatial distribution of the emission predicted by the model for the 1v5, 1v6 and 1v7 lines in a NE-SW cut for one IR source (filled triangles) and two IR sources (filled squares) superposed on the observed intensities (filled circles). The main conclusion from Fig. 3 is that an IR source with a moderate luminosity of L⊙ could only fit the line intensity and spatial distribution of the 1v7 line (panel b).
The 1v5 and 1v6 line distributions requires the presence of a another source located close to HC1. One can reasonably fit the 1v5 and 1v6 lines by considering a second IR source located SW of HC1 with a total luminosity of L⊙ but with a lower column density of hot material than in HC2 (see fig. 3a). This is in agreement with the results of Kaufman et al. (1998) for the proposed scenario of internal heating. In summary, the HC3N* emission shows that one of the most luminous embedded IR sources ( L⊙) in the Orion KL region must be located in the HC SW of HC1; ie. south of source I.
Since IR radiation is also required for the excitation of the HC3N* bipolar outflow, the high velocity material must be located very close and likely driven by the most luminous source in the HC, i.e HC1. In fact, the HC3N* high velocity gas would trace the material just being accelerated in the region where the molecular outflow originates. The picture emerging from all the HC3N* data is that the main heating source, located close to HC1, should also drive the molecular bipolar outflow.
6 Discussion
The origin of the heating of the HC and of the driving source of the molecular outflow in Orion KL has been the subject of debate during the last 10 years and it is not settled yet. IRc2 and later source I have been the most likely candidates. Kaufman et al. (1998) have studied the heating of the HC by source I and conclude that the HC is internally heated by young stars. The detection of the largest excitation temperature derived from the 1v5/1v7 ratio, located south of source I, also suggests that this source might not be the main heating source. One could consider that the excitation temperature gradient can be due to projection effects and that HC1 is closer to source I than HC2. In this case, the minimum separation between the 1v5/1v7 maximum and source I would be the projected distance; ie 1000 AU. In order to externally heat the H2 column densities of HC1 of up to temperatures of 230 K, source I should have a luminosity of (Kaufman et al., 1998). This is larger than the total luminosity of the KL region (Werner et al., 1976). Heating of HC1 by the combination of sources I and n will not substantially change the required total luminosity of source I since source n is considered to be less luminous than source I and is located at the same projected distance from HC1 as source I. IR radiation from the shocks generated in the molecular outflows can be ruled out since the mechanical luminosity of the outflow is only (Rodríguez-Franco et al., 1999a). We conclude that the most likely explation for the heating of HC1 is internal heating by young embedded stars. The lack of radio emission from HC2 might be an indication of mass accretion (Walmsley, 1995).
The high luminosity ( L⊙) IR source heating HC1 is, like source I, a very weak emitter at 20m. The 1v5 line emission is anticorrelated with the IR emission at 20m measured by Gezari et al. (1998) with resolution. The morphology of the IR emission is possibly influenced by foreground extinction (Wright et al., 1996), and HC1 can be obscured by the presence of foreground cold material. From the parameters in Table 1 for Tmax, the expected flux density within at 20m from HC1 should be Jy, a factor of larger than the observed flux. To match the observed and predicted fluxes within , the IR source in HC1 must be hidden behind 6 magnitudes of extinction at 20 m, i.e. an H2 column density of . As expected, the cold gas in front of the IR source not observed in the HC3N* lines is 20% of the HC1 total column density of , derived from the dust continuum emission (Blake et al., 1996) also measured with resolution. Then, the IR map at 20 m seems to be consistent with our estimates for the luminosity of the IR source embedded in HC1.
Source I is the driving source of the SiO outflow, but is located just outside the HC. Furthermore, the molecular outflow observed in HC3N* seems to be driven by the IR source in HC1. These facts suggest, as proposed by Rodríguez-Franco et al. (1999a), that the Orion KL region contains multiple molecular outflows.
The data presented in this paper, the presence of a high luminosity IR source embedded in HC1 powering the high-velocity gas observed in HC3N* emission and the properties of the IR emission in the Orion KL region (morphology, luminosity and polarization) can be explained in the scenario of a young massive star deepely embbeded in molecular material (Plambeck et al., 1982). The circumstellar material must be very anisotropic since it is located in the narrow ridge of minimum IR emission with strong molecular line emission and has large column densities along the line of sight. Although our angular resolution is not enough to resolve the circumstellar material, the most likely morphology is that of an edge-on disk. The circumstellar material is internally heated by young massive protostars with a luminosity of L⊙. The IR radiation heats the most inner parts giving rise to the emission observed in HC3N*. The IR radiation escapes in the direction of the lowest column densities (perperdicular to the ridge) illuminating most of the IR sources as shown by the polarization vectors which point towards a location in the vicinity of HC1 (Werner et al., 1983). The massive protostar drives the large molecular outflow observed in CO that is collimated by the circumstellar material. The material very close to the IR source where the mass ejection originates is observed as high velocity wings in HC3N*.
This work has been partially supported by the Spanish Ministerio de Ciencia y Tecnologia grant ESP-4519-PE and SEPCT grant AYA2000-927. We want to thank the anonymous referees for their constructive comments which helped to improve substantially the original version of this letter.
References
- Blake et al. (1996) Blake, G. A., Mundy, L. G., Carlstrom, J. E., Padin, S., Scott, S. L., Scoville, N. Z., and Woody, D. P., 1996, ApJ472, L49
- Chandler and Wood (1997) Chandler, C. J. and Wood, D. O. S., 1997, MNRAS287, 445
- Churchwell et al. (1987) Churchwell, E., Felli, M., Wood, D. O. S., and Massi, M., 1987, ApJ321, 516
- de Vicente et al. (2000) de Vicente, P., Martín-Pintado, J., Neri, R., and Colom, P., 2000, A&A361, 1058
- Dougados et al. (1993) Dougados, C., Lena, P., Ridgway, S. T., Christou, J. C., and Probst, R. G., 1993, ApJ406, 112
- Gaume et al. (1998) Gaume, R. A., Wilson, T. L., Vrba, F. J., Johnston, K. J., and Schmid-Burgk, J., 1998, ApJ493, 940+
- Genzel et al. (1981) Genzel, R., Reid, M. J., Moran, J. M., and Downes, D., 1981, ApJ244, 884
- Gezari et al. (1998) Gezari, D. Y., Backman, D. E., and Werner, M. W., 1998, ApJ509, 283
- Kaufman et al. (1998) Kaufman, M. J., Hollenbach, D. J., & Tielens, A. G. G. M. 1998, ApJ497, 276.
- Martin-Pintado et al. (1990) Martin-Pintado, J., Rodriguez-Franco, A., & Bachiller, R. 1990, ApJ, 357, L49
- Menten and Reid (1995) Menten, K. M. and Reid, M. J., 1995, ApJ445, L157
- Plambeck et al. (1982) Plambeck, R. L., Wright, M. C. H., Welch, W. J., Bieging, J. H., Baud, B., Ho, P. T. P., & Vogel, S. N. 1982, ApJ, 259, 617
- Plambeck et al. (1995) Plambeck, R. L., Wright, M. C. H., Mundy, L. G., and Looney, L. W., 1995, ApJ455, L189
- Rodriguez-Franco et al. (1992) Rodriguez-Franco, A., Martin-Pintado, J., Gomez-Gonzalez, J., & Planesas, P. 1992, A&A, 264, 592
- Rodríguez-Franco et al. (1998) Rodríguez-Franco, A., Martín-Pintado, J., & Fuente, A. 1998, A&A, 329, 1097
- Rodríguez-Franco et al. (1999a) Rodríguez-Franco, A., Martín-Pintado, J., & Wilson, T. L. 1999a, A&A, 351, 1103
- Rodríguez-Franco et al. (1999b) Rodríguez-Franco, A., Martín-Pintado, J., & Wilson, T. L. 1999b, A&A, 344, L57
- Walmsley (1995) Walmsley, M. 1995, Revista Mexicana de Astronomia y Astrofisica Conference Series, 1, 137
- Werner et al. (1976) Werner, M. W., Gatley, I., Becklin, E. E., Harper, D. A., Loewenstein, R. F., Telesco, C. M., & Thronson, H. A. 1976, ApJ, 204, 420.
- Werner et al. (1983) Werner, M. W., Capps, R. W., & Dinerstein, H. L. 1983, ApJ, 265, L13
- Wilson et al. (1986) Wilson, T. L., Serabyn, E., & Henkel, C. 1986, A&A, 167, L17
- Wright et al. (1996) Wright, M. C. H., Plambeck, R. L., and Wilner, D. J., 1996, ApJ, 469, 216+

| Parameter | HC2 | Tmax |
|---|---|---|
| Luminosity (L⊙) | ||
| n(H2) (cm-3, cm) | ||
| HC3N line width (kms-1) | 6 | 6 |
| HC3N abundance | ||
| Source size depth (arcsec) | 15 | 4 |
| Source size width (arcsec) | 4 | 4 |
| HPBW (arcsec) | 4 | 4 |
| Offset of source 1 from 2 (arcsec) | 4 |