11email: emmanuel.lellouch@obspm.fr 22institutetext: I.R.A.M. 300, av. de la Piscine, F-38406 St-Martin d’Hères Cedex, France 33institutetext: Instituto de Astrofísica de Andalucia, CSIC,Camino Bajo de Huetor 24, E-18080 Granada, Spain 44institutetext: I.R.A.M. Avda. Divina Pastora 7, E-18012 Granada, Spain 55institutetext: Centro de Astronomia e Astrofísica da Universidade de Lisboa, PT-1349-018 Lisboa, Portugal
Coordinated thermal and optical observations of Trans-Neptunian object (20000) Varuna from Sierra Nevada
We report on coordinated thermal and optical measurements of trans-Neptunian object (20000) Varuna obtained in January-February 2002, respectively from the IRAM 30-m and IAA 1.5 m telescopes. The optical data show a lightcurve with a period of 3.1760.010 hr, a mean V magnitude of 20.370.08 and a 0.420.01 magnitude amplitude. They also tentatively indicate that the lightcurve is asymmetric and double-peaked. The thermal observations indicate a 1.120.41 mJy flux, averaged over the object’s rotation. Combining the two datasets, we infer that Varuna has a mean 1060 km diameter and a mean 0.038 V geometric albedo, in general agreement with an earlier determination using the same technique.
Key Words.:
Kuiper belt – Planets and satellites: general – Techniques: photometric – Submillimeter1 Introduction
Our view of the outer Solar System has changed dramatically over the last decade, with the discovery of hundreds of objects beyond Neptune’s orbit. These trans-Neptunian objects (TNOs), which can be classified in three dynamical groups from their orbital properties, are believed to have formed in the tenuous outskirts of the protoplanetary disk, and to have remained relatively unaltered since then (e.g. Jewitt & Luu 2000). As such, and since they are also thought to be the source of short-period comets (Duncan et al. 1988), these bodies are currently the subject of considerable interest. Because of their intrinsic faintness, however, the physical and chemical properties of TNOs are difficult to study. For most of them, physical observations are restricted to broad-band photometry, providing magnitudes, colors, and rotation periods (e.g. Doressoundiram et al. 2001, 2002). Only for a few of them have infrared spectra been acquired, with compositional diagnostics.
Among this population, the “classical TNO” (20000)Varuna, discovered in November 2000 under the provisional designation of 2000 WR106 (McMillan & Larsen 2000), has received special attention. Thanks to prediscovery observations dating back to 1955 (Knoffel & Stoss 2000), its orbit is accurately known (to within 0.1 arcsec). With an apparent visual magnitude of about 20.3 (absolute visual magnitude, H= 3.7), it is one of the brightest known TNOs, being as of today surpassed only by (28978)Ixion (H=3.2). Visible photometry indicates that Varuna is moderately red (B-R 1.5) (Jewitt & Sheppard 2002, hereafter JS02; Doressoundiram et al. 2002), and near-IR spectroscopy suggests the presence of water ice bands at 1.5 and 2.0 m (Licandro, Oliva & Di Martino, 2001). Jewitt, Aussel & Evans (2001, hereafter JAE01) reported the detection of Varuna at 850 m from JCMT observations, with a flux of 2.810.85 mJy. From the combination of this thermal emission measurement with simultaneous optical observations, they inferred an equivalent circular diameter of 900 km and a red geometric albedo of pr = 0.070. Shortly after, Farnham (2001) reported that Varuna’s exhibits a rotational lightcurve, with a 0.5 mag amplitude and a single-peaked period of 3.17 hour, although periods of 2.78 and 3.67 hours could not be ruled out. The rotational behaviour of Varuna was extensively investigated by JS02 who reported a two-peaked R lightcurve with period 6.34420.0002 hour and 0.420.02 mag amplitude, and no rotational variations in the visible colors (B-V, V-R, V-I). They concluded that Varuna is probably an elongated, prolate body with a (projected) axis ratio as high as 1.5:1.
We present here additional combined observations of Varuna in the thermal and visible range, performed from two telescopes (IRAM-30m and IAA 1.5m, respectively), located on Pico Veleta, Sierra Nevada (southern Spain). The prime goal was to obtain an independent measurement of Varuna’s thermal flux to confirm the single detection of JAE01. A secondary, more difficult, objective was to search for rotational variability in the thermal flux. Indeed, a positive correlation of the thermal lightcurve with the optical lightcurve would indicate a shape effect (as is possibly the case for Ceres (Altenhoff et al. 1996) and Vesta (Redman et al. 1992)), while anticorrelation is the manifestation of albedo markings (an example is Pluto, Lellouch et al. 2000a). Unfortunately, our thermal observations did not prove of sufficient quality for this goal.
2 Observations
2.1 Optical observations
Optical observations were carried out at the 1.5m telescope of Sierra Nevada Observatory during a 1-week run in February 2002. Unfortunately, weather conditions allowed observations only in two of the nights (Feb. 8 and 9). The seeing varied from 1.0 arcsec to 1.7 arcsec, with an average of 1.5 arcsec.
The 1.5m telescope was equipped with a fast readout 1024x1024 CCD camera based on a Kodak KAF1001E chip with square 0.41 arcsec pixels and a 77 arcmin field of view. To maximize the signal-to-noise, we did not use any filter. The covered wavelength range is 350-940 m, with maximum sensitivity at 580 nm. Integration times were typically 100 sec, and a S/N of 15 was achieved for most of the images. More than 300 images were obtained and analyzed. Typical drift rates for Varuna (2.2 arcsec/hour in right ascension and 0.3 arcsec/hour in declination) were well below the seeing disc size in our 100-sec exposures. We used a fast readout CCD, whose read noise was still significantly lower than the typical shot noise from the sky background.
The reduction of the data was carried out following a standard processing including average bias subtraction and flatfield correction using high S/N twilight sky flatfields. The DAOPHOT package was used for the synthetic aperture calculations. Several synthetic apertures were tried for the objects and field stars. We adopted obtained the aperture that gave the lowest scatter in the data. It corresponds to a diameter of 8 pixels. This is consistent with the conclusion of Barucci et al. (2000) that optimum photometry is achieved for an aperture a few pixels wider than the full width at half maximum of the star profiles in the worst seeing images. The fraction of flux loss in this relatively small 8-pixel diameter apertures was computed by measuring the percentage of flux loss on the brightest non-saturated stars in the images, and the final results were corrected for this aperture effect. From the dispersion of the data we estimate that the average error of the 100-sec exposures was 0.06 mag, close to theoretical expectations.
Photometry was performed relative to seven field stars, observed within the field of view. The same set of stars was used for the two observing nights. Since our broadband observations do not correspond to any of the photometric Johnson bands, the relative magnitudes were placed in an absolute scale using observations of Landolt standard stars (Landolt 1992) with colors similar to those of Varuna, in order to minimize any uncertainties in the flux calibration that could arise from color effects. The uncertainty in the absolute calibration due to a slight difference in colors is estimated to be 0.08 mag. This source of error dominates the uncertainty in the absolute photometry. All our photometric measurements are listed in Table 1.

| UT a | JD a | mv | UT a | JD a | mv |
|---|---|---|---|---|---|
| Feb. 02 | 2452300+ | Feb. 02 | 2452300+ | ||
| 8.8371 | 14.33712 | 20.241 | 8.9583 | 14.45828 | 20.444 |
| 8.8402 | 14.34020 | 20.251 | 8.9595 | 14.45948 | 20.310 |
| 8.8414 | 14.34139 | 20.254 | 8.9607 | 14.46069 | 20.316 |
| 8.8426 | 14.34259 | 20.306 | 8.9619 | 14.46190 | 20.318 |
| 8.8438 | 14.34381 | 20.271 | 8.9671 | 14.46709 | 20.315 |
| 8.8450 | 14.34500 | 20.241 | 8.9683 | 14.46830 | 20.299 |
| 8.8462 | 14.34622 | 20.224 | 8.9699 | 14.46995 | 20.249 |
| 8.8474 | 14.34743 | 20.252 | 8.9712 | 14.47116 | 20.215 |
| 8.8486 | 14.34863 | 20.315 | 8.9724 | 14.47236 | 20.185 |
| 8.8499 | 14.34985 | 20.185 | 8.9736 | 14.47356 | 20.264 |
| 8.8510 | 14.35105 | 20.248 | 8.9748 | 14.47478 | 20.164 |
| 8.8525 | 14.35253 | 20.309 | 8.9760 | 14.47598 | 20.186 |
| 8.8537 | 14.35374 | 20.226 | 8.9772 | 14.47719 | 20.162 |
| 8.8549 | 14.35494 | 20.210 | 8.9784 | 14.47839 | 20.189 |
| 8.8562 | 14.35617 | 20.140 | 8.9796 | 14.47959 | 20.216 |
| 8.8574 | 14.35737 | 20.270 | 8.9808 | 14.48080 | 20.102 |
| 8.8586 | 14.35860 | 20.216 | 8.9820 | 14.48200 | 20.170 |
| 8.8598 | 14.35980 | 20.191 | 8.9832 | 14.48321 | 20.126 |
| 8.8610 | 14.36101 | 20.181 | 8.9845 | 14.48448 | 20.138 |
| 8.8622 | 14.36221 | 20.195 | 8.9857 | 14.48568 | 20.187 |
| 8.8647 | 14.36473 | 20.268 | 8.9869 | 14.48687 | 20.128 |
| 8.8659 | 14.36594 | 20.206 | 8.9881 | 14.48808 | 20.154 |
| 8.8671 | 14.36714 | 20.184 | 8.9893 | 14.48928 | 20.164 |
| 8.8683 | 14.36834 | 20.139 | 8.9905 | 14.49050 | 20.160 |
| 8.8696 | 14.36955 | 20.167 | 8.9917 | 14.49170 | 20.233 |
| 8.8708 | 14.37076 | 20.194 | 8.9929 | 14.49289 | 20.153 |
| 8.8720 | 14.37197 | 20.236 | 8.9941 | 14.49410 | 20.140 |
| 8.8732 | 14.37317 | 20.164 | 8.9953 | 14.49530 | 20.162 |
| 8.8744 | 14.37438 | 20.171 | 8.9965 | 14.49650 | 20.115 |
| 8.8756 | 14.37559 | 20.245 | 8.9977 | 14.49771 | 20.088 |
| 8.8768 | 14.37679 | 20.152 | 8.9989 | 14.49892 | 20.176 |
| 8.8780 | 14.37800 | 20.299 | 9.0001 | 14.50013 | 20.145 |
| 8.8792 | 14.37920 | 20.193 | 9.0013 | 14.50133 | 20.166 |
| 8.8804 | 14.38042 | 20.163 | 9.0025 | 14.50253 | 20.093 |
| 8.8816 | 14.38162 | 20.239 | 9.0078 | 14.50782 | 20.120 |
| 8.8828 | 14.38282 | 20.214 | 9.0090 | 14.50903 | 20.158 |
| 8.8840 | 14.38403 | 20.271 | 9.0102 | 14.51024 | 20.199 |
| 8.8852 | 14.38523 | 20.282 | 9.0115 | 14.51145 | 20.102 |
| 8.8864 | 14.38644 | 20.280 | 9.0127 | 14.51265 | 20.149 |
| 8.8877 | 14.38765 | 20.344 | 9.0138 | 14.51385 | 20.171 |
| 8.8888 | 14.38885 | 20.293 | 9.0151 | 14.51506 | 20.129 |
| 8.8901 | 14.39006 | 20.363 | 9.0163 | 14.51627 | 20.327 |
| 8.8913 | 14.39127 | 20.289 | 9.0175 | 14.51749 | 20.310 |
| 8.8925 | 14.39249 | 20.362 | 9.0206 | 14.52065 | 20.322 |
| 8.9390 | 14.43896 | 20.548 | 9.0218 | 14.52185 | 20.275 |
| 8.9402 | 14.44017 | 20.534 | 9.0231 | 14.52306 | 20.379 |
| 8.9414 | 14.44138 | 20.467 | 9.0243 | 14.52426 | 20.248 |
| 8.9426 | 14.44259 | 20.522 | 9.0255 | 14.52546 | 20.368 |
| 8.9438 | 14.44378 | 20.519 | 9.0267 | 14.52667 | 20.343 |
| 8.9450 | 14.44500 | 20.514 | 9.0279 | 14.52788 | 20.374 |
| 8.9462 | 14.44619 | 20.497 | 9.0291 | 14.52909 | 20.357 |
| 8.9474 | 14.44741 | 20.458 | 9.0303 | 14.53029 | 20.532 |
| 8.9486 | 14.44861 | 20.469 | 9.0315 | 14.53150 | 20.501 |
| 8.9498 | 14.44981 | 20.438 | 9.0327 | 14.53272 | 20.473 |
| 8.9510 | 14.45103 | 20.501 | 9.0339 | 14.53392 | 20.455 |
| 8.9522 | 14.45223 | 20.397 | 9.0351 | 14.53514 | 20.426 |
| 8.9534 | 14.45345 | 20.515 | 9.0363 | 14.53634 | 20.403 |
| 8.9547 | 14.45465 | 20.467 | 9.0375 | 14.53753 | 20.577 |
| 8.9559 | 14.45586 | 20.415 | 9.0387 | 14.53873 | 20.491 |
| 8.9571 | 14.45706 | 20.356 | 9.0399 | 14.53993 | 20.558 |
| a At beginning of exposure | |||||
| UT a | JD a | mv | UT a | JD a | mv |
|---|---|---|---|---|---|
| Feb. 02 | 2452300+ | Feb. 02 | 2452300+ | ||
| 9.0411 | 14.54113 | 20.450 | 9.8495 | 15.34946 | 20.559 |
| 9.0423 | 14.54235 | 20.485 | 9.8507 | 15.35067 | 20.555 |
| 9.0435 | 14.54355 | 20.536 | 9.8519 | 15.35187 | 20.628 |
| 9.0448 | 14.54477 | 20.582 | 9.8548 | 15.35485 | 20.600 |
| 9.0460 | 14.54597 | 20.636 | 9.8560 | 15.35605 | 20.545 |
| 9.0472 | 14.54718 | 20.500 | 9.8573 | 15.35726 | 20.587 |
| 9.0484 | 14.54839 | 20.465 | 9.8585 | 15.35846 | 20.583 |
| 9.0496 | 14.54961 | 20.553 | 9.8597 | 15.35966 | 20.526 |
| 9.0508 | 14.55081 | 20.629 | 9.8609 | 15.36087 | 20.561 |
| 9.0520 | 14.55201 | 20.567 | 9.8621 | 15.36206 | 20.626 |
| 9.0532 | 14.55323 | 20.593 | 9.8633 | 15.36326 | 20.443 |
| 9.0544 | 14.55444 | 20.502 | 9.8645 | 15.36447 | 20.590 |
| 9.0557 | 14.55566 | 20.577 | 9.8657 | 15.36567 | 20.587 |
| 9.0673 | 14.56730 | 20.569 | 9.8669 | 15.36689 | 20.611 |
| 9.0685 | 14.56852 | 20.584 | 9.8681 | 15.36809 | 20.567 |
| 9.0697 | 14.56973 | 20.570 | 9.8693 | 15.36929 | 20.502 |
| 9.0709 | 14.57094 | 20.546 | 9.8705 | 15.37049 | 20.545 |
| 9.0722 | 14.57215 | 20.510 | 9.8717 | 15.37169 | 20.515 |
| 9.0734 | 14.57336 | 20.448 | 9.8729 | 15.37289 | 20.495 |
| 9.0745 | 14.57455 | 20.438 | 9.8741 | 15.37410 | 20.531 |
| 9.0758 | 14.57575 | 20.492 | 9.8753 | 15.37530 | 20.483 |
| 9.0770 | 14.57696 | 20.363 | 9.8765 | 15.37650 | 20.554 |
| 9.0782 | 14.57816 | 20.476 | 9.8777 | 15.37771 | 20.413 |
| 9.0794 | 14.57939 | 20.552 | 9.8789 | 15.37891 | 20.482 |
| 9.0806 | 14.58059 | 20.433 | 9.8801 | 15.38012 | 20.373 |
| 9.0818 | 14.58179 | 20.472 | 9.8813 | 15.38132 | 20.468 |
| 9.0830 | 14.58300 | 20.510 | 9.8825 | 15.38252 | 20.406 |
| 9.0842 | 14.58420 | 20.378 | 9.8837 | 15.38373 | 20.428 |
| 9.0854 | 14.58539 | 20.519 | 9.8849 | 15.38493 | 20.453 |
| 9.0866 | 14.58661 | 20.496 | 9.8861 | 15.38613 | 20.416 |
| 9.0878 | 14.58781 | 20.507 | 9.8873 | 15.38734 | 20.297 |
| 9.0890 | 14.58903 | 20.520 | 9.8885 | 15.38853 | 20.331 |
| 9.0902 | 14.59024 | 20.505 | 9.8897 | 15.38975 | 20.279 |
| 9.0915 | 14.59147 | 20.535 | 9.8909 | 15.39095 | 20.333 |
| 9.0927 | 14.59269 | 20.365 | 9.8922 | 15.39215 | 20.354 |
| 9.0939 | 14.59389 | 20.304 | 9.8934 | 15.39336 | 20.364 |
| 9.0951 | 14.59512 | 20.266 | 9.8946 | 15.39456 | 20.274 |
| 9.0963 | 14.59631 | 20.350 | 9.8958 | 15.39575 | 20.329 |
| 9.0976 | 14.59755 | 20.278 | 9.8970 | 15.39696 | 20.455 |
| 9.0987 | 14.59875 | 20.336 | 9.8982 | 15.39816 | 20.324 |
| 9.0999 | 14.59995 | 20.260 | 9.8994 | 15.39936 | 20.286 |
| 9.1012 | 14.60115 | 20.338 | 9.9006 | 15.40057 | 20.200 |
| 9.1024 | 14.60235 | 20.310 | 9.9018 | 15.40177 | 20.293 |
| 9.8284 | 15.32839 | 20.649 | 9.9034 | 15.40337 | 20.287 |
| 9.8296 | 15.32961 | 20.543 | 9.9046 | 15.40458 | 20.223 |
| 9.8308 | 15.33081 | 20.632 | 9.9058 | 15.40578 | 20.207 |
| 9.8320 | 15.33201 | 20.567 | 9.9070 | 15.40699 | 20.210 |
| 9.8332 | 15.33322 | 20.486 | 9.9082 | 15.40818 | 20.158 |
| 9.8344 | 15.33442 | 20.649 | 9.9094 | 15.40939 | 20.096 |
| 9.8356 | 15.33563 | 20.654 | 9.9106 | 15.41058 | 20.233 |
| 9.8368 | 15.33684 | 20.468 | 9.9118 | 15.41178 | 20.261 |
| 9.8380 | 15.33803 | 20.532 | 9.9130 | 15.41300 | 20.130 |
| 9.8393 | 15.33926 | 20.502 | 9.9142 | 15.41420 | 20.254 |
| 9.8405 | 15.34047 | 20.630 | 9.9154 | 15.41541 | 20.119 |
| 9.8417 | 15.34170 | 20.492 | 9.9166 | 15.41661 | 20.235 |
| 9.8435 | 15.34345 | 20.600 | 9.9178 | 15.41780 | 20.179 |
| 9.8447 | 15.34465 | 20.675 | 9.9190 | 15.41900 | 20.171 |
| 9.8459 | 15.34586 | 20.612 | 9.9202 | 15.42021 | 20.159 |
| 9.8471 | 15.34706 | 20.567 | 9.9214 | 15.42141 | 20.117 |
| 9.8483 | 15.34825 | 20.561 | 9.9226 | 15.42262 | 20.171 |
| a At beginning of exposure | |||||
| UT a | JD a | mv | UT a | JD a | mv |
|---|---|---|---|---|---|
| Feb. 02 | 2452300+ | Feb. 02 | 2452300+ | ||
| 9.9238 | 15.42381 | 20.201 | 10.0172 | 15.51723 | 20.261 |
| 9.9250 | 15.42501 | 20.233 | 10.0184 | 15.51845 | 20.352 |
| 9.9262 | 15.42623 | 20.159 | 10.0197 | 15.51965 | 20.437 |
| 9.9274 | 15.42743 | 20.248 | 10.0209 | 15.52086 | 20.417 |
| 9.9287 | 15.42865 | 20.274 | 10.0221 | 15.52207 | 20.356 |
| 9.9298 | 15.42985 | 20.229 | 10.0233 | 15.52326 | 20.370 |
| 9.9311 | 15.43105 | 20.197 | 10.0245 | 15.52447 | 20.265 |
| 9.9323 | 15.43226 | 20.211 | 10.0257 | 15.52567 | 20.258 |
| 9.9335 | 15.43346 | 20.248 | 10.0269 | 15.52687 | 20.229 |
| 9.9347 | 15.43466 | 20.240 | 10.0281 | 15.52808 | 20.371 |
| 9.9359 | 15.43587 | 20.213 | 10.0293 | 15.52927 | 20.339 |
| 9.9371 | 15.43706 | 20.311 | 10.0305 | 15.53047 | 20.207 |
| 9.9383 | 15.43826 | 20.287 | 10.0317 | 15.53169 | 20.287 |
| 9.9395 | 15.43947 | 20.252 | 10.0329 | 15.53289 | 20.118 |
| 9.9407 | 15.44066 | 20.213 | 10.0341 | 15.53410 | 20.261 |
| 9.9418 | 15.44185 | 20.208 | 10.0353 | 15.53531 | 20.131 |
| 9.9431 | 15.44306 | 20.211 | 10.0365 | 15.53652 | 20.193 |
| 9.9443 | 15.44426 | 20.300 | 10.0377 | 15.53771 | 20.076 |
| 9.9454 | 15.44545 | 20.307 | 10.0389 | 15.53891 | 20.108 |
| 9.9467 | 15.44666 | 20.238 | 10.0401 | 15.54013 | 20.152 |
| 9.9479 | 15.44787 | 20.400 | 10.0413 | 15.54133 | 20.195 |
| 9.9491 | 15.44907 | 20.336 | 10.0426 | 15.54255 | 20.212 |
| 9.9503 | 15.45028 | 20.323 | 10.0437 | 15.54374 | 20.087 |
| 9.9520 | 15.45205 | 20.402 | 10.0473 | 15.54734 | 20.083 |
| 9.9533 | 15.45325 | 20.393 | 10.0485 | 15.54854 | 20.200 |
| 9.9545 | 15.45446 | 20.434 | 10.0498 | 15.54975 | 20.196 |
| 9.9557 | 15.45566 | 20.408 | 10.0510 | 15.55096 | 20.176 |
| 9.9569 | 15.45686 | 20.362 | 10.0522 | 15.55216 | 20.166 |
| 9.9581 | 15.45807 | 20.355 | 10.0534 | 15.55337 | 20.193 |
| 9.9593 | 15.45928 | 20.416 | 10.0569 | 15.55688 | 20.247 |
| 9.9605 | 15.46047 | 20.528 | 10.0581 | 15.55809 | 20.138 |
| 9.9617 | 15.46169 | 20.522 | 10.0593 | 15.55929 | 20.113 |
| 9.9629 | 15.46291 | 20.467 | 10.0605 | 15.56049 | 20.235 |
| 9.9641 | 15.46411 | 20.458 | 10.0617 | 15.56169 | 20.157 |
| 9.9653 | 15.46530 | 20.569 | 10.0629 | 15.56289 | 20.180 |
| 9.9665 | 15.46650 | 20.475 | 10.0641 | 15.56409 | 20.250 |
| 9.9677 | 15.46770 | 20.612 | 10.0653 | 15.56530 | 20.275 |
| 9.9689 | 15.46891 | 20.586 | 10.0665 | 15.56650 | 20.220 |
| 9.9961 | 15.49612 | 20.411 | 10.0677 | 15.56771 | 20.293 |
| 9.9973 | 15.49733 | 20.487 | 10.0689 | 15.56891 | 20.185 |
| 9.9985 | 15.49854 | 20.432 | 10.0701 | 15.57012 | 20.343 |
| 9.9998 | 15.49976 | 20.522 | 10.0713 | 15.57132 | 20.180 |
| 10.0009 | 15.50095 | 20.618 | 10.0725 | 15.57251 | 20.317 |
| 10.0088 | 15.50881 | 20.402 | 10.0737 | 15.57372 | 20.097 |
| 10.0100 | 15.51001 | 20.467 | 10.0749 | 15.57492 | 20.346 |
| 10.0112 | 15.51122 | 20.400 | 10.0761 | 15.57612 | 20.285 |
| 10.0124 | 15.51243 | 20.371 | 10.0773 | 15.57734 | 20.273 |
| 10.0136 | 15.51363 | 20.330 | 10.0785 | 15.57854 | 20.262 |
| 10.0148 | 15.51483 | 20.396 | 10.0797 | 15.57975 | 20.264 |
| 10.0160 | 15.51604 | 20.382 | 10.0809 | 15.58095 | 20.326 |
| a At beginning of exposure | |||||
A period search routine based on the Lomb (1976) technique was applied to the reduced data. A periodic signal of 3.1757 h was found, with a 0.420.01 magnitude amplitude. The 0.01 mag uncertainty is the 1 uncertainty resulting from a sinusoidal fit of the 341 data points. Figure 1 shows the data as a function of time, and then phased to the 3.1757 h period. A reference 0.25 phase is taken on Julian date 2452314.3591, corresponding to a brightness maximum. Plotting the data phased to a double period (6.3514 hr) suggests an asymmetry between the two maxima, in agreement with JS02. However, given the 0.06 magnitude uncertainty in our data, we more conservatively retain the single-peaked period, for which, from an error estimate based on Horne & Baliunas (1986), we adopt a 3.1760.010 h value. JS02 obtained a much more accurate 3.17210.0001 hr single-peaked period. We note however that with such a period, our Feb. 2002 observations appear out of phase from their Feb. 2001 observations by 95∘. JS02 note that periods of 3.1656 hr and 3.1788 hr are alternate acceptable fits to their data. While the first one would produce again a 99∘ mismatch with our data, the second one would give a much better agreement (18∘ phase difference, i.e. 10 minutes, which is reduced to zero assuming a 0.0001 hr uncertainty on the period). We also note that with a period of 6.3576 hr (= 23.1788 hr), the lightcurve asymmetry we tentatively observe would be in phase with the one reported by JS02 (i.e. a primary maximum in their curve is in phase with a primary maximum in ours). To phase the thermal observations below, we will finally adopt P = 3.1788 hr.
2.2 Thermal observations
Thermal observations were conducted with the IRAM 30-m radiotelescope on five dates in January - February 2002. We used the Max Planck Institut für Radio Astronomie 37 element bolometer array (Kreysa et al. 1998). The beams have a half-power width of 11” and are separated by 20”. The instrument has a bandwidth of about 60 GHz, and an effective frequency close to 250 GHz (1.2 mm). Observations of Varuna were performed in “on-off” mode, in which the subreflector (or wobbler) of the telescope was alternately (with a 2 Hz frequency) looking at the target and at a sky position 32” away in azimuth (either to the left or right of the source, alternating every 10 s). While this procedure subtracts most of the atmospheric emission, the photometric accuracy is determined in part by the ability to eliminate its temporal fluctuations. Our multibeam observations allow us to estimate the latter from the channels adjacent to the central channel.
Observations were conducted as follows. Pointing and focus of the telescope were first determined by measurements on Callisto. Then, the zenithal atmospheric opacity was measured from sky measurements at several elevations (skydip). Then, on-off measurements were performed during about 40-50 minutes (9-11 loops of 20 10-sec subscans, plus overheads). This entire procedure provided one “Varuna measurement”. Three such measurements were obtained on January 19, in visitor mode. Several additional measurements were obtained subsequently as “pooled observations” (i.e., service mode): two on January 28, and one on January 31, February 11 and February 12. Observations were performed in good weather conditions (1-2 mm water). Most importantly, atmospheric stability was good, except on February 11 and 12, where large fluctuations of the zenithal sky opacity occured. In addition, data reduction revealed that one of the two measurements of Jan. 28 suffered from a large focus error. Thus, these three measurements were not considered, leaving us with a total of five individual measurements of Varuna’s 1.2 mm flux.
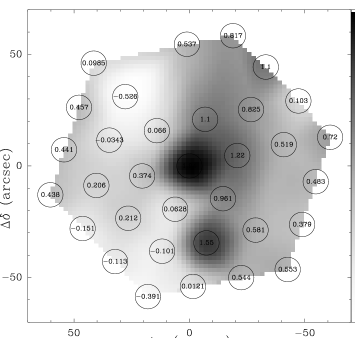
For each measurement, the data were reduced in terms of a “count number” for each channel. Relative calibration of the 37 channels were achieved by using a 180” x 140” on-the-fly map (Wild 1999) obtained on Mars on January 25, 2002. Absolute calibration was obtained from Mars on-off measurements on each observing day. Table 2 summarizes the five Varuna measurements and Fig. 2 illustrates the detection of the object in the grand total data average. For each measurement, Table 2 gives the mean flux level in the innermost ring of 6 channels (see Fig. 2); this value was subtracted from the central channel to yield Varuna’s flux. We believe that the flux variability at the mJy level seen in Table 2 is primarily due to atmospheric fluctuations, rather than to background sources. To contribute at a 0.1 mJy level, a 4000 K star would have to be brighter than V 7.5. Background galaxies may be a more important issue. The density of faint background galaxies brighter than 1 mJy at 250 GHz (2 mJy at 350 GHz) is 3000/dg2 according to the most recent JCMT/SCUBA survey (Borys et al. 2002). The probability that such a source falls within the central channel is only 0.02, however the probability that one of the six adjacent channels is affected at the mJy level is 10-15 %. This might contribute to the fact that the mean flux over these channels is generally positive. However, if this were dominantly the case, this “mean background flux” should not vary, as it seems to do, over a 1-hour timescale (during which the source moves by only 3”). We thus believe that the residual flux mostly reflects sky fluctuations, justifying our approach to subtract it from the central channel. Using only the inner 6 channels to estimate and remove this contribution is justified by the fact that using more channels would increase the probability of including an unidentified background source. In addition, we believe that using only the closest adjacent channels is the most adequate way to evaluate the sky contribution in the central channel. Correction of the cosmic background is entirely negligible (0.004 mJy).
| Date | UT a | Phaseb | c | F | F |
| 2002/01/19 | 01h15 | 0.157 | 0.18 | 1.7 | 1.41.0 |
| 2002/01/19 | 02h23 | 0.513 | 0.18 | 0.8 | 3.31.0 |
| 2002/01/19 | 03h30 | 0.864 | 0.18 | 0.2 | 1.51.0 |
| 2002/01/28 | 20h59 | 0.315 | 0.17 | 1.2 | 0.81.0 |
| 2002/01/31 | 22h30 | 0.442 | 0.14 | -0.2 | -0.1 0.7 |
| a UT time at the middle of integration | |||||
| b See text for phase reference. Phases of 0.25 and 0.75 (resp. 0 and 0.5) correspond to maxima (resp. minima) of the visible lightcurve. | |||||
| c Mean zenithal atmospheric opacity | |||||
| d Mean flux in the six channels adjacent to central channel | |||||
| e Varuna flux, after subtraction of Fadj from central channel | |||||
3 Interpretation
In Fig. 3, the five thermal flux measurements are plotted as a function of phase, assuming a period of 3.1788 hr and the same reference phase. The data are much too noisy to search for any possible correlation with the visible lightcurve (and hence to discriminate between a shape vs. albedo origin for the latter). Averaging all Varuna measurements leads to a flux of 1.120.41 mJy. This is only a 2.7 detection; together with the 3.3 detection of JAE01, this illustrates the difficulty of such measurements.
This measurement is analyzed using a thermal model, developed for Pluto (Lellouch et al. 2000a, 2000b), and following a classical formulation (Spencer et al. 1989). The local temperature is written as:
where is the bolometric albedo and is the bolometric emissivity. = 60.0 K is the instantaneous equilibrium temperature at Varuna’s current heliocentric distance ( = 43.105 AU) and at the subsolar point for = 1, = 0. symbolically represents the normalized temperature function, as a function of , and of the thermal parameter . At a given wavelength (), the local flux is then equal to B, where is the spectral emissivity, and is a factor accounting for the beaming effect. The local fluxes are then weighted by the solid angles sustained and added. At the low precision of our measurements, a number of assumptions can be safely made. First, can be considered as known. Based on JAE01’s estimate of Varuna’s red geometric albedo () and color, and the observed correlation between and the phase integral (Lellouch et al. 2000a), we assume = 0.4. The resulting bolometric albedo is 0.02-0.03. With the (1-)0.25 dependence of the equilibrium temperature, the thermal flux is essentially insensitive to . Second, with a rotation period of 3.17 hr, Varuna is likely to be in the “fast rotator” regime: assuming a thermal inertia similar to Pluto’s ( 3104 erg cm-2 s-1/2 K-1 Lellouch et al. 2000a), the resulting thermal parameter is 600 (as opposed to 3–20 for Pluto), so that diurnal temperature variations should be negligible. Although Varuna’s pole orientation in unknown, the large amplitude of the lightcurve suggests that the subearth and subsolar points are closer to the equatorial plane than to the polar axis. We thus adopt an isothermal latitude model with the Sun in the equatorial plane. Based on an analogy with Pluto (Lellouch et al. 2000a), we assume a bolometric emissivity of 0.9. With these assumptions, the local temperature is simply = cos0.25(latitude), where the equatorial temperature is = 45.9 K. Again by similarity with Pluto (Lellouch et al. 2000b), we assume a millimeter-wave emissivity of 0.7. For simplicity, we neglect any beaming effect, i.e set = 1. We then integrate the thermal flux over the object’s disk and solve the mean measured flux for its mean equivalent circular diameter. We find = 1060 km. Although our central flux value, when rescaled to 850 m, is 25-30 % lower than JAE01’s, our inferred nominal value is slightly higher than theirs; this is due to different assumptions on the millimeter emissivity, the distribution of temperature, and the fact that JAE01 adopted the Rayleigh-Jeans approximation (which is relatively inaccurate at 0.8 mm – about 20 % error for T = 45 K). With our model, we would infer a 1220 km diameter from JAE01’s measurements. The two determinations nonetheless overlap within error bars. The above estimates assume that Varuna is a single object and that its lightcurve is due either to albedo spots or a non-spherical shape. If Varuna is a binary (although, as noted by JS02, its quasi-sinusoidal lightcurve tends to argue against it), our measurements would indicate diameters of 950 and 660 km for the two components.

The associated (i.e., averaged over the rotation of the object) V magnitude is = 20.370.08. With a mean V - R = 0.64 (JS02), this gives = 19.73, in agreement with earlier measurements. The rotationally-averaged geometric albedo () in a given color is then computed from the usual equation:
where is the heliocentric distance in AU, and D are the geometric distance and object’s diameter in the same units, and are the magnitude of the Sun and Varuna in the same color ( = -26.74 in V and -27.1 in R), and is the phase function at the relevant phase angle. We neglect any phase angle effects, i.e. set = 1. With the above diameter and the mean conditions for the visible observations ( = 42.35 AU, R = 43.105 AU), we obtain a mean = 0.038 and = 0.049. Although nominally smaller, this again is consistent within error bars with the JAE01 determinations. Note that the 30–40 % uncertainty in the albedo determination is dominated by the uncertainty in the diameter (i.e. in the thermal flux), the 0.08 mag absolute photometric uncertainty having a much smaller effect (8 % error).
4 Summary
We have performed coordinated optical and thermal observations
of Trans-Neptunian object (20000)Varuna. The optical data,
acquired at the IAA 1.5 m telescope, show a clear
lightcurve with a single-peaked period of 3.1760.010 hr,
a mean V magnitude of 20.370.08 and a 0.420.01
magnitude amplitude. Phasing our observations with those
of Jewitt & Sheppard (2002), we find a best fit period
of 3.17880.0001 hr. Our observations tentatively confirm
an asymmetry in the lightcurve, as first reported by Jewitt
& Sheppard. This would favor the hypothesis that
the lightcurve is actually double-peaked with a 6.35760.0002
hr period and predominantly due to an elongated shape of the
object. The thermal data, obtained with the IRAM
30-m telescope, consist of five independent measurements
of Varuna’s 1.2 mm flux, sampling the optical lightcurve.
These measurements are much too noisy to distinguish
a possible thermal lightcurve. Averaged together, they indicate
a 1.120.41 mJy flux at 1.2 mm, i.e. a 2.7 detection
that adds to the 3.3 detection of Jewitt,
Aussel & Evans (2001) at 0.8 mm and confirms the difficulty of this
kind of observations. Assuming emissivity and thermophysical
surface properties similar to Pluto’s, the thermal data
indicate a mean equivalent circular diameter of
1060 km. The associated albedos in the visible
and the red are = 0.038 and
=
0.049, respectively, consistent
with the determination by JAE01.
Taken together with the albedo measurement of 1993 SC
( = 0.022)
and the possible detection of 1996 TL66 by Thomas
et al. (2000), this indicates
that the canonical 0.04 albedo adopted for size distribution
studies is not invalid at this point.
Acknowledgments: This research is partially based on data taken at the 1.5m telescope of Sierra Nevada Observatory which is operated by the Consejo Superior de Investigaciones Cientificas through the Instituto de Astrofisica de Andalucia. N.P. acknowledges funding from the FCT, Portugal (ref: SFRH/BD/1094/2000).
References
- (1) Altenhoff, W.J., J.W.M. Baars, J.B. Schraml, et al. 1996, A & A 309, 953
- (2) Barucci, M. A., Romon J., Doressoundiram A., & Tholen D. J. 2000, Astron. J. 120, 496
- (3) Borys, C., S.C. Chapman, M. Halpern, & D. Scott 2002, MNRAS 330, L63
- (4) Doressoundiram, A., M.-A. Barucci, J. Romon, & C. Veillet 2001, Icarus, 154, 277
- (5) Doressoundiram, A., N. Peixinho, C. de Bergh, et al. 2002, ApJ, submitted.
- (6) Duncan, M., J. Quinn, & S. Tremaine 1988, Ap. J. 328, L69
- (7) Farnham, T.L. 2001, IAU Circ. 7583
- (8) Horne, J.H., & S.L. Baliunas 1986, Ap. J. 302, 757
- (9) Jewitt, D., & J. Luu 1992, in Protostars and Planets IV, (Univ. Arizona Press, Tucson), 1201.
- (10) Jewitt, D., H. Aussel, & A. Evans 2001, Nature 411, 446
- (11) Jewitt, D., & S.S. Sheppard 2002, A.J. 123, 2110.
- (12) Knoffel, A. & R. Stoss 2000, MPEC. No 2000-Y45
- (13) Kreysa, E., H.-P. Gemuend, J. Gromke et al. 1998, SPIE 3357, 319
- (14) Landolt, A. U. 1992, Astron. J. 104, 340
- (15) Lellouch, E., R. Laureijs, B. Schmitt, et al. 2000a, Icarus 147, 220
- (16) Lellouch, E., G. Paubert, R. Moreno, & B. Schmitt 2000b, Icarus 147, 580
- (17) Licandro, J., E. Oliva, & M. Di Martino 2001, A&A 373, L29.
- (18) Lomb, N. R. 1976, Astroph. Space Sci. 39, 447
- (19) McMillan, R.S., & J.A. Larsen 2000, MPEC. No 2000-X02
- (20) Redman, R.O., P.A. Feldman, H.E. Matthews et al. 1992, A.J., 104, 405
- (21) Spencer, J. R., A. L. Lebofsky & M. V. Sykes 1989. Icarus, 78, 337.
- (22) Thomas, N., S. Eggers, W.-H. Ip et al. 2000, ApJ 534, 446
- (23) Wild, W. 1999, www.iram.es/IRAMES/index.htm