Three-dimensional simulations of type Ia supernovae
We present the results of three-dimensional hydrodynamical simulations of the subsonic thermonuclear burning phase in type Ia supernovae. The burning front model contains no adjustable parameters so that variations of the explosion outcome can be linked directly to changes in the initial conditions. In particular, we investigate the influence of the initial flame geometry on the explosion energy and find that it appears to be weaker than in 2D. Most importantly, our models predict global properties such as the produced nickel masses and ejecta velocities within their observed ranges without any fine tuning.
Key Words.:
supernovae: general – hydrodynamics – turbulence – nuclear reactions, nucleosynthesis, abundances – methods: numerical(martin@mpa-garching.mpg.de)
1 Introduction
In a series of papers (Reinecke et al. 1999b, a, 2002) we described a new numerical tool to simulate thermonuclear explosions of white dwarfs in two and three spatial dimensions. Our aim was to construct models of type Ia supernova (SN Ia) explosions that are as free from non-physical parameters as currently feasible. Thermonuclear burning, in particular, is represented by a subsonic turbulent flame whose local velocity is derived from a subgrid-scale model for unresolved turbulent fluctuations. Solved in combination with the compressible Euler equations, this model contains no free parameters that could be adjusted in order to fit SN Ia observations. Consequently, the initial white dwarf model (composition, central density, and velocity structure), as well as assumptions about the location, size and shape of the flame surface as it first forms fully determine the simulation results. Here, we concentrate on variations of the latter.
In Reinecke et al. (1999b), we confirmed the earlier result of Niemeyer et al. (1996) that, at least in 2D, the explosion energy and amount of 56Ni produced in the explosion (which determines the brightness of an SN Ia) are sensitive to the ignition conditions. To be more precise, a more complicated topology of the initial nuclear flame seems to lead to higher Ni-production and, consequently, more powerful explosions. One might even speculate that the randomness of the ignition process could be the reason for the observed spread in properties of normal SNe Ia (Hillebrandt & Niemeyer 2000).
This article continues the presentation of numerical simulations of SNe Ia by testing the effect of different initial conditions on the simulation outcome in three dimensions. In this context, the simultaneous runaway at several different spots in the central region of the progenitor star is of particular interest. A plausible ignition scenario was suggested by Garcia-Senz & Woosley (1995).
All simulations were performed using the algorithms presented by Reinecke et al. (2002, 1999b). The initial model for the white dwarf, assumed to be at the Chandrasekhar mass, as well as the grid geometry and symmetry assumptions, are identical to the setup described in Sects. 3 and 4 of Reinecke et al. (2002).
Sect. 2 of this paper presents the initial front geometry and its temporal evolution for two multi-point ignition calculations. Various aspects of all three-dimensional calculations are then compared in Sect. 3. As far as possible, this comparison is then extended to other existing results of SN Ia simulations. In the case of parameterized one-dimensional calculations such comparisons are difficult, since most of the published data have no analogy in three dimensions. As an alternative, we suggest to track and compare the amount of burned material as function of the density at which the burning took place.
Generally speaking, we confirm the earlier 2D results: models with more, or better resolved, ignition spots tend to produce more radioactive Ni also in 3D, although the effect is somewhat smaller. But together with the gain of Ni by going from 2D to 3D our models predict amounts that are in good agreement with those inferred from the observations (Contardo et al. 2000). This will also be discussed in Sect. 3, and our conclusions follow in Sect. 5.
2 Multi-point ignition scenarios
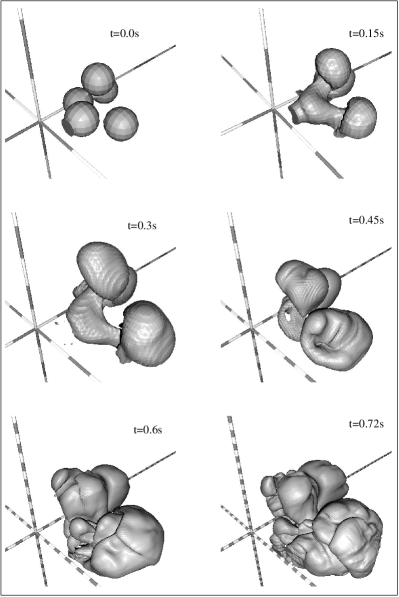
Two different calculations were performed to investigate the off-center ignition model in three dimensions. The simulation b5_3d_256 was carried out on a grid of 2563 cells with a central resolution of 106 cm and contained five bubbles with a radius of cm, which were distributed randomly in the simulated octant within cm of the star’s center. As an additional constraint, the bubbles were required not to overlap significantly with the other bubbles or their mirror images in the other octants. This maximizes the initial flame surface. The exact algorithm for the positioning of the bubbles was the following: First, the centers of the bubbles were chosen randomly within the radius of cm. A realization was accepted when the distance between any two bubble centers (including the mirror images across the coordinate planes) was larger than 1.3 bubble radii. A particular realization of these initial conditions and its temporal evolution is shown in Fig. 1. The locations of the bubble centers are listed in Table 1.
| Part. No. | 1 | 2 | 3 | 4 | 5 |
|---|---|---|---|---|---|
| x-Pos. | 128 | 35 | 42 | 85 | 63 |
| y-Pos. | 76 | 60 | 129 | 27 | 85 |
| z-Pos. | 27 | 30 | 30 | 41 | 83 |
In a way very similar to the evolution of earlier two-dimensional simulations (cf. Fig. 6 of Reinecke et al. 1999a) the flame kernels closer to the center are elongated very rapidly and connect to the outermost bubbles within 0.15 s. The whole burning region disconnects from the coordinate planes and starts to float slowly towards the stellar surface.
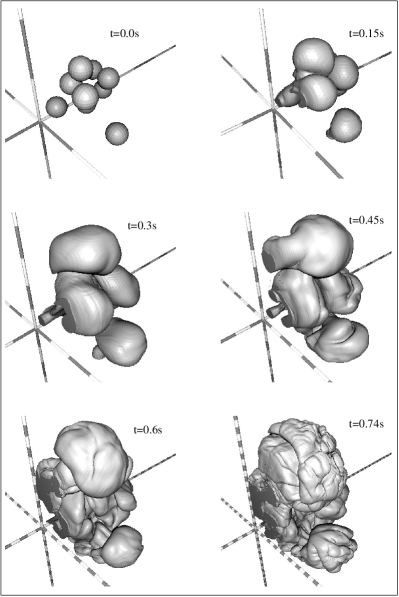
In an attempt to reduce the initially burned mass as much as possible without sacrificing too much flame surface, the very highly resolved model b9_3d_512 was constructed. It contains nine randomly distributed, non-overlapping bubbles with a radius of 2106 cm within cm of the white dwarf’s center. To properly represent these very small bubbles, the cell size was reduced to cm, so that a total grid size of cells was required.
Starting out with very small flame kernels is desirable, because the initial hydrostatic equilibrium is better preserved if only a little mass is burned instantaneously. Furthermore the floating bubbles are expected to be even smaller in reality than in the presented model ( cm, see Garcia-Senz & Woosley 1995).
| Part. No. | 1 | 2 | 3 | 4 | 5 |
|---|---|---|---|---|---|
| x-Pos. | 70.2 | 106.4 | 22.8 | 77.8 | 137.2 |
| y-Pos. | 48.6 | 24.6 | 121.2 | 106.7 | 68.2 |
| z-Pos. | 128.0 | 105.2 | 77.4 | 88.3 | 20.4 |
| Part. No. | 6 | 7 | 8 | 9 | |
| x-Pos. | 47.7 | 41.4 | 27.5 | 42.2 | |
| y-Pos. | 45.5 | 133.1 | 24.1 | 85.0 | |
| z-Pos. | 91.2 | 34.0 | 39.3 | 21.7 |
The center locations of our particular realization are given in Table 2. Snapshots of the front evolution (Fig. 2) exhibit features very similar to those observed in the lower-resolution 3D models. Only in the last plot the formation of additional small-scale structures becomes evident.

The direct comparison of the nuclear evolution with model b5_3d_256 in Fig. 3 nevertheless reveals differences in the early explosion stages: the high-resolution simulation produces slightly more nickel and considerably more -particles during the first half second. This phenomenon is most likely explained by the discrepancy in the ratio between the initial flame surface and the volume of burned material in the two models. The higher burned mass in the five-bubble model initiates an early bulk expansion of the star and therefore causes a rapid drop of the central density. Since its flame surface is quite small compared to the burned volume, only relatively little mass can be burned at high densities. In the nine-bubble model, on the other hand, the star expands more slowly at first because less material is burned instantaneously, and the mass fraction of -particles in the reaction products is consequently rather high. Since the energy buffered in those -particles is not immediately used to drive the expansion, the flame can consume more material at higher densities and has more time to increase its surface as a result of hydrodynamical instabilities.
3 Comparison of all 3D simulations
3.1 Energy release

In addition to the two simulations presented above, the following comparison also includes the model c3_3d_256, which was described in Reinecke et al. (2002). It must be emphasized that the comparison between the normal and high-resolution calculations can be qualitative at best, because the initial conditions as well as the resolution of model b9_3d_256 are different from the other two, and it was not possible to perform a 3D resolution study like the two-dimensional one discussed in Reinecke et al. (2002) in order to investigate the influence of the cell size on the simulation outcome. However, if one assumes that numerical convergence is reached as long as the flame stays in the uniform grid region and the cell size is at most 106cm (which seems very plausible according to the 2D study), at least the evolution during the initial 0.8 seconds should be practically independent of the employed resolution. For example, if the model b5_3d would be re-calculated at increased resolution, the authors would expect identical behaviour to the original simulation up to 0.8 seconds after ignition, and probably slightly increased energy generation afterwards.
During the first 0.5 seconds, the three models are nearly indistinguishable as far as the total energy is concerned (see Fig. 4), which at first glance appears somewhat surprising, given the quite different initial conditions. A closer look at the energy generation rate actually reveals noticeable differences in the intensity of thermonuclear burning for the three simulations, but since the total flame surface is initially very small, these differences have no visible impact on the integrated curve in the early stages.
However, after about 0.5 seconds, when fast energy generation sets in, the nine-bubble model burns more vigorously due to its larger surface and therefore reaches a higher final energy level. Fig. 4 also shows that the centrally ignited model c3_3d_256 of Reinecke et al. (2002) is almost identical to the off-center model b5_3d_256 with regard to the explosion energetics.
Obviously, the scatter in the final energies due to different initial conditions appears to be substantially smaller than for simulations in two dimensions (see Reinecke et al. 1999b). This is, in part, good news, since it demonstrates the robustness of the explosion mechanism. On the other hand, it may lower the chances to explain all “normal” type Ia supernovae by random variations of ignition conditions alone. Whether this result is a consequence of the particular choice of initial conditions or the self-regulation mechanism described in Reinecke et al. (2002) works more efficiently in 3D needs to be studied further.
3.2 Distribution of the ejecta in real and velocity space
It is deduced from observations that the angular distribution of the ejecta is fairly homogeneous in SN Ia. This applies to the material velocities as well as the chemical composition. Concerning the ejecta speeds, the performed simulations are in good agreement with observations, since the subsonic nature of the combustion process allows for fast equilibration of pressure fluctuations and therefore generates a practically spherical expansion. However, the final distribution of the reaction products consists of a few large “lumps” of processed material separated by areas of unburned carbon and oxygen. Similar results were also obtained by Niemeyer & Hillebrandt (1995). This apparent inconsistency with observations is possibly explained by the still limited numerical resolution, which allows only a few initial features like bumps in the front or burning bubbles to be prescribed. These in turn will dominate the large-scale front geometry at late times. In reality the number of bubbles is likely to be much larger, so that the initial conditions could be isotropic in a statistical sense, which would result in a much more uniform ejecta composition. The discussed constraints for the initial conditions in the models b5_3d and b9_3d also caused the coordinate planes to be practically free of burned material. As a consequence, the most likely macroscopic flow pattern that will develop consists of an updraft near the center(?)††margin: ? of the octant and downflow at the edges of the computational domain.

The time evolution of line intensities in SN Ia spectra and also the line widths due to the Doppler broadening can be used to determine the radial position of different elements in the supernova and their velocity. A rough estimate for the velocity distribution of the ejecta for the models c3_3d_256 and b5_3d_256 is shown in Fig. 5. It must be stressed that these graphs do not represent the final ejecta speeds, since 1.5 seconds after ignition — at the end of the simulation — the gravitational binding energy is still rather high, and leaving the potential well will cause some slowdown, especially in the inner regions. Nevertheless the maximum speed and the relative distribution of the elements in velocity space allow for some conclusions concerning the predictive power of our simulations.
The ejected material reaches speeds of up to 12 000 km/s for both initial conditions which is well within the observed range of 10 000 to 15 000 km/s of typical SNe Ia. However, the composition of the ejecta in velocity space is quite different from results obtained in one-dimensional simulations, insofar as both fuel and ashes are present at almost all velocities. Such a situation is, by definition, impossible in centrally ignited one-dimensional model, because everything inside the radius of the flame must have been burned and the material further out cannot have been processed. Multidimensional calculations, in contrast, allow simultaneous burning at many different radii, and fuel and ashes can be stirred by large-scale turnover motions.
Whether the velocity profiles of the current simulations are compatible with observations has not been thoroughly investigated so far. The large amount of carbon and oxygen at low velocities which is typical for the floating-bubble calculations (e.g. in the right hand plot of Fig. 5) has not been detected yet in supernova spectra and, therefore, might not be present in real SN Ia. Whether this feature is typical for offcenter ignition scenarios or caused by our prescriptions for the initial flame geometry (see also Sect. 3.2) must be investigated in further calculations. On the other hand, it is currently conjectured that a certain amount of unburned material could remain undetected by current spectroscopy near the center of the remnant (P. Mazzali, personal communication), so that the off-center ignition scenario cannot be firmly ruled out.
3.3 The final chemical composition
Our simulations only employed a minimal nuclear reaction network which was sufficient for a good approximation of the thermonuclear energy release. For that reason, the produced abundances cannot be taken literally, but must be interpreted carefully when trying to derive light curve shapes or spectra from our results.
In our simulations, the abundance of 56Ni actually represents the sum of all Fe-group elements synthesized during the explosion. Due to the very similar nuclear binding energies of all those nuclei, this simplification is justified as far as the explosion energy is concerned. To calculate the light curve, however, 56Ni and the rest of the Fe-group elements play significantly different roles. While the radioactive decay of 56Ni supplies the energy for the light emitted by the supernova ejecta and thereby determine the bolometric luminosity, the presence of the other nuclei enhances the opacity of the ejecta and causes a broadening of the light curve.
It is expected that “real” 56Ni accounts for % of the Fe-group elements (Thielemann et al. 1986), which means that the corrected 56Ni mass is still in rather good agreement with the amounts postulated by Contardo et al. (2000). However, since the relative mass fraction of 56Ni and the total Fe-group elements may also vary in space, reliable answers can only be given once detailed post-processing using a large reaction network has been performed on the existing data. This work is currently in progress.
4 Comparison to previous simulations
It has been shown above that, as far as comparisons are presently possible, our numerical models produce results which agree fairly well with real SN Ia explosions. Unfortunately, the only parameters we can directly and quantitatively compare to the observations at present are the energy release and – to some extent – the nickel masses; all other data derived from the simulations (like the scatter in the final energies and the amount of intermediate-mass elements) are of qualitative nature only. Although they agree roughly with expectations, they may not provide a criterion for the validity of the model. In order to allow for a more detailed comparison with the observations the code has to be extended. Apart from post-processing the ejecta to produce detailed nuclear abundances, it might also be necessary to model the complex physical processes taking place in the later SN stages, up to several weeks after explosion.
As an intermediate step, it might therefore be useful to perform a detailed comparison of our results with one of the successful phenomenological SN Ia models like Nomoto’s W7 (Nomoto et al. 1984). These one-dimensional models contain complex nuclear reaction networks and have been used to generate synthetic spectra and light curves. A good candidate for such a comparative study would be the amount of burned mass as a function of the density at which the burning took place. If such graphs were similar for our simulations and the phenomenological models, this would argue for the total chemical composition of both models also being fairly equal, which in turn would be a strong hint that light curves and spectra of both simulations might not be too different. In other words, one would check whether characteristic properties of the multidimensional numerical experiments agree with the results of the phenomenological models. If so, the predictions made by the phenomenological simulations could be believed to be valid also for our calculations.
Care must be taken that only quantities are chosen for comparison which have a physical meaning in both models. For example, the time dependence of the burning speed, which is often used to characterize phenomenological models and is documented in many publications, cannot be used for this purpose, since there exists no single burning speed in multidimensional simulations at any given time. In this concrete situation, the time-dependent energy generation rate would be the proper choice for a comparison, since it is well defined in both one- and multidimensional scenarios. It would therefore be convenient if the analysis of phenomenological models contained global quantities like energy generation rates or density dependence of burned mass, which can be easily compared to multidimensional simulations.
Khokhlov (2000) describes an alternative approach to model SN Ia explosions and presents results of three-dimensional calculations. The numerical models employed in his code differ quite strongly in various aspects from the schemes in our code. In particular, the simulation is carried out on an adaptively refined grid, the flame is modeled by a reaction-diffusion method, and its propagation velocity is determined by the asymptotic rise speed of Rayleigh-Taylor bubbles instead of the turbulent velocity fluctuations.
The initial setup described in his paper is centrally ignited, and no perturbation is applied to the spherical flame surface. As soon as nonlinear instabilities have developed, however, the explosion progresses in a way which looks very similar to the 3D simulations discussed in Sect. 2. This similarity applies to the energy production rate as well as the geometrical features developed by the flame.
It is an encouraging fact that two independent and quite different attempts to simulate a SN Ia without introducing artificial burning velocities and chemical mixing yield fairly comparable results. This shows that the explosion mechanism analysed here in detail, namely a pure deflagration front in a C+O Chandrasekhar-mass white dwarf, is indeed robust.
5 Discussion and outlook
In this paper we have presented the results of three-dimensional numerical simulations of thermonuclear deflagration fronts in Chandrasekhar mass white dwarfs composed of equal amounts of carbon and oxygen. We could show that independent of the details of the ignition process (which is still far from being well understood) the white dwarf is always disrupted by the release of nuclear energy. As far as we could check at present, the properties of our models are in good agreement with observations of typical type Ia supernovae. In particular the explosion energy and the average chemical composition of the ejecta seem to fit the observations (see also Table 1). This success of the models was obtained without introducing any non-physical parameters, but just on the basis of a physical and numerical model of subsonic turbulent burning fronts. We also stress that our models give clear evidence that the often postulated deflagration-detonation transition is not needed to produce sufficiently powerful explosions.
model name [] [] [ erg] c3_3d_256 0.177 0.526 9.76 b5_3d_256 0.180 0.506 9.47 b9_3d_512 0.190 0.616 11.26
There are certainly several desirable additions and improvements. The most crucial question still seems to be the ignition process, although in 3D the dependence of the final outcome is weaker than in our previous 2D models. In principle one could try to simulate the ignition phase with the numerical models we have developed, but because of the much longer time scales this requires huge amounts of computer time. First attempts in this direction are presently under way (cf. Höflich & Stein 2002).
An improvement of the combustion model already mentioned in Reinecke et al. (1999b), i.e. the full reconstruction of all thermodynamic quantities from their mean values in every grid cell cut by the burning front, has now been completed and was applied to the Landau-Darrieus instability (Röpke 2002). This new model should be implemented into the full code which, in principle, seems to be possible but difficult. In any case, this would increase the predictive power and reliability of the models.
In a similar direction, it might be worthwhile to test other subgrid models in combination with our level set method. We do not expect major changes because if another subgrid-model would give us higher (or lower) burning speed on the grid scale this would lead to more (or less) damping of small-scale structures leaving the product of the two (and therefore the fuel consumption rate) approximately unchanged. However, again, such studies are presently in progress.
To conclude, we think that we have made another step towards the understanding of type Ia supernovae.
Acknowledgements.
We thank Sergei Blinnikov for pointing out the necessity to distinguish between 56Ni and the remaining Fe-group elements, if our results are to be used in light curve and spectra calculations. This work was supported in part by the Deutsche Forschungsgemeinschaft under Grant Hi 534/3-3. The numerical computations were carried out on a Hitachi SR-8000 at the Leibniz-Rechenzentrum München as a part of the project H007Z.References
- Contardo et al. (2000) Contardo, G., Leibundgut, B., & Vacca, W. D. 2000, A&A, 359, 876
- Garcia-Senz & Woosley (1995) Garcia-Senz, D. & Woosley, S. E. 1995, ApJ, 454, 895
- Höflich & Stein (2002) Höflich, P. & Stein, J. 2002, ApJ, 568, 779
- Hillebrandt & Niemeyer (2000) Hillebrandt, W. & Niemeyer, J. C. 2000, Ann. Rev. A&A, 38, 191
- Khokhlov (2000) Khokhlov, A. M. 2000, Three-Dimensional Modeling of the Deflagration Stage of a Type Ia Supernova Explosion, astro-ph/0008463, submitted to ApJ
- Niemeyer & Hillebrandt (1995) Niemeyer, J. C. & Hillebrandt, W. 1995, ApJ, 452, 769
- Niemeyer et al. (1996) Niemeyer, J. C., Hillebrandt, W., & Woosley, S. E. 1996, ApJ, 471, 903
- Nomoto et al. (1984) Nomoto, K., Thielemann, F. K., & Yokoi, K. 1984, ApJ, 286, 644
- Reinecke et al. (1999a) Reinecke, M. A., Hillebrandt, W., & Niemeyer, J. C. 1999a, A&A, 347, 739
- Reinecke et al. (2002) —. 2002, A&A, 386, 936
- Reinecke et al. (1999b) Reinecke, M. A., Hillebrandt, W., Niemeyer, J. C., Klein, R., & Gröbl, A. 1999b, A&A, 347, 724
- Röpke (2002) Röpke, F. 2002, A&A, ??, ??
- Thielemann et al. (1986) Thielemann, F.-K., Nomoto, K., & Yokoi, K. 1986, A&A, 158, 17