Time-Dependent Photoionization in a Dusty Medium I: Code Description and General Results
Abstract
We present a time-dependent photoionization code that combines self-consistently metal evolution and dust destruction under an intense X-ray UV radiation field. Firstly, we extend the mathematical formulation of the time-dependent evolution of dust grains under an intense radiation flux with the inclusion of the process of ion field emission (IFE). We determine the relative importance of IFE with respect to X-ray and UV sublimation as a function of grain size, intensity and hardness of the incident spectrum. We then combine the processes of dust destruction with a photoionization code that follows the evolution of the ionization states of the metals and the relative radiative transitions. Our code treats, self-consistently, the gradual recycling of metals into gas as dust is sublimated away; it allows for any initial dust grain distribution and follows its evolution in space and time. In this first paper, we use our code to study the time-dependent behaviour of the X-ray and optical opacities in the nearby environment of a Gamma-ray Burst, and show how the time variability of the low-energy and high-energy opacities can yield powerful clues on the characteristics of the medium in which the bursts occur.
1 Introduction
The realization that Gamma-ray Bursts (GRBs) are of cosmological origin has made them rank among the most energetic astrophysical phenomena known to us. Even though the total energy output is much smaller than that of other bright sources on the sky, such as quasars, their luminosity can be much higher. As a result, while the surrounding region affected by their radiation is much smaller than the corresponding region for QSOs, the effects of the interaction can be observed on a very short time-scale, comparable with the duration of the burst and its longer wavelength emission.
The X-ray and UV radiation accompanying a GRB alters the equilibrium of the medium in its close vicinity by heating and photoionizing it, and vaporizing dust grains. The time-variability of absorption lines and photoionization edges in GRB spectra has been discussed by Perna & Loeb (1998), Böttcher et al. (1999) and Lazzati, Perna & Ghisellini (2001). The destruction of dust by the intense UV flash produced by the reverse shock accompanying GRBs has been treated by Waxman & Draine (2000) and Draine & Hao (2002; DH in the following), while the effect of X-rays on dust particles has been discussed by Fruchter et al. 2001). DH (see also Draine 2000) also computed in detail the absorption spectrum due to the vibrationally excited levels of the H2 molecule.
The time-dependent effects resulting from the interaction of a GRB and its longer wavelength radiation with the environment can be a powerful diagnostics of the type of environment in which the bursts occur. Lazzati & Perna (2002) showed how the time-dependent X-ray extinction is sensitive to the density profile in the close environment of the bursts, which is different in the various progenitor scenarios for GRBs. On the other hand, as discussed before, GRBs, even though have a much shorter lifetime than QSOs, they can be far more luminous. As such, they can allow to probe regions that are not accessible to QSO absorption studies due to the high absorption. It has in fact been observed (Fall & Pei 1993) how studies of Damped Lyman (DLA) absorbers done through QSO absorption spectra are biased against observing the densest systems. And it might very well be the case that the outer regions probed through these studies do not constitute a fair sample of what the properties of these high-redshift systems are. Therefore, absorption studies with GRBs can constitute a wonderful complement to absorption studies made with QSOs, and give us a more complete picture of what the properties of high redshift galaxies really are. Along these lines, it should be mentioned a study of metal column densities and dust content made with three GRB spectra by Savaglio, Fall & Fiore (2002). By comparing the inferred column densities and dust depletion amounts with those derived in DLAs from QSO absorption studies, they inferred that the GRBs were probing denser and dustier regions than the ones probed by QSOs.
A proper evaluation of the densities and dust content of the GRB close environment requires a knowledge of how GRBs affect their environment, modifying its properties, and in particular how they influence gas and dust in their surrounding.
So far, the evolution of metals and dust under the influence of an intense radiation field has always been treated separately. In this paper, we present a time-dependent photoionization code that incorporates metals and dust evolution in a self-consistent way. Firstly, we improve the photoionization code developed by Perna, Raymond & Loeb (2000) and Perna & Raymond (2000) with the addition of a proper treatment of radiative transfer in optically thick media and the inclusion of the opacity of the H2 molecule. We then extend the mathematical formulation of the time-dependent evolution of dust grains under an intense radiation flux with the inclusion of the process of ion field emission (IFE). This process becomes important for hard spectra of the incident radiation. We combine the processes of dust destruction (UV and X-ray sublimation and IFE) with the photoionization code that includes H, H2 and the 12 most abundant astrophysical elements. Our code follows, both in space and in time, the fractions of metals that are depleted into gas and those that are in gaseous phase. As dust is being destroyed, metals are gradually being recycled into gas.
Our code allows for any initial distribution of the grain sizes, and, for each grain size and wavelength, opacities are evaluated by interpolation on the grids of opacities computed by Draine & Lee (1984; DL in the following) and Laor & Draine (1993).
While on one side showing how GRBs modify their surroundings (and hence the inferred properties of the environment as measured at later times), we also show how monitoring the time-variability of several observables during the GRB event can yield powerful information on the characteristics of the environment. In particular, in this paper, we discuss the simultaneous behaviour of the X-ray opacity and the optical opacity, and show how they depend on the size and density of the region. In two companion papers (Perna, Lazzati & Fiore 2002, paper II, and Lazzati & Perna 2002, paper III) we will be discussing, respectively, the time-dependence of the optical opacity on the distribution of dust grain sizes in the medium and the effect of time-dependent ionization on the appearance of X-ray spectra, focusing on the measure of the continuum absorption (equivalent column density, see Lazzati & Perna 2002) and on the appearance of enhanced metallicities (or deeper metal edges) similarly to the case of warm absorbers (Done et al. 1992; Zdziarski et al. 1995).
This paper is organized as follows: in §2 we discuss the various dust destruction mechanisms and we derive (§2.2) a mathematical expression to describe the evolution of the grain size due to the process of IFE. In §3 we describe how the code handles, during the process of dust sublimation, the transfer of metals from dust into gas, and how the initial dust distribution evolves in time. The initial conditions for dust content and metal depletion pattern are described in §4, while in §5 we discuss the photoionization and photodissociation of H2 and how the code handles radiative transfer in optically thick regions. The evolution of metals is described in §6, while the basics of the radiative transfer and the dust opacities are discussed in §7. Our results for the evolution of the combined X-ray and optical opacities and their relevance for GRB environments are presented in §8, while the observational perspectives (with both current and future instrumentation) for detection of the time-dependent effects that we describe, are discussed in §9. Finally, our work is summarized in the last section, §10.
2 Dust Destruction
There are several processes that can contribute to dust destruction111In this work we do not include any of the mechanisms for dust formation as the timescale for this process is much longer than what we are interested in here (e.g. Salpeter 1977). by the GRB X-ray prompt emission and (possible) UV flash. In this section, we analyze each of them in detail, and discuss their relative importance depending on the spectral shape of the flux. We consider here the optically thin case, where simple relations can be derived, and the dependence of the various effects on the illuminating spectrum can be better illustrated. Therefore, throughout this section, we will neglect the decrease of the ionizing flux due to opacity of the material at smaller radii. We will fully take this into account in the numerical computation of the radiative transfer.
2.1 Thermal sublimation
Dust grains can be destroyed through thermal sublimation. This happens when the grains absorb energy faster than they manage to radiate away. The excess energy then goes into breaking the bonds that hold atoms to the surface of the grains. The sublimation rate of a grain with temperature and radius can be approximated by (Guhathakurta & Draine 1989)
| (1) |
where is the grain atomic density222Note that we use atomic and not molecular densities since sublimation takes place atom by atom., and and are constants that depend on the composition of the grain. This process is described by Waxman & Draine (2000), who however consider only dust heating by UV photons. In this case, they can write the heating term as:
| (2) |
where is the UV luminosity333At energies above 7.5 keV, photons are mainly absorbed by H2 and then H (when eV), for H-nuclei densities cm-2. in the range [1-7.5] eV, is the grain radius and is the distance from the photon source. Whereas in the code the variation in the spectrum at a given radius due to the change in the opacity at smaller radii (because of the gradual grain evaporation) is self consistently taken into account, some useful numbers and relations can be derived in an optically thin cloud assuming a power-law spectrum of the heating radiation . In this case, the UV heating term can be written as:
| (3) |
where is defined as:
| (4) |
and takes into account the fraction of the incident flux that is actually absorbed by the grain. To estimate this value we have used the numerical results of Draine & Lee (1983) and Laor & Draine (1993)444Tables can be found at http://astro.Princeton.EDU/∼draine/dust/dust.html..
In addition to this heating process, the grain temperature is partially modified by the photoelectric absorption of X-ray photons. As discussed in DH, a dust grain under heavy X-ray illumination is initially charged up to a potential of kV, where , and is the tensile strength of the material. After this moment, any ionization corresponds to the emission of one or more ions. This process is called Ion Field Emission (IFE). If the dust grain is charged, however, not all the photoelectrons will have enough energy to escape the grain. For this reason, the residual kinetic energy of all the photoelectrons that cannot escape the grain is transformed into heat.
Consider a simplified expression for the photoelectric cross section of the electrons of an atom:
| (5) |
We can write the X-ray thermal heating term as:
| (6) |
where is the density of the dust grain in cm-3, and Hz is the frequency of photons with 3 keV energy (the energy above which the photoelectron is free to escape and does not give any thermal energy to the dust grain). We need to remark here that the above equation is not valid for cm, since the dust particles would then become optically thick in the soft X-ray regime.
Using the power-law spectrum defined above, and considering more transitions, we can write:
| (7) |
where the sum is over the considered transitions and the single transition coefficient is defined as:
| (8) |
Let us now specialize to Galactic-type dust, which is believed to be a mixture of silicate and graphite grains (Mathis, Rumpl & Nordsieck 1977). In particular, let us consider the silicate grains made of molecules555As a matter of fact, the silicate grain is made by a lattice of atoms rather than by bounded molecules. Here and in the following we use the term “molecule” for convenience. of MgFeSiO4 (also called olivine; Draine & Lee 1984), and graphite (which is Carbon). For each of the elements which make up these molecules, we consider only the photoionization of the neutral atom. In principle the grain can be ionized also by higher orbital photoionizations. Since, however, these have a threshold frequency which is much smaller than the potential barrier of the grain at the IFE threshold, their contribution to the grain ionization is negligible. Since the inner orbit potentials and cross sections of photoionization are only marginally affected by the molecular bounds, we use the atomic cross section of Verner & Yakovlev (1995) for the elements within the grains.
It is interesting to evaluate the relative efficiency of the two heating terms in the idealized case of an optically thin cloud of dust illuminated by a power-law spectrum. We have:
| (9) |
Since the absorption cross section of Carbon is larger than that of the silicate molecule, the relative sublimation efficiency of graphite as compared with silicate increases as the spectrum gets harder. Also, since X-ray heating is a volume term while UV heating is mainly a surface term (with numerical corrections), larger grains will be predominantly heated by the X-rays while small grains will be heated predominantly by the UV radiation. The result of the above equation can be computed numerically, using the density values and . The results for both types of grains are shown in Fig. 1.
2.2 Ion Field Emission
Once the dust grain is charged up to a potential kV, each further ionization will lead to the emission of one or more ions in order to avoid further increase in the surface electric field (Muller & Tsong 1969; Draine & Salpeter 1979). This process is in competition with the Coulomb Explosion (CE), i.e. the fragmentation of the grain into two smaller particles (Fruchter et al. 2001). If an initial CE takes place, it sets in a runaway process, and the grain is rapidly and completely dissociated into atoms, since the remnant of the first explosion will be above threshold for a further explosion. CE is therefore a much more effective destruction mechanism. It is also possible that grains are originally a cluster of sub-grains of the two different kinds, loosely bound by coesion forces. In this case, a CE may fragment a clustered grain into its basic components that would be consequently sublimated by IFE processes. The importance of CE versus IFE is uncertain. Waxman & Draine argue that the tensile strength of submicron grains is typically high enough ( dyn cm-2) that IFE is likely to dominate over CE in highly charged grains. Fruchter et al. however consider that the intense flux bombarding the grains is likely to damage the crystalline structure of the grains themselves, therefore reducing their tensile strength. Draine & Hao further argue that “while chemical bonds will undoubtedly be disrupted by ionization, it seems likely that chemical bonds will be promptly reestablished in the warm grain, i.e. ’annealing’ will take place”. In this case the grains would be able to sustain IFE. Here, following Draine & Hao, we assume that CE does not play a relevant role, and IFE is the only mechanism responsible for dust destruction of grains charged by high energy photons.
The ionization rate of the grain, taking into account the potential barrier, is:
| (10) |
where the rightmost term holds for the idealized optically thin cloud and power-law spectra. We also assume that the energy that is transferred to the grain by the photoelectron is negligible. As a matter of fact, as the photoelectron travels inside the grain, it interacts with the atoms and molecules and can lose energy mainly through collisional ionizations. Adopting a cross section for collisional ionization of cm2 for electrons with several keV, we find that the energy loss is significant if cm. In practice, this can result in an increase of the threshold frequency that increases the efficiency of X-ray heating of the larger grains. We have not included this effect in our numerical calculations.
Let be the total ionization of the dust grain, which will then have a total charge and a surface electric field , where is the proton charge. If we impose that the value of has to be constant, we obtain
| (11) |
i.e. a decrease of must be followed by a decrease of the total charge of the grain . This means that the emission of a photoelectron will be, on average, followed by the emission of more than one single ion666It is also possible that a single highly ionized atom is emitted to balance the grain potential. We neglect this possibility, and note that the difference is small, as long as the grain has a radius cm.. If is the total number of atoms of the grain, we have
| (12) |
and, assuming a uniform grain
| (13) |
Combining Equations (12) and (13) we obtain, for the rate of grain erosion due to IFE only
| (14) |
Note that the coefficient in the above equation is always positive, and that with a crude approximation, one can assume that for all the cases of interest. This, combined with the above equation (10), would give an exponential decay of the radius of the particle with time (if the dependency of on is neglected).
2.3 Dust destruction
The results from §2.1 and §2.2 allow us to write the differential equation governing the evolution of the radius of the dust grain under the combination of UV and X-ray heating and IFE.
It is likely that, when thermal sublimation is active, the grain will be kept neutral since the ions, which have lower binding energy, will be sublimated as soon as they are created. Thermal sublimation will therefore completely quench the IFE process. The equation governing the grain size evolution therefore reads:
| (15) |
where the parameters are , and for silicates and , and for graphite (Guhathakurta & Draine 1989). The conditions in the right side of Eqs. (15) state that the equation in the second line should be used when the rate of thermal sublimation of atoms is larger than the rate of ionization and vice versa.
The temperature of the grain must be computed self-consistently, with the balance equation:
| (16) |
where is defined by the second line of Eq. (15) when X-ray/UV sublimation dominates, and is the Planck-averaged absorption efficiency. Waxman & Draine (2000) provided an approximate analytical expression for this quantity. This is shown, for various grain sizes and for both silicates and graphite, in Figure 2, where it is compared to the results derived in the detailed calculations by DL (thick lines in the figure). As our code follows the evolution of the grain distribution, we need to have an accurate evaluation of the Planck-averaged absorption efficiency as a function of the grains size and temperature. However, we found that the use of interpolation of the DL data in computing during the simulations was significantly increasing the running time of the simulations. Therefore, we have developed a more accurate analytical approximation for , which is compared to the numerical results by DL and to the approximation by Waxman & Draine (2000) in Figure 2. The details of the approximations are provided in Appendix A.
When IFE is dominant (or becomes so), we neglect the number of ionizations that are necessary to bring the grain above threshold. If the fluence of the ionizing continuum is large enough to make IFE efficient, this is only a minor correction, since the number of ionizations that a grain must undergo to reach the threshold is small compared to the number of ionizations required to destroy the grain, . The condition for IFE to be able to sublimate a grain can be expressed as
| (17) |
where is the duration of the ionizing continuum. If we consider a graphite grain under the ionizing flux of a luminous GRB that produces a total energy in the [1 eV–100 keV] range erg with a spectral index , the condition becomes pc for IFE to destroy completely a grain with initial radius . In most cases, the grain will be therefore sublimated by thermal effects, even though small grains at large radii will be destroyed by IFE. For this reason, not only the dust is sublimated, but the size distribution of dust grains can be largely affected by the burst photons (see paper II).
We also assume that the recombination of free electrons onto charged dust grains is negligible. This is justified by the fact that, for any reasonable free electron density, the recombination rate is much smaller than the ionization rate (Fruchter et al. 2001).
Figures 3 and 4 show the relative importance of the three effects discussed above (i.e. UV heating, X-ray heating and IFE) in determining the time evolution of the dust grain. This is shown for various degrees of hardness of the photon spectrum and for both the silicate and the graphite grain. As a general feature, grains at small distances will be sublimated, while grains very far from the photon source will be eroded by the ion field emission process. This is due to the fact that, as already noted by Waxman & Draine (2000), outside a certain radius the grain temperature is not large enough to sublimate the dust particles and IFE, which is effective also at very large radii, sets in (note that the figures have been produced with unlimited fluence, so that there is no constraint on the duration of the ionizing continuum; cfr. Eq. 17). In addition, harder spectra make X-ray heating and IFE more effective due to the larger ratio of X-ray over UV photons.
3 Transfer of dust into gas
Let be the initial number density distribution of grains of type within the region surrounding the source. Let be the amount of size reduction in the time interval due to the combined processes of sublimation and ion-field emission of a grain of size at position within the region. The mean number of molecules within is given by777As a matter of fact, the process of dust destruction occurs mostly through emission of single atoms and radicals (e.g. MgO+, SiO+, FeO+ for the olivine-type silicates). However, as it is not possible to know which particular atoms or radicals are ejected within a particular time interval , we simply assume that the average number of atoms of a given species ejected during a given time is proportional to the mean number of molecules contained within the destroyed grain volume, times the number of atoms of the given species within each molecule (which is basically the long-term mean value of the number of ejected atoms of each given species).
| (18) |
where is the molecular density: and for the olivine-type silicates. Hence the number density of molecules released within the time at position is given by
| (19) |
where is the number density of grains at time and position .
We divide the range of grain sizes in bins of size between and . At , the initial grain distribution is
| (20) |
having assumed that the initial distribution is the same at all radii before the source of radiation turns on. The evolution of the number density distribution of grains of type is given by
| (21) |
for all the grains of size which satisfy . Basically, what Equation (21) says, is that the number density in the -th size bin at time is equal to the sum of the initial number densities for all of the size bins for which the decrease in size brings the corresponding grains into the -th bin.
Let now be the number of atoms of element X in each of the molecules that make up the dust grains. The increase in the abundance of element X at position within the time is given by
| (22) |
where is the number density of H nuclei (i.e. number of protons). The corresponding increase in the abundance can then be written as
| (23) |
The new atoms are assumed to be singly-ionized. In fact, the average charge per atom at threshold is smaller than unity: . On the other hand, neutral atoms will not experience any stress due to the grain charge and, therefore, singly ionized atoms (or radicals) will be ejected.
Defining the fractional increase in the abundance of element X, , the concentrations of the ions “” of element X at position and time are
| (24) |
for the concentration of the singly-ionized element X, and
| (25) |
for the concentrations of all the other ions (i.e. ).
The initial abundances of the elements are assumed to be
| (26) |
where is the fraction of element X that is depleted into dust.
4 Initial Distribution of Dust Grains
We consider a power law distributions of grains888The code can handle any initial distribution of grain sizes. Here we adopt a power law distribution as this is a good approximation for dust in our Galaxy, and no much information is available on the shape of the distribution in other galaxies.
| (27) |
For extinction produced by the Galactic ISM, Mathis et al. (1977) showed that a good approximation is obtained by taking the power law index to be in the size range , , and for a mixture of graphite and silicate grains999Whereas this is the typical distribution for our Galaxy, it might not be the best representation of the grain distributions for dense environments, where grain coagulation might lead to more shallow slopes. However, as there is no information of what might be a “typical” value of depending on the density, we adopt here the more well-known Galactic value, and perform a more complete study of the opacities for various grain distributions in paper II.. The total mass contributed by dust by the distribution (27) is
| (28) |
This yields a dust-to-gas ratio (defined as the ratio between the total mass in dust and the total mass in hydrogen)
| (29) |
With the grain densities g cm-3 and g cm-3 (Draine & Lee 1984; Laor & Draine 1993) respectively for silicates and graphite, the mass ratio between the two species of grains is given by
| (30) |
Using Equations (29) and (30), we can then write
| (31) |
and
| (32) |
With the adopted values of , and , we have g-1 cm0.5, cm2.5 and cm2.5.
At this point, we can compute the fraction of the elements depleted into dust before the effects of the photoionizing field,
| (33) |
for Carbon, that makes up graphite, and
| (34) |
for each of the elements X that make up the silicates. In the above equations, and are the mass numbers (i.e. ) of graphite and silicates, respectively. Therefore, we have and .
As previously noted, we indicate by the number density of H nuclei; therefore, for a cloud whose initial composition is a mixture of both atomic and molecular Hydrogen, we take
| (35) |
5 H and H2: Opacites and Photoionization Rates
The code allows for any fraction of Hydrogen to be initially in its molecular form, H2. We follow the processes of photoionization of H2, photoionization and photodissociation of H, and photoionization of H. Line absorption is included for Hydrogen but not for H2 and H. A detailed study of the trasmission spectrum of H2 can be found in DH. Here we remark that neglecting the opacity due to line absorption by H2 does not affect much the propagation of the various destruction fronts, as strong line absorption by H2 occurs in a relatively narrow energy range ([11.2, 13.6] eV, see e.g. DH). Opacities for the absorption lines of atomic H are included.
In more detail, as the ionization front propagates, rates and opacities for the following processes are computed:
5.1 Photoionization of H2: H H
We adopt the cross section for photoionization of H2 derived by Yan, Sadeghpour & Dalgarno (1998):
| (36) | |||||
| (37) | |||||
| (38) | |||||
where and .
5.2 Photodissociation of H: H HH
We adopt the fit derived by DH to the photodissociation cross section found by von Bush & Dunn (1972) after averaging over the H vibrational distribution:
| (39) |
5.3 Photoionization of H: H 2H
We use the photoionization cross section calculated by Bates & Opik (1968)
| (40) |
5.4 Photoionization of H: H H
Finally, for photoionization of atomic hydrogen, we use the cross section (Osterbrock 1989)
| (41) |
5.5 Photoionization rates
Due to computational limitations, the radial grid over which the radiative transfer is made will often have to be optically thick to the processes described above when the region of study is very dense. To deal with this problem, we adopt the numerical procedure developed by DH; i.e. we choose the shell tickness such that an individual shell is optically thin in dust and in the elements heavier than H, but it might be opaque to photoionization of H2 and H, and to photodissociation and photoionization of H. Rates for these processes are computed using the modified expressions
| (42) |
where is the shell volume, is the optical depth arising in the shell from to (see Eq. 45), and is the optical depth up to radius (see Eq. 47).
6 Evolution of Metals
Besides Hydrogen, our code includes the 12 most abundant astrophysical elements, i.e. He, C, N, O, Ne, Mg, Si, S, Ar, Ca, Fe, Ni. Their abundances are taken from Anders & Grevesse (1989). We denote the local number densities of the ions of the various elements by , where the superscript characterizes the element and the subscript identifies the ionization state. At , the ionization fractions of the elements are assumed to have their equilibrium value for an initial temperature101010The evolution of the plasma is rather insensitive to the precise value of given that when the plasma is illuminated by the source it reaches a temperature . K. When the source turns on, the abundances of the ions of the various elements are updated by solving the system of equations
| (43) |
The and are respectively the photoionization and collisional ionization coefficients of ion , while is the recombination coefficient. Note that refers to inner shell photoionization followed by Auger ionization. The collisional ionization rates are calculated according to Younger (1981). We compute the terms due to photoionization by integrating numerically. The recombination rates are given by the sum of the radiative and dielectronic recombination rates. The radiative recombination process is the inverse of photoionization, so the rates to the ground states are computed from the photoionization cross section with the help of the detailed balance relation. Hydrogenic rates are used for radiative recombination to excited levels. The dielectronic recombination rates are taken from Burgess (1965) with modifications to take more recent calculations into account. Most important is the reduction due to autoionization to excited states (Jacobs et al. 1977), with an appropriate treatment of the weakening of this effect at higher (Smith et al. 1985). Since we are dealing with a non-equilibrium situation, the ionization states of the elements are calculated within the program itself and updated at each position of the radial grid at each time step. Photoionization heating and radiative cooling are calculated within the same code, and used to update the temperature of the plasma as a function of position and time.
7 Radiative Transfer and Optical Depth
We consider a region surrounding the GRB site of size and medium density , and we split it up into a radial grid with steps . In propagating from a point at position to another point at position , the afterglow flux is reduced according to
| (44) |
where is in units of and is the total optical depth due to the shell at position , of width , and at time . This opacity, at a given frequency , is produced by the contribution of various processes: absorption by H, H2 and H, absorptions by metals not in dust grains, and absorption by dust, that is:
| (45) |
where is the total optical depth (which includes photoabsorption and line absorption) of the ion of element (for H, H2 and the other 12 elements included in our code). The photoionization cross sections are taken from Reilman & Manson (1979).
The contribution to the opacity by dust within a shell of width at radius and time is given by
| (46) |
The indices in the above equation indicate the two types of dust grains that we are considering here, i.e. silicate and graphite. The terms and are the efficiency factors for absorption and scattering, while is the scattering asymmetry factor (see Laor & Draine 1993 for more details). All these quantities depend on both the energy of the incident radiation and the size of the grains. A detailed computation has been performed by Draine & Lee (1983) and Laor & Draine (1993), based on both theoretical calculations and on the results of laboratory experiments. We used their tables (see above for access information) to build grids in , over which a bilinear interpolation is performed to determine the various coefficients for each type of grain at the needed energies and sizes. The total optical depth up to the shell at radius is given by
| (47) |
With the inclusion of the optical depth in the trasmitted flux, the temperature of the grains in the middle of the radial shell is determined by numerically solving Eq. (16) with the substitution .
8 Results
In this section we show results of our numerical simulations for a standard galactic dust law (that is with as power of the initial grain distribution) and all Hydrogen in its atomic phase. The behaviour of the opacities for various initial fractions of Hydrogen in molecular phase and for different grain distributions will be discussed in a following companion paper (paper II).
8.1 Destruction fronts
Figure 5 shows the photoionization front of Hydrogen and the distruction fronts of both the silicate and the graphite grains. The dust-destruction fronts are determined by finding the radius at which there has been complete sublimation of the largest grains in the distribution. In all cases, notice that the destruction front of graphite lags behind that of silicate. This is because graphite is more difficult to sublimate (see the difference in the value in Sect. 2.3).
The three panels in Figure 5 show the evolution in different environments, which are all characterized by the same initial column density () and extinction ( mag), but by different densities and sizes of the absorbing region. The denser the region is, the more the destruction of dust is efficient with respect to photoionization. This is because, for the range of densities under consideration, the regions through which the radiation front passes are very optically thick to photoionization of Hydrogen, but not much optically thick to dust. Therefore, as the density increases, the radiation front of Hydrogen is slowed down more than that of dust destruction.
In the bottom panel of Figure 5, the absorbing region is a dense and compact molecular cloud, with particle density cm-2 and size cm-2. Here, for the assumed illuminating spectrum (with normalized so that the [1eV - 100 keV] luminosity is erg/s), we find that the destruction fronts of both the silicates and graphite proceed well ahead of the Hydrogen photoionizing front. The separation between the dust and the Hydrogen fronts is reduced in the case of a larger ( cm) but less dense ( cm-2) region, which is shown in the middle panel of Figure 5. This trend continues at lower density, as it can be seen in the top panel of Figure 5, where the photoionizing front has been propagated through an even larger ( cm) but less dense ( cm-2) region.
8.2 Metal recycling from dust into gas
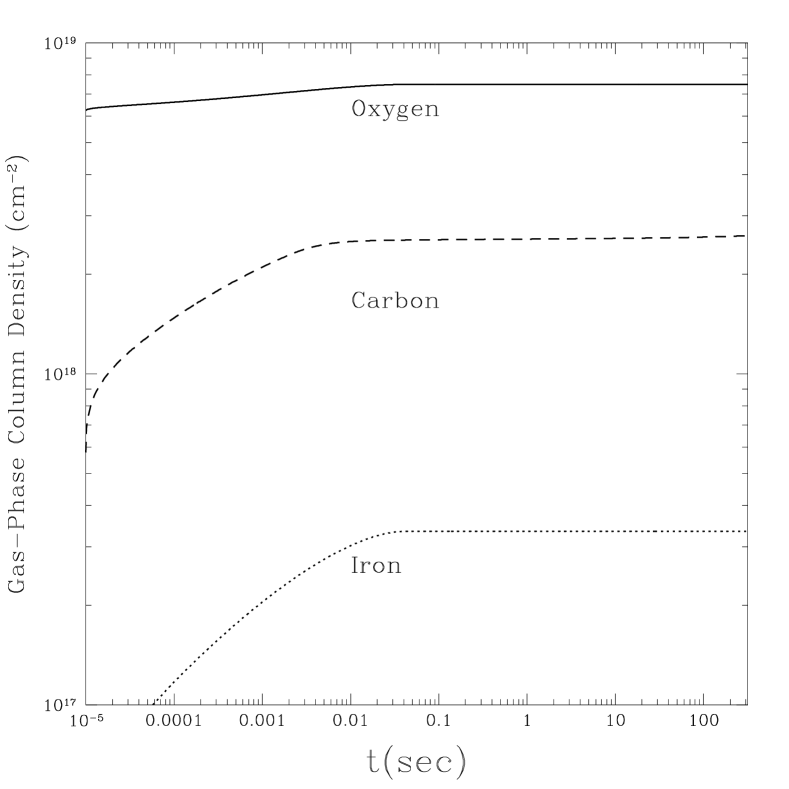
As explained in §3, our code follows both in space and in time the fraction of dust-depleted metals that is in dust and in gas. As the destruction fronts propagate, dust-depleted metals are being recycled into gas. The bottom panel of Figure 6 shows the radial dependence of the abundance of Fe (being released by the destruction of the silicate grains) in gaseous phase at three different times during the passage of the ionizing flux. In the top panel of the same figure, the abundance of C (which is released during the destruction of the graphite grains) is shown at the same times. In both cases, the absorbing region considered is that correponding to the middle panel of Figure 5, that is a region with density cm-3 and radius cm. For this same situation, Figure 7 shows the total columns densities of O, Fe and C in gaseous phase as a function of time. Most of the dust mass at a given radius is recycled before the dust destruction front reaches that radius. This is because the smallest dust grains are sublimated away on a much shorter time scale than the largest grains (whose complete sublimation defines the position of the dust destruction front), and for the steep galactic grain distribution () that we have adopted here, a good fraction of the dust mass is indeed in the small grains.
From the point of view of observations, the recycling of metals from dust grains into gas can produce observable consequences. For example, the grains are optically thick in the UV regime, and therefore the ionization of the high level electrons of metals in dust grains will be slower than for metals in the gas phase. As a consequence, absorption lines from intermediate ionization states of Mg, Fe and Si are observable for a longer time in a dusty environment than in a pure gas. In principle, one may even be able to disentangle small dust grains from big grains due to the fact that the big grains, being thicker, are more efficient in screening the entrained metals from the radiation field. A good candidate line for this test is the Si IV doublet at 1394 Åand 1402 Å, which has an ionization potential of eV. At larger energies, that are relevant to X-ray observations, the grains are usually optically thin to radiation (if extremely large grains are not considered). In this case, distinguishing whether a metal is in dust or in gas is observationally more challenging, especially given the lack of detailed calculations of the photoabsorption cross sections of atoms bound in molecules (e.g. Paerels et al 2001).
8.3 X-ray vs. optical extinction
Optical and X-ray extinction are the two main observable quantities which, once determined through spectral fitting to the data, can be used to set constraints on the type of environment surrounding the source. The optical extinction is typically quantified in terms of , the extinction in the V band, while the X-ray extinction is quantified through the effective Hydrogen column density, , usually measured under the assumption of solar abundances and cold (i.e. neutral) material. Even though the ratio between the effective Hydrogen column density inferred from optical extinction, and that inferred from X-ray extinction, , cannot be used to infer metallicities in the absorbing region (as both scale with metallicity roughly in the same way), however, they can be used to calibrate the dust-to-gas ratio, (defined in Eq. 29). In fact, whereas optical extinction is very sensitive on whether metals are in gaseous phase or depleted into dust, X-ray absorption is almost completely insensitive to it111111There are small variations in energy of the positions of the absorption edges if the metals are bound into molecules (as in dust grains) rather than being in gaseous phase. However these affect very little the overall amount of absorption..
In this section, we study the time-dependent evolution of both the X-ray and the optical extinction under the influence of a strong radiation field and for different types of environments (i.e. various densities, sizes of the absorbing regions). It should be remarked that the assumption here is that most of the observed absorption, both in X-ray and in optical, is due to the immediate circumburst environment. Clearly, if our line of sight to the source passes through a dense cloud with density much higher than the one in the burst vicinity, then the time variable effects in the opacities that we will describe in the following will not be detectable, or they will be small corrections to the overall extinction.
Following Lazzati & Perna (2002) (but see paper III for a more detailed treatment of X-ray continuum opacity), we parameterize the time-dependent X-ray extinction through the effective Hydrogen column density
| (48) |
where the symbol represents the average over the frequency range [1–10] keV. The optical extinction, , is computed as
| (49) |
where is the outgoing flux in the V band at time , while is the flux at the same time that would be observed if there were no extinction.
Figure 8 shows the time evolution of the X-ray and optical absorption (computed as described above) for the types of environments considered in Figure 5. In all three cases the initial column density of cold gas and of dust is the same, but its distribution is different. The general trend for both the X-ray and optical extinction is that of a faster decline for a more compact, denser region. This effect had been originally observed by Perna & Loeb (1998) in their study of the time variability of the opacity of a single line. It is simply due to the fact that, for a given source luminosity, the closer the material is to the source, the more easily it is ionized due to the more intense flux to which it is exposed.
Whereas the general trend in the time variability with density and compactness of the absorbing region is the same for both X-ray and optical extinction, the extent to which they vary depending on the characteristics of the region is different, and this bears important consequences for studies of the GRB environments that are based on a comparison of the X-ray and optical extinction (e.g. Galama & Wijers 2000). In a small and compact region (top panel of the figure), dust destruction is more efficient than photoionization and, as a result, an observer that were to measure and from afterglow fitting at later times121212By “later times” here we mean the times after which the most intense X-ray UV radiation from the burst has passed through the region (on the order of several tens to several hundreds of seconds). The later X-ray UV afterglow radiation would not further affect the opacities much. It is however critical, especially if the UV range is concerned, the assumption that an optical-UV flash is present in all GRBs. Should this be false, the fluence of the afterglow in the UV would be larger than that of the burst, and the late afterglow radiation may still be important to modify the ionization stage of the ISM. would infer a dust-to gas ratio which is lower than the real value prior to the burst occurrence. On the other hand, as the density becomes lower, photoionization starts to become gradually more efficient with respect to dust destruction, and in this case an observer taking measurements at later times would infer a dust-to-gas ratio that is larger than the real value. This effect is explicitly shown in Figure 9, where we plot the ratio between the optical and the X-ray opacity for the same types of environments and illuminating spectrum considered in Figure 8. The general trend is that of (where represents the value that would have been observed had not the source altered the status of the medium) for a short-duration burst and high densities, while for a source of longer duration and lower circumburst densities. Note that the rapid increase in the ratio at sec for the case cm-3, cm is due to the fact that the Hydrogen ionization front has reached the boundary of the region while the dust front is still lagging behind (see Fig.5). It should however be emphasized that in this case a prominent iron edge should be detected in the X-ray spectrum, since the iron ionization front is inevitably lagging behind the dust destruction one.
The trend for photoionization to become less efficient with respect to dust destruction as the density increases, is further illustrated in Figure 10, where the initial density of cold material is cm-2, distributed over a region of radius cm. Comparing the evolution of the destruction fronts and the extinctions with the middle panel of Figures 5 and 8 (which are calculated for a region of the same size but with density 50 times smaller), it can be seen that the difference between the amount of extinction in X-ray and in optical is further enhanced.
In all the simulations presented so far, we have assumed an incident power-law spectrum , with , while examining the behaviour of the low and high-energy opacities in various types of environments. In Figure 11, we explore the time variability of the opacities under the effects of a softer incident continuum, with . A softer spectrum accelerates the destruction of dust more than the photoionization of the gas. This is due to the fact that, for , the dominant dust destruction mechanism is UV thermal sublimation (see Fig. 2 and Fig. 3), which is essentially dominated by the photons in the [1-7.5] eV range. The variability of the soft X-ray absorption , on the other hand, is tied to the photoionization of Hydrogen131313This is due to the fact that the second ionization potential (i.e. the ionization potential of the singly ionized atom) of metals that mostly contribute to the [1-10] keV absorption, such as Fe, is close and above 13.6 eV, and therefore, unless the absorbing region is very optically thin, the photoionization of these heavier elements follows that of Hydrogen., which depends on the number of photons above 13.6 eV. Therefore, the softer the spectrum (hence the larger the ratio between the photons in the [1-7.5] eV range and those above 13.6 eV), the easier it is to destroy dust with respect to Hydrogen.
The ratios between the optical and X-ray opacities, for the same types of environments and illuminating spectrum considered in Figure 11, are shown in Figure 12. Again, the general trend is that of for a short-duration burst and high densities, while for a source of longer duration and lower circumburst densities. However, with respect to the case , the switch from to occurs for lower circumburst densities. This is due to the increase in the efficiency of dust destruction with respect to H photoionization for softer spectra, as explained above.
9 Observational Perspectives
An important issue is whether the time-dependent effects in the opacity predicted and discussed in this paper and the two accompanying papers are detectable with present or future instrumentation. Lazzati & Perna (2002) have shown that the effect of the evaporation of the soft X-ray absorption is observable with current instrumentation in GRBs if they explode in overdense regions within molecular clouds. Indeed, albeit not extremely statistically compelling, the effect is possibly observed in at least two GRB lightcurves. In the near future, with BeppoSAX turned off and the soft X-ray camera on board HETE-2 damaged, it is hardly possible that any better data will be acquired. The situation is however likely to change with the launch of the Swift satellite, forseen in 2003. This satellite, in fact, will have for the first time an X-ray telescope, equipped with CCD detectors, capable of repointing the location of a GRB in a timescale of several dozens of seconds. In few cases, this repointing should be made in even less time. Thanks to the high spectral and temporal resolution of the X-ray telescope-CCD system, high quality data will be available to compare with the models and confirm (or invalidate) the preliminar results of LP02. The capabilities of this instrument, moreover, should allow not only to follow the broad band X-ray absorption, but also to track any individual absorption feature present in the spectrum (Amati et al. 2000; Lazzati et al. 2001; Lazzati, Perna & Ghisellini 2001).
As for optical observations, the perspectives are even more optimistic. Optical and NIR observations of afterglows are performed now regularly, with a reaction time that is decreasing with time. Even though very accurate optical light curves are available for a number of GRBs, in the NIR the data are still sparse and the existence of a dust-to-gas ratio problem is still under debate (Galama & Wijers 2000; Stratta et al. 2002). In addition to that, it is clear from the discussion above that the effects we describe in this paper are evident in the early stages of the GRB history, where data in the optical and NIR range are still unavailable. Again the situation is going to change within two years, when Swift will be launched. The optical telescope on board Swift will in fact provide optical and UV photometry and spectra since the early stages of the afterglow, if not during the GRB itself (the timescale for repointing the optical telescope is the same as for the X-ray one). In addition, robotic NIR telescopes from the ground are planned (see e.g. the REM telescope, Zerbi et al. 2002). These telescopes will provide NIR photometry on the same short timescale as the optical one, allowing for studies on the evolution of the dust opacity and reddening.
In conclusion, the quality of data that will be available in the near future seems to be perfectly suited for the comparison of the observations with the prediction of our models, allowing to understand whether GRBs truly explode within molecular clouds and/or dense regions, and allowing a study of the properties of these regions in high redshift galaxies.
10 Summary
The discovery of the bright GRB longer-wavelength counterparts, in particular in X-ray and UV, has brought up the problem of simultaneous photoionization and dust destruction under an intense radiation field. We have tackled the problem in this paper, and the principal results of our work are the following:
-
•
We have generalized the mathematical formulation of the dust destruction mechanisms under an intense radiation field to include the process of ion field emission, and we have discussed its relative importance with respect to X-ray and UV sublimation as a function of grain size, intensity and hardness of the incident spectrum.
-
•
We have developed a time-dependent radiative transfer code that simultaneously follows and combines the process of dust destruction through UV/ X-ray sublimation and through IFE with the evolution of the ionization states of metals due to photoionization and their relative radiative transitions. The code keeps track of the relative fractions of metals in gaseous and in dust-depleted phase as a function of space and time, and, as such, it follows the gradual recycling into gas of metals while dust is being destroyed.
The code allows for any initial distribution of grain sizes and any value for the dust-to-gas ratio and uses, through interpolation, the tabulated opacities computed by Draine & Lee (1983). To reduce the running times of the simulations, we have developed (and provided in the Appendix) an approximate expression for the Planck averaged absorption opacity that reproduces the numerical results by Draine & Lee within in the range of grain sizes and temperatures K.
-
•
We have applied our code to show how GRBs affect the inferred X-ray and optical extinction depending on the type of environment, and how monitoring these quantities during the GRB event can provide powerful clues on the characteristics of the environment itself. In fact, we have shown how a measurement of X-ray absorption, , and optical extinction, , at a single time can yield dust-to-gas ratios that are either lower or higher than the real value, depending on the density and size of the absorbing region, which determines the relative reduction in the high and low-energy opacities.
Prompt and continuous time monitoring of the opacities in various bands will be soon possible with Swift and REM.
Whereas a knowledge of the type of environment in which GRBs occur is relevant for constraining GRB progenitors, the inferred metallicites and dust content are particularly important for a fair and comprehensive study of high-redshift galaxies, whose inner and denser cores are inaccessible to QSO absorption studies, and for which GRBs constitute the only probe available so far.
References
- (1)
- (2) Amati L., et al., 2000, Science, 290, 953
- (3) Anders, E., & Grevesse, N. 1989, Geochim. Cosmochim. Acta, 53, 197
- (4) Bates, D. R., Opik, U. 1968, J. Phys. B, 1, 548
- (5) Böttcher M., Dermer C. D., Crider A. W., Liang E. P., 1999, A&A, 343, 111
- (6) Burgess, A. 1965, ApJ, 141, 1588
- (7) Done, C., Mulchaey, J. S., Mushotzky, R. F., & Arnaud, K. A. 1992, ApJ, 395, 275
- (8) Draine, B. T., & Salpeter, E. E. 1979, ApJ, 231, 77
- (9) Draine, B. T., & Lee, M. H. 1984, ApJ, 285, 89
- (10) Draine, B. T. 2000, ApJ, 532, 273
- (11) Draine, B. T. & Hao, L. 2002, ApJ, 569, 780
- (12) Fall, S. M. & Pei, Y. C. 1993, ApJ, 402, 479
- (13) Fruchter, A., Krolik, J. H. & Rhoads, J. E. 2001, ApJ, 563, 597
- (14) Galama, T. & Wijers, R. A. M. J. 2001, ApJ, 549, 209
- (15) Guhathakurta, P., Draine, B. T. 1989, 345, 230
- (16) Jacobs, V. L., Davis, J., Kepple, P. C., Blaha, M. 1977, ApJ, 211, 605
- (17) Laor, A. & Draine, B. T. 1993, 402, 441
- (18) Lazzati, D., & Perna, R., 2002, MNRAS, 330, 383
- (19) Lazzati, D., Perna, R., & Ghisellini, G. 2001, MNRAS, 325, L19
- (20) Lazzati, D., Ghisellini, G., Amati, L., Frontera, F., Vietri, M., & Stella, L. 2001, ApJ, 556, 471
- (21) Mathis, J. S., Rumpl, W. & Nordsieck, K. H. 1977, ApJ, 217, 425
- (22) Morrison R., McCammon D., 1983, ApJ, 270, 119
- (23) Muller, E. W., & Tsong, T. T. 1969, Field Ion Microscopy (New York: American Elsevier)
- (24) Osterbrock, D. E. 1989, Astrophysics of Gaseous Nebulae (Mill Valley: University Science Books)
- (25) Paerels, F. et al. 2001, ApJ, 546, 338
- (26) Perna, R., & Loeb, A. 1998, ApJ, 501, 467
- (27) Perna, R., Raymond, J., & Loeb, A. 2000, ApJ, 533, 658
- (28) Perna, R., & Raymond, J. 2000, ApJ, 539, 706
- (29) Piro, L. et al., 2002, ApJ submitted astro-ph/0201282
- (30) Reilman, R. F. & Manson, S. T. 1979, ApJS, 40, 815
- (31) Salpeter, E. E. 1977, ARA&A, 15, 267
- (32) Savaglio, S., Fall, M. S. & Fiore, F. 2002, ApJ submitted, astro-ph/0203154
- (33) Smith, B. W., Mann, J. B., Cowan, R. D., Raymond, J. 1985, ApJ, 298, 898
- (34) Stratta, G. et al. 2002, ApJ submitted
- (35) Verner, D. A., Yakovlev, D. G. 1995, A&AS, 109, 125
- (36) von Bush, F. & Dunn, G. H. 1972, Phy. Rep A, 5, 1726
- (37) Waxman, E.; Draine, B. T. 2000, ApJ, 537, 796
- (38) Yan, M, Sadeghpour, M. R. & Dalgarno, A. 1998, ApJ, 496, 1044
- (39) Yoshida, A., et al. 1999, A&AS, 138, 433
- (40) Younger, S. E. 1981, JQSRT, 26, 329
- (41) Zdziarski, A. A., Johnson, W. N., Done, C., Smith, D., & McNaron-Brown, K. 1995, ApJ, 438, L63
- (42) Zerbi, F. M. et al. 2001, Gamma-Ray Bursts in the Afterglow Era, Proceedings of the International workshop held in Rome, CNR headquarters, 17-20 October, 2000. Edited by Enrico Costa, Filippo Frontera, and Jens Hjorth. Berlin Heidelberg: Springer, 2001, p. 434., 434
- (43)
APPENDIX
Appendix A Analytical approximation to the Planck averaged absorption efficiency.
We have approximated the Planck averaged absorption efficiencies for graphite and silicates according to the formula:
| Silicates () | Silicates () | Graphite () | Graphite () | |
|---|---|---|---|---|
| -4.85149 | -1.85901 | -4.79986 | -1.28807 | |
| 1.85976 | 1.55835 | 1.85669 | 1.18097 | |
| 6.53714 | 6.43232 | -6.44955 | -1.15262 | |
| -25.9463 | -19.4323 | 3.39539 | -0.370281 | |
| 24.7076 | 19.4393 | 1.28638 | 2.72991 | |
| -9.83150 | -8.11878 | -1.72185 | -1.76088 | |
| 1.73114 | 1.51996 | 0.529988 | 0.461037 | |
| -0.109282 | -0.104343 | -0.0507216 | -0.0419332 | |
| -16.1694 | -9.36205 | -4.58258 | -0.975760 | |
| 4.06422 | 2.90181 | 1.46046 | 1.09774 |