An XMM-Newton Observation of NGC 1399 Reveals Two Phases of Hot Gas and Super-Solar Abundances in the Central Regions
Abstract
We present an initial analysis of a new XMM observation of NGC 1399, the central elliptical galaxy of the Fornax group. Spectral fitting of the spatially resolved spectral data of the EPIC MOS and pn CCDs reveals that a two-temperature model (2T) of the hot gas is favored over single-phase and cooling flow models within the central kpc. The preference for the 2T model applies whether or not the data are deprojected. The cooler component has a temperature ( keV) similar to the kinetic temperature of the stars while the hotter component has a temperature ( keV) characteristic of the virial temperature of a halo. The two-phase model (and other multitemperature models) removes the “Fe Bias” within kpc and gives . At larger radii the iron abundance decreases until for kpc. The Si abundance is super-solar (1.2-1.7 solar) within the central regions while over the entire region studied. These Fe and Si abundances imply that of the Fe mass within kpc originates from Type Ia supernovae (SNIa). This SNIa fraction is similar to that inferred for the Sun and therefore suggests a stellar initial mass function similar to the Milky Way.
1 Introduction
NGC 1399, the central galaxy of the Fornax group, is one of the brightest elliptical galaxies in X-rays and has been the subject of numerous X-ray studies. Although previous ROSAT and ASCA studies demonstrated that the hot gas within kpc is not isothermal (e.g., Rangarajan et al., 1995; Jones et al., 1997; Buote, 1999), the data could not distinguish between single-phase and multiphase models. Moreover, we showed that an “Fe Bias” for systems like NGC 1399 occurs if an isothermal gas is assumed when in fact the spectrum consists of multiple temperature components with values near 1 keV (e.g., Buote, 2000b, a). We argued that this bias is primarily responsible for the very sub-solar Fe abundances found in the central regions of the (X-ray) brightest ellipticals and groups.
The combined spatial and spectral resolution of the XMM CCDs allows for unprecedented mapping of the temperatures and elemental abundances of the hot gas in galaxies, groups, and clusters. These capabilities complement the high spatial resolution () of Chandra which has already provided interesting constraints on the emission from discrete sources near the center of NGC 1399 (Angelini et al., 2001). The higher energy resolution, sensitivity, and larger field-of-view of the XMM EPIC CCDs are better suited for constraining the spatial and spectral properties of the diffuse hot gas out to radii well past the optical extent of the galaxy (i.e., out to kpc assuming a distance of 21 Mpc using the results of Tonry et al. (2001) for km s-1 Mpc-1).
2 Spatial-Spectral Analysis
NGC 1399 was observed with the EPIC pn and MOS CCD cameras for approximately 25 ks and 30 ks respectively during AO-1 as part of the XMM Guest Observer program. We generated calibrated events lists for the data using the standard SAS v5.3.0 software. Our data preparation closely follows standard procedures and will be described fully in a follow-up paper (Buote et al., 2002).
We extracted spectra in concentric circular annuli located at the X-ray centroid of each detector. The widths of the annuli were the same for each detector and were defined such that the width of each annulus contained approximately 6000 background-subtracted counts in the 0.3-5 keV band in the MOS1, and the minimum width was set to for PSF considerations. Obvious point sources were masked out before the extraction.
In each annulus we performed a simultaneous fit to the MOS1, MOS2, and pn spectral data over 0.3-5 keV. Our baseline model (1T) consists of a single thermal plasma component using the apec code modified by foreground Galactic absorption ( cm-2) using the phabs model in xspec v11.1.0v. The free parameters are all associated with the plasma component: temperature (), normalization, and Fe, O, Mg, and Si abundances – all other elements tied to Fe in their solar ratios except for S which is tied to Si in their solar ratio. (The normalizations for the MOS1 and MOS2 are tied together while that of the pn is varied separately because of residual calibration and background differences.) We obtained results for the 1T model fitted directly to the data projected on the sky (i.e., 2D model) and also fitted to the deprojected data (i.e., 3D model) (e.g., Buote, 2000a).


| 1T | 2T | |||||
|---|---|---|---|---|---|---|
| Annulus | (arcmin) | (arcmin) | dof | dof | ||
| 1 | 0.0 | 1.0 | 1061.3 | 487 | 558.2 | 484 |
| 2 | 1.0 | 2.2 | 700.1 | 520 | 625.5 | 517 |
| 3 | 2.2 | 3.4 | 691.8 | 593 | 657.8 | 590 |
| 4 | 3.4 | 4.7 | 824.4 | 645 | ||
| 5 | 4.7 | 6.5 | 925.3 | 776 | ||
| 6 | 6.5 | 8.2 | 821.1 | 826 | ||
| 7 | 8.2 | 10.1 | 1042.8 | 907 | ||
2.1 Two-Phase Temperature and Density Structure
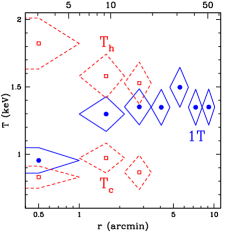
The temperature profile for the 1T (2D) model is displayed in Figure 1. The temperature rises from keV at the center to keV at large radii consistent with previous 2D ROSAT determinations (e.g., Rangarajan et al., 1995; Jones et al., 1997; Buote, 1999). This model is a good fit in the outer annuli but the fit degrades at progressively smaller radii (see Table 1). The worst fit is in the central annulus and, as shown in Figure 2, yields fit residuals near 1 keV that are fully characteristic of those obtained when trying to force a single-temperature model to fit a multi-temperature spectrum (e.g., Buote & Fabian, 1998; Buote, 1999, 2000b). The deviations above 2 keV also suggest the presence of another (higher) temperature component.
Multitemperature spectra in the inner regions, especially the central bin, can arise simply from the projection of hotter gas at larger radius. In this case fitting the 1T model to the deprojected spectra should substantially improve the fits in the central regions. However, we find that this 1T (3D) model does not improve the fits much except at the center, where noticeable – though relatively modest – improvement () is achieved.
We have examined a variety of multitemperature models (2D and 3D) and have found that simple two-temperature models (2T) provide the best fits to the central annuli (Table 1). It is also found that the values are very similar and the derived parameters consistent within their errors for both 2D and 3D versions of the 2T models. And since the parameters of the 3D models are not as well constrained and require regularization of the temperatures and abundances (cf. Buote, 2000a), in the interest of brevity we will emphasize in this letter the results for the 2D models. Detailed results for the 3D versions of 1T, 2T, and other models will appear in Buote et al. (2002).
With respect to the 1T (2D) model, not only does the 2T (2D) model improve the fit substantially within the central bin (), but it also significantly improves the fits in annuli #2 () and #3 (). The dramatic improvement in the central bin is seen in Figure 2 where the large residuals in the Fe L region near 1 keV have been mostly eliminated. In 3D the improvement of 2T over 1T is in the central bin. The other multitemperature models we examined only improved fits to the deprojected spectra in the central bins; e.g., a (constant pressure) cooling flow model consisting of ambient and cooling gas provides a modest improvement to the fit in the central bin () over the 1T (3D) model.
In Figure 1 are shown the temperatures obtained for the 2T (2D) model. The cool component is consistent with an isothermal radial profile while the hot component appears to rise slightly at the center. Within the errors this central rise for the hot component is not especially significant, but if real the slight excess over the isothermal extrapolation from the adjacent annuli probably represents the contribution from hard emission from discrete sources unresolved by XMM but resolved in the Chandra image of NGC 1399 (Angelini et al., 2001). We mention that adding an additional bremsstrahlung component to account for the effect of these unresolved sources (i.e., 2T+BREM) in the central bin does improve the fit slightly and gives a reasonable best-fitting temperature, keV. Adding this component to the cooling flow model instead gives keV indicating an attempt to account for both keV hot gas and keV unresolved sources.
We believe that in addition to the values the derived parameter values also argue in favor of the 2T model. The temperature of the hot component, keV, is consistent with the virial temperature of a surrounding group of mass , whereas the temperature of the cool component, keV, is similar to the kinetic temperature of the stars ( keV) with velocity dispersion, km s-1 (e.g., Jones et al., 1997). The volume-averaged electron density of the cool gas () declines with radius more rapidly than that of the hot component (): for the best-fitting models the ratio is 1.0, 0.62, and 0.27 respectively for shells #1, #2, and #3. (Here we have used the 3D model so that the quoted densities refer to the 3D spherical shells bounded by the same radii as the annuli listed in Table 1.) The cool component is only detected out to annulus #3 (i.e., for kpc) and therefore must contribute even less at larger radius. The radius where the cool (galaxy) component gives way to the hot (group) component is similar to that inferred from the recent analysis of the ROSAT surface brightness profile of NGC 1399 by Paolillo et al. (2002).
Interior to shell #3 we compute a gravitating mass of from each component consistent with previous X-ray (e.g., Rangarajan et al., 1995; Jones et al., 1997; Paolillo et al., 2002) and optical (e.g., Saglia et al., 2000) determinations. The consistency of the masses determined from each phase, and the agreement with optical determinations, indicates that each phase is in approximate hydrostatic equilibrium tracing the same gravitational potential.
Although hydrostatic equilibrium implies subsonic gas motions for each phase, the phases are not in pressure equilibrium. The ratio of the gas pressure in the hot phase to that of the cool phase is in shell #1 which increases to in shell #3. The lack of pressure equilibrium implies that the low-pressure cool phase must be continuously replenished. This requirement is consistent with the scenario where the cool phase continuously receives gas from stellar ejecta and loses gas by eventually mixing with the extended hot phase. Detailed physical models for the two phases (including, e.g., appropriate filling factors) will be considered in a future study.
2.2 Fe Abundance
We take the solar abundances in xspec to be those given by the Anders & Grevesse (1989) table except for Fe where we use the correct “meteoritic” value, by number, as suggested by Ishimaru & Arimoto (1997) and McWilliam (1997). This value is 1.44 times smaller than the photospheric value which is usually employed in X-ray spectral fitting. Consequently, we shall account for this factor when comparing our results to other studies.
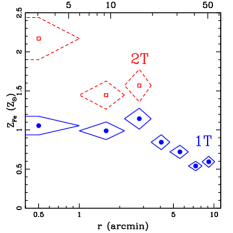
The Fe abundances () obtained for the 1T and 2T models (both 2D) are displayed in Figure 1. (The values of obtained from 2D and 3D 2T models are consistent within 1-2 errors.) At the largest radii the abundance is sub-solar, . It increases for smaller so that within kpc, , for the 1T model similar to previous results for 1T (2D) models fitted to the ROSAT data (e.g., Jones et al., 1997; Buote, 1999).
Compared to the 1T model, the 2T model gives that is 40%-50% larger in annuli #2 and #3 and twice as large in annulus #1. (A cooling flow model, when fitted to the deprojected spectra, produces similarly larger values.) This substantial increase in the value of along with the elimination of the characteristic keV residual pattern (Figure 2) is a manifestation of the “Fe Bias” we have discussed previously for NGC 1399 (Buote, 1999) and related systems (e.g., Buote, 2000b, a). We note that the abundances in each temperature component are tied together in the fits since they cannot be distinguished when fitted separately. Also, the values of deduced in the central bins for both 1T and 2T models differ slightly if intrinsic absorption is considered (which is not clearly required by the data as seen in Figure 2), but the relative differences between the 1T and 2T models and the general finding of super-solar values are preserved.
2.3 Si and S Abundances
Next to the broad feature of Fe L lines near 1 keV, the most notable spectral lines in the EPIC spectra of NGC 1399 (Figure 2) are the K lines of Si and S; i.e., Si XIII He (1.85 keV), Si XIV Ly (2.0 keV), and S XV He (2.45 keV). We find that is generally better constrained than , but when these abundances are fitted separately they inevitably yield values that are consistent within their 1-2 errors. To reduce the number of free parameters in our fits we tie and together in their solar ratio. Henceforth, we shall refer only to the Si abundance.
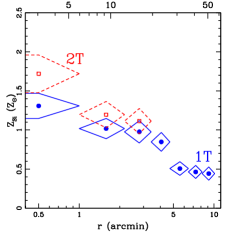
The Si abundance is plotted in Figure 1 for both 1T and 2T models. For the 1T model for kpc, rises to values consistent with solar for kpc, and is slightly larger than solar in the central bin. For the 1T model at large radii, for kpc, and in the central bin.
The 2T model gives slightly larger values, for kpc (which are consistent with the 1T values within the errors). But in the central bin the 2T value is larger; i.e., about a discrepancy. In contast to the 1T case, for the 2T model, for kpc. (The overestimate of using the 1T model is a “Si Bias” related to the Fe bias we discussed previously for such systems (Buote, 2000b).)
(Unlike Fe and Si, the O and Mg abundances are quite sensitive to intrinsic absorption. We will discuss models with intrinsic absorption in Buote et al. (2002).)
3 Conclusions
We have performed a spatially resolved spectral analysis of the XMM EPIC data of NGC 1399 which suggests the presence of two dominant phases of hot gas within the central kpc. This two-phase description is consistent with 2T models we fitted previously to the ASCA data (Buote, 1999). However, the ASCA data lacked the spatial resolution of XMM and could not distinguish between a radially varying single-phase medium, a two-phase medium, or a cooling flow within kpc. These results for NGC 1399 are supported by previous analyses of its X-ray surface brightness profile which argues for separate galaxy and group components (e.g., Ikebe et al., 1996; Paolillo et al., 2002) similar to other centrally E-dominated groups (Mulchaey & Zabludoff, 1998).
Since the temperature structure of NGC 1399 obtained by ASCA is characteristic of other central E-dominated galaxy groups (Buote, 1999, 2000b; Buote et al., 1999; Allen et al., 2000), the two-phase structure revealed by XMM for NGC 1399 likely applies to these other systems. Moreover, since the centers of several clusters show similar multitemperature structure with ASCA (e.g., Buote et al., 1999; Allen et al., 2001) and similar multi-component surface brightness structure (see Ettori, 2000, and references therein), we might expect two-phase structures in the centers of these systems. A recent XMM analysis of M87 is consistent with this suggestion (Molendi & Pizzolato, 2001).
The two-phase model provides a physical explanation for the gas density and temperature profiles seen in “cooling flows”. The hotter component is associated with the ambient group or cluster gas while the cooler component is associated with the stellar ejecta of the dominant central galaxy. Gasdynamical models of groups and clusters constructed by Brighenti & Mathews (1999b, 2002b) demonstrate that relatively cool ejecta from stellar mass loss combined with the hotter ambient gas can reproduce observed single-phase temperature profiles in groups and clusters. But our results suggest that these two phases are not fully mixed.
Understanding the details of the interaction of these phases may shed light on the mystery of cooling flows. Using the results of Mathews (1989), the rate of energy input by stellar ejecta is, , where s-1 is the specific stellar mass-loss rate. If within kpc we take for the stellar mass and km s-1 (Jones et al., 1997), we infer the rate of energy input into the central kpc of NGC 1399 from stellar ejecta to be erg s-1. This crude estimate is only a factor of two less than the X-ray luminosity of the hot component (and a factor of four less than the cool component). If the energy input from stellar ejecta does not completely suppress mass drop-out, it may at least delay the episodes of AGN feedback. Problems with such heating models are discussed by Brighenti & Mathews (2002a).
The two-phase model (as well as other multitemperature models) removes the “Fe Bias” within the central regions ( kpc) and gives . These super-solar values exceed the stellar values in typical elliptical galaxies (e.g., Trager et al., 2000) and therefore allow for significant enrichment of the hot gas from Type Ia supernovae (SNIa) (cf. Arimoto et al., 1997). For example, using the results of Gibson et al. (1997) and our measured value of solar, we infer that SNIa have contributed of the iron mass within Kpc in NGC 1399. This SNIa fraction is similar to that inferred for the Sun and therefore suggests a stellar initial mass function similar to the Milky Way as advocated by Renzini and others (e.g., Renzini et al., 1993; Renzini, 1997; Wyse, 1997). We close by noting that although correcting for the “Fe Bias” partially removes the “Iron Discrepancy” noted by Arimoto et al. (1997), chemical models of elliptical galaxies without cooling flows predict central iron abundances even larger than we have measured for NGC 1399 (e.g., Brighenti & Mathews, 1999a).
References
- Allen et al. (2000) Allen, S. W., Di Matteo, T., & Fabian, A. C. 2000, MNRAS, 311, 493
- Allen et al. (2001) Allen, S. W., Fabian, A. C., Johnstone, R. M., Arnaud, K. A., & Nulsen, P. E. J. 2001, MNRAS, 322, 589
- Anders & Grevesse (1989) Anders, E. & Grevesse, N. 1989, Geochim. Cosmochim. Acta, 53, 197
- Angelini et al. (2001) Angelini, L., Loewenstein, M., & Mushotzky, R. F. 2001, ApJ, 557, L35
- Arimoto et al. (1997) Arimoto, N., Matsushita, K., Ishimaru, Y., Ohashi, T., & Renzini, A. 1997, ApJ, 477, 128
- Brighenti & Mathews (1999a) Brighenti, F. & Mathews, W. G. 1999a, ApJ, 515, 542
- Brighenti & Mathews (1999b) —. 1999b, ApJ, 512, 65
- Brighenti & Mathews (2002a) —. 2002a, ApJ, in press (astro-ph/0203409)
- Brighenti & Mathews (2002b) —. 2002b, ApJ, 567, 130
- Buote (1999) Buote, D. A. 1999, MNRAS, 309, 685
- Buote (2000a) —. 2000a, ApJ, 539, 172
- Buote (2000b) —. 2000b, MNRAS, 311, 176
- Buote et al. (1999) Buote, D. A., Canizares, C. R., & Fabian, A. C. 1999, MNRAS, 310, 483
- Buote & Fabian (1998) Buote, D. A. & Fabian, A. C. 1998, MNRAS, 296, 977
- Buote et al. (2002) Buote, D. A., Lewis, A. D., Brighenti, F., & Mathews, W. G. 2002, in preparation
- Ettori (2000) Ettori, S. 2000, MNRAS, 318, 1041
- Gibson et al. (1997) Gibson, B. K., Loewenstein, M., & Mushotzky, R. F. 1997, MNRAS, 290, 623
- Ikebe et al. (1996) Ikebe, Y., Ezawa, H., Fukazawa, Y., Hirayama, M., Izhisaki, Y., Kikuchi, K., Kubo, H., Makishima, K., Matsushita, K., Ohashi, T., Takahashi, T., & Tamura, T. 1996, Nature, 379, 427
- Ishimaru & Arimoto (1997) Ishimaru, Y. & Arimoto, N. 1997, PASJ, 49, 1
- Jones et al. (1997) Jones, C., Stern, C., Forman, W., Breen, J., David, L., Tucker, W., & Franx, M. 1997, ApJ, 482, 143
- Lewis et al. (2002) Lewis, A. D., Buote, D. A., Brighenti, F., & Mathews, W. G. 2002, in preparation
- Mathews (1989) Mathews, W. G. 1989, AJ, 97, 42
- McWilliam (1997) McWilliam, A. 1997, ARA&A, 35, 503
- Molendi & Pizzolato (2001) Molendi, S. & Pizzolato, F. 2001, ApJ, 560, 194
- Mulchaey & Zabludoff (1998) Mulchaey, J. S. & Zabludoff, A. I. 1998, ApJ, 496, 73
- Paolillo et al. (2002) Paolillo, M., Fabbiano, G., Peres, G., & Kim, D.-W. 2002, ApJ, 565, 883
- Rangarajan et al. (1995) Rangarajan, F. V. N., Fabian, A. C., Forman, W. R., & Jones, C. 1995, MNRAS, 272, 665
- Renzini (1997) Renzini, A. 1997, ApJ, 488, 35
- Renzini et al. (1993) Renzini, A., Ciotti, L., D’Ercole, A., & Pellegrini, S. 1993, ApJ, 419, 52
- Saglia et al. (2000) Saglia, R. P., Kronawitter, A., Gerhard, O., & Bender, R. 2000, AJ, 119, 153
- Tonry et al. (2001) Tonry, J. L., Dressler, A., Blakeslee, J. P., Ajhar, E. A., Fletcher, A. ., Luppino, G. A., Metzger, M. R., & Moore, C. B. 2001, ApJ, 546, 681
- Trager et al. (2000) Trager, S. C., Faber, S. M., Worthey, G., & González, J. J. . 2000, AJ, 119, 1645
- Wyse (1997) Wyse, R. F. G. 1997, ApJ, 490, L69