Outer edges of face-on spiral galaxies ††thanks: Based on observations obtained at the German-Spanish Astronomical Center (DSAZ), Calar Alto, jointly operated by the Max-Planck-Institut für Astronomie Heidelberg and the Spanish National Commission for Astronomy.
We present deep optical imaging of three face-on disk galaxies together with a detailed description of the reduction and calibration methods used, in order to measure the intrinsic shape of their outer stellar edges. Whereas it is now well accepted that disks of spiral galaxies are not infinite exponential beyond galactocentric distances of about 3-5 radial scalelengths, the genuine structure of the truncation region is not yet well known. Our data quantitatively establish a smooth truncation behaviour of the radial surface brightness profiles and is best described by a two-slope model, characterised by an inner and outer exponential scalelength separated at a relatively well defined break radius. This result disagrees with the frequently assumed sharply truncated nature of the radial surface brightness profiles and implies the presence of stars and even star-formation beyond the break radius. In addition, we do not find a strong influence of a nearby companion on the ratio of the break radius to the radial scalelength. Our results denote new observational constraints for the search of the physical explanation for these smooth disk truncations.
Key Words.:
galaxies: spiral – galaxies: fundamental parameters – galaxies: structure – galaxies: surface photometry – individual galaxies: NGC 5923, UGC 9837, NGC 54341 Introduction
Since the pioneering work of de Vaucouleurs (1948, 1958) and Freeman (1970) the
radial surface brightness, tracing the stellar distribution, is empirically
known to be well described by an exponential decline. The inner part
can be dominated by a bulge, bar, or ring component, whereas the outer disk
follows an exponential quite well with only minor deviations related
to spiral arms.
However, van der Kruit (1979) has already pointed out that the profiles appear to break off towards the outer parts.
This is later quantitatively confirmed using optical filters by e.g. van der Kruit & Searle (1982), Barteldrees & Dettmar (1994), Pohlen et al. (2000a, b), and de Grijs et al. (2001).
Just recently, data by Florido et al. (2001) for the first time suggest these truncations to be also present in NIR images.
These so called cut-off radii are practically only observed in edge-on galaxies due to the preferred line-of-sight integration.
While the existence of the truncations is now well accepted there are still two major unsolved problems.
On the one hand we are still missing a unique physical interpretation to describe this observational phenomenon.
The proposed hypotheses span a rather wide range of possibilities. van der Kruit (1987) has deduced a connection to the galaxy formation process describing the truncations as remnants from the early collapse. Ferguson & Clark (2001), for example, have proposed an evolutionary scenario represented by the viscous disk evolution models. Kennicutt (1989) has suggested a dynamical critical star-formation threshold, and Battaner et al. (2002) have proposed a connection with large scale galactic magnetic fields.
On the other hand the detailed structure of the radial surface brightness distribution of disk galaxies is still not well constrained, although already Näslund & Jörsäter (1997), Byun (1998), de Grijs et al. (2001), and Pohlen (2001) have found that the truncations are not that sharp as thought before.
While the former studies assume the truncation region to be exponential, Florido et al. (2001) used a model independent deprojection method to measure and analyse the truncation curve (difference between measured profile and an infinitely exponential decline).
However, nearly all studies used edge-on galaxies to search for truncations, whereas only the profiles of face-on galaxies are practically independent of possible line-of-sight effects caused by the integration across a multicomponent disk and less affected by the disturbing dust influence.
Observing face-on galaxies is therefore mandatory to study the detailed quantitative behaviour at the truncation region and to determine the scalelengths in an unbiased way.
Up to now van der Kruit & Shostak (1982) and Shostak & van der Kruit (1984) have reported the only known quantitative values of cut-offs in the literature for face-on galaxies (NGC 3938 and NGC 628). van der Kruit & Searle (1982) have just found indications of a radial truncation for NGC 5033 and NGC 3198 and no evidence in NGC 4258 and NGC 5055, all being late type galaxies. Although calling the observed feature near the edge of the disk a ’truncation’ van der Kruit & Searle (1982) have already stated that “the edges are not infinitely sharp (we usually derive an upper limit to the scalelength beyond of about 1 kpc)”. In a subsequent paper van der Kruit (1988) has stated that out of the 20 face-on galaxies observed by Wevers et al. (1986) only four (NGC 2681, NGC 4203, NGC 5005, NGC 6340) —all being early type galaxies and therefore probably possessing a different disk formation history— do not show any sign for a drop off as judged from the last three contours. He has also recognized that only NGC 5371 shows a relatively sharp edge but without quoting detailed numbers. Explaining this in addition to the much lower surface brightness for face-on systems, with the problem of dealing with intrinsic deviations from the circular symmetry of disks which could be hidden by an azimuthally averaged profile. These asymmetries, such as spiral arms, especially from the young population should unavoidably contribute in less inclined systems. All these results are based on photographic material and up to now there is no systematic follow up of truncations for face-on galaxies. Especially a detailed quantitative modelling of radial surface brightness profiles based on higher quality CCD imaging data is missing.
However, there are at least two recent papers in the literature which both have not found any sign for a truncation investigating two nearly face-on galaxies. Barton & Thompson (1997) —with a sensitivity limit of mag — have not found any evidence for a cut-off for the galaxy NGC 5383 out to approximately three Holmberg radii. They have measured an exponentially falling disk with several distinct departures from the smooth decline (two spiral arms with one outside the Holmberg radius), but their fitting yields unsatisfactory results. Nevertheless, in addition to a nearby companion (UGC 8877) this galaxy unfortunately shows a rather complex morphological structure (type: PSBT3*P according to the RC3111Third Reference Catalogue of bright galaxies (RC3: de Vaucouleurs et al., 1991).) and has also been rejected by van der Kruit (1988) in his study. Weiner et al. (2001) also have found no sign of a truncation out to ten scalelength for the NGC 4123 (type: SBR5 + starburst according to NED222NASA/IPAC Extragalactic Database (NED).) in their azimuthally averaged light profile. These studies have in common that both target galaxies are strongly barred and show a rather peculiar overall morphology.
The detailed structure of the truncation region can be expected to give important constraints for the physical nature of these outer stellar edges. In addition our analysis has consequential effects on the determination of the truncation as a structural parameter which is important to compare observational results with model predictions. Depending on the true physical nature these outer edges may contain fossil evidences imprinted by the detailed galaxy formation and evolutionary history.
2 Sample Selection & Observations
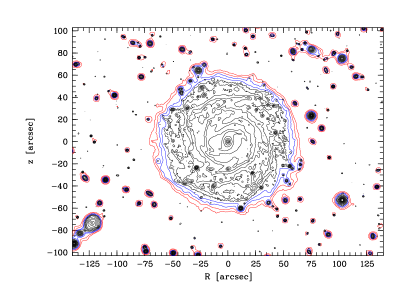
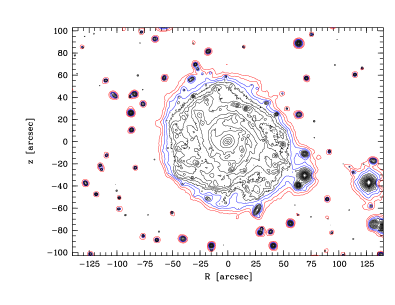
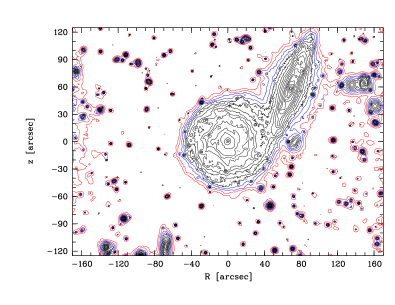
The main selection criteria for the observed objects are that they should be as close as possible to face-on disks. In a first step the galaxies are selected from the RC3 to be at least inclined less than 30°(deduced by ). According to the lack of a truncation in the profile of S-galaxies (cf. Pohlen, 2001) early type galaxies are excluded as well as galaxies later than to have a well defined and symmetric stellar disk. Additionally, we exclude galaxies classified as SB (including SABs) since a prominent bar may significantly disturb the assumed azimuthal symmetry while smoothing the profiles. In order to obtain the selected galaxies with a decent resolution we first restrict the size to ′. After visually inspecting all galaxies from the RC3 matching these criteria on DSS333Digitized Sky Survey (DSS) images, our target galaxies should possess as few as possible foreground stars within the FOV (especially no bright ones) and should not show significant irregularities pointing to present or recent interactions. It turns out that for a given observing period galaxies corresponding to all the above mentioned selection criteria and good visibility for approximately h during the night are rare. Whereas from the visual inspection NGC 4136 seems to be the ideal galaxy, technical flatfielding problems recognised at the telescope (described in Sect. 3.1) forced us to choose galaxies with smaller diameters and we relaxed the size limitation to ′. Therefore we finally choose NGC 5434, NGC 5923, and UGC 9837 as good candidates (cf. Fig. 1, Fig. 2, and Fig. 3). NGC 5923 and UGC 9837 match all our criteria, despite some intermediate bright stars in the FOV, whereas NGC 5434 possesses two rather bright stars within the FOV. Additionally, for NGC 5434 there is an almost equal mass companion (NGC 5434B; KPG 410) with similar velocity nearby. Although NGC 5434 is therefore probably interacting and even slightly overlapping with the companion (in projection), its shape is extraordinary regular and free of large scale asymmetries. Owing to the lack of better suited galaxies, NGC 5434 was observed to investigate effects of a possible ongoing interaction on the radial surface brightness of both galaxies. The global parameters of the observed face-on galaxies are shown in Tab. 1.
| Galaxy | RA | DEC | RC3 | T | Diam. | D | ||||
|---|---|---|---|---|---|---|---|---|---|---|
| (2000.0) | type | [ ′ ] | [ km s-1 ] | [ km s-1 ] | [Mpc] | |||||
| (1) | (2) | (3) | (4) | (5) | (6) | (7) | (8) | (9) | ||
| NGC 5923 | 152114.2 | 414333 | .SXS4.. | 4. | 0 | 1.8 | 5571 | 5811.0 | 80. | 7 |
| UGC 9837 | 152351.7 | 580312 | .SXS5.. | 5. | 0 | 1.8 | 2657 | 2934.0 | 40. | 8 |
| NGC 5434 | 140323.1 | 092653 | .SA.5.. | 5. | 0 | 1.8 | 4637 | 4735.0 | 65. | 8 |
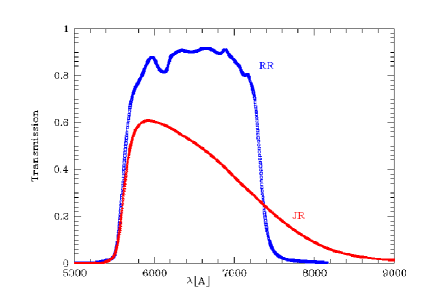
The images were obtained during an observing run in May 2001 at the 2.2 m telescope of the Calar Alto observatory (Spain) equipped with CAFOS, providing a field-of-view of 16′ using a SITe CCD with 15 m pixel size ( ″pix-1). Showing a nearly rectangular filter characteristic combined with a significantly higher peak efficiency, the so called Röser R (RR, #648/168) filter is favoured to increase the signal-to-noise using the same integration time and was used instead of the standard Johnson R (JR, #641/158) filter. The different filter characteristics are shown in Fig. 4. In order to account for the crucial flatfielding problem of deep surface photometry, images for all possible flatfield strategies were taken: dome-, twilight-, and nightsky-flatfields. The nightsky-flatfields were acquired without loosing dark time by observing additional edge-on galaxies (covering less area of the chip) and significant dithering of the rather small objects (′) across the large FOV (16′). During each night several Landolt standard fields Landolt (1992) were observed to accomplish the photometric calibration.
3 Image Reduction & Photometric Calibration
The 2048x2048 pixel SITe CCD chip (RON: 5.3 e-, GAIN: 2.7 e-/ADU) was windowed to improve the quite large read-out time (3min) of CAFOS.
Approximately 400 pixels
were excluded on each side vertical to the readout axis to
preserve the overscan region.
Additional 10 bias frames were taken at the beginning and end of
each night. It turned out that there is a minor light leak within the
CAFOS camera and bias frames taken with the dome
slit open are on average ADUs brighter, depending
on the actual brightness within the dome.
Therefore all bias frames are inspected and according to our records rejected.
The following reduction procedures are performed with standard
IRAF444Image Reduction and Analysis Facility:
http://iraf.noao.edu/ tasks.
The approximately 80 columns of the overscan region are averaged and
an overscan vector is fitted with an 11th order polynomial,
using a rejection. This is removed row-by-row from
each image by ccdproc.
A bias image is made for each night out of the remaining useful
10-15 overscan-subtracted bias frames with averaging and
rejection to remove cosmic rays by zerocombine.
The resulting bias images still show offsets of
ADUs together with a large scale gradient and a large scale column and row pattern structure.
This master bias is than subtracted from all flat and object frames.
Dark frames taken during the day show that the dark current is
equal or less than approximately 0.3 ADUs per 600 s exposure with no
evident additional two-dimensional structure.
It was not possible to reduce the light passing through the closed
dome-slit to zero during the day. It is therefore not possible to
decide if the remaining counts are either from real dark-current
or from stray light passing into the camera, consequently no dark
correction is applied.
3.1 Flatfielding
One of the limiting conditions for deep surface photometry is the accuracy of the flatfield. It turned out that both dome-flatfields and twilight-flatfields are able to remove the pixel-to-pixel variation but on cost of a significant large scale gradient remaining on the flatfielded science frames. Depending on the position of the dome slit towards the telescope/camera system during the time the twilight-flatfields were taken (90°difference between dusk and dawn), the residual large scale pattern on the flatfielded images changes in the same direction. Therefore we have to assume that this structure is caused by stray light of the illuminated dome during the twilight-flatfielding as well as the dome-flatfielding procedure. An additional pupil stop used in the 4th night to minimize this stray-light did not solve the problem. Since we took approximately 20 science images each night with significantly dithering across the FOV we have tried to use a nightsky-flat median combined from all long-exposure science images during the night after an additive median scaling and a lower and upper sigma-clipping with imcombine. It turned out that even with imcombine’s highly sophisticated scaling and rejecting algorithms it is not possible to remove all the structure in the combined nightsky-flat. There is still some residual pattern in the center of the image remaining. Taking all the 55 science images (s) from the first three nights within the RR filter together yields a decent result for the object residuals and a similar STDDEV compared to the dome- and sky-flats, but at the expense of some residual underlying large scale structure. Another possibility is to isolate the imposed large scale gradient by using dome- or twilight-flats with the imsurfit task and divide the normalised surface-fit (third order) back into the image again. This works nicely for the saddle surface introduced by the twilight-flatfields, but not for the ring-like structure of the dome-flatfield. A major drawback of this method is that one has to ensure that the object —compared to the structure of the underlying surface— is excluded from the fit. Although it is possible for the face-on galaxies with the imsurfit option ’invcirc’ to adjust the position of the galaxy center for each fit as well as a radius, the task fails for the rather large edge-on galaxies chosen. The overall quality of the combined image relies in this case on the quality of the 12 to 17 individual fits to the sky-flatfielded single images. In order to minimise the number of crucial fitting processes we finally used a third method. By combining all 55 dome-flatfielded science images with imcombine using a multiplicative exposure time scaling, an additive median scaling, and a lower and upper sigma-clipping, the fairly constant (over all nights) dome-flatfield structure is isolated. After a median smoothing (15 pixel) to increase the S/N ratio and normalising of the image, this structure is divided back into the dome-flatfield images to yield the final single images without depending on the imsurfit quality.
3.2 Combining
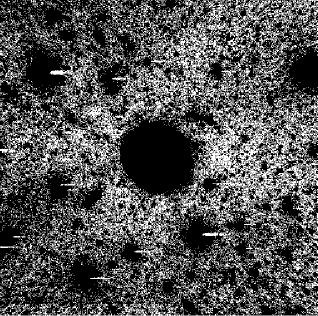
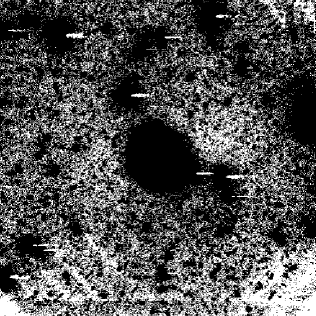
We test three different ways to combine the individual (up to 18) object frames. One combining method is a slightly modified version of the mosaic task from the ARNICA555External IRAF add-on package, provided by L. Hunt, Arcetri (Italy). package, where we introduce the full capabilities of the IRAF imcombine-task instead of the predefined combine task using the provided centering routine. The mosaic-task allows only full pixel shifts in x- and y-direction without rotation or magnification. In addition, we use the custom written IRAF script gacombine666Could be provided upon request. based on the available IRAF centering task imcntr together with IRAFs geomap/geotran-tasks to perform the actual matching of all the frames to one reference frame. We try to use the full transformation with subpixel-shifts, rotation and distortion of the pixels and a more restricted approach using only subpixel-shifts. The object of comparison reveals that all three methods yields rather similar results, although the FWHM of selected stars in the gacombined image using the full transformation is slightly (″) better. To account for possible changes in the overall geometry during the rather large (h) observing period the gacombine task with full transformation is chosen to create the final combined image. The imcombine task parameters are adjusted to average the individual pixels after multiplicative exposure time scaling, additive median scaling, and a -clipping using the ccdclip algorithm. The additive median scaling of the original images is essential since variation in the sky level (mainly caused by different moon positions) during the night are of the order of 0.4 mag. The final combined images are shown in Fig. 5 with high contrast to highlight the residual background structure.
3.3 Sky subtraction
The combined images are visually inspected and foreground stars and galaxies
are masked by hand with the IRAF task imedit using
at least three different radii depending on the object size.
Accurate sky subtraction is crucial for the slope of the derived
luminosity profiles especially for the low luminosity outer part.
The actual problem is how and where to determine the single value
which is called “the sky value”.
It should be a mean value for all the remaining background pixels on the image still including the galaxy, fainter foreground stars, and remaining background sources. There are several different possibilities to determine such a characteristic value within the available data reduction packages IRAF and MIDAS777Munich Image Data Analysis System:
http://www.eso.org/projects/esomidas/. They are all aiming to determine either the median (middle value) or the mode (the most probable value) of the pixel distribution.
However, it turns out that neither the ’MIDPT’-value (an estimate of the median of the pixel distribution) nor the ’MODE’-value determined
with the IRAF imstat task888Note: Lowering the standard
binwidth of 0.1 improves the quality. over the whole image are efficient to determine a reasonable value for the background. Both overestimate the true background significantly.
Therefore we tested three different methods to approximate the most common value —assumed to be the representative sky value— within the final image.
-
1.
A mathematical mode (the most frequently occurring) value, determined by eye as the local extremum within the histogram of all pixel values plotted with imhistogram (cf. Fig. 6).
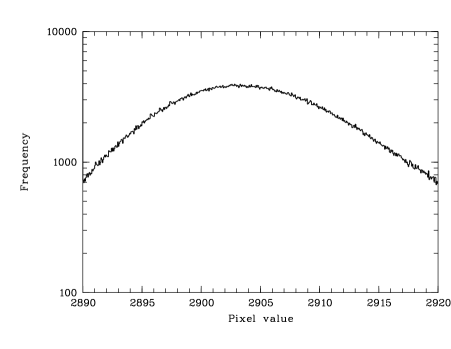
Figure 6: Histogram of all pixel values in the star-masked image of NGC 5923 centered on the background peak. -
2.
The ’MIDPT’-value determined with IRAF’s imexam on several 5x5 pixel rectangular regions centered on the cursor position visually pointing to ’empty’ sky regions.
-
3.
An exact median determined with the MIDAS task STATISTICS/IMAGE, which sorts all pixels of the image by their values.
The problem becomes obvious comparing the different results in the case of NGC 5923: 2903.0, 2901.4, and 2905.2, counts respectively. In Fig. 7 the resulting radial profiles are shown using these values.
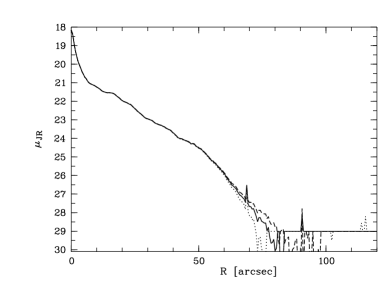
The profiles start to differ below a surface brightness of JR-mag , whereas the actual 1-background fluctuations —usually used to determine the depth of the image— reach JR-mag . We finally decide to use the histogram method, since this produced the most straight profile beyond JR-mag without an additional curvature, continuing the undoubtedly linear profile from the break radius to this point. This prevents introducing another slope just at our limiting surface brightness. The uncertainty caused by the visual determination is shown in Fig. 8. In addition to the mean sky the two associated justifiable extremes are plotted. This discrepancy slightly affects the determined slope of the outer profile.
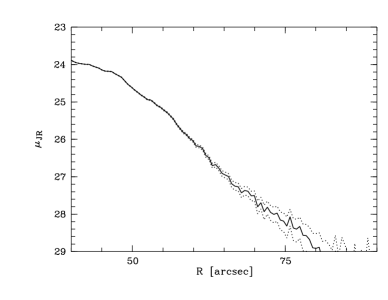
In this case the profiles start to deviate significantly below JR-mag which marks the final accuracy of our photometry.
3.4 Photometric calibration
Several Landolt standard fields Landolt (1992) have been observed each night following at least one over several airmasses to calculate the extinction coefficients. The calibration coefficients are determined according to following equations:
| Date | Band | Zero point | Airmass | Colour |
|---|---|---|---|---|
| coef. | coef. | |||
| N1: 26.05.01 | JR | |||
| N2: 27.05.01 | JR | |||
| N3: 28.05.01 | JR | |||
| N4: 29.05.01 | JR | — | — | |
| N5: 30.05.01 | JR |
For the fourth night no reasonable solution is found and only a zero point could be determined. The applied coefficients are shown in Tab. 2 The fields were observed in Johnson R and B as well as the Röser R filter to quantify the difference between RR and JR. We do not find a systematic correlation of the RR-magnitudes and JR-magnitudes with star colour or airmass. Therefore, we assume in the following the mean difference of mag.
3.5 Polar transformation
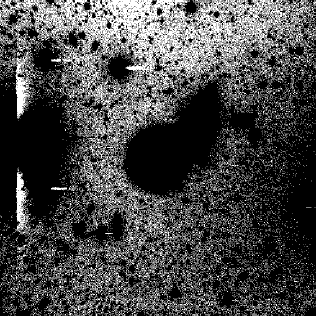
Using the first order symmetry of the chosen ideal face-on galaxies an azimuthal averaging within predefined segments increases the signal-to-noise ratio and allows to follow a smooth profile down to the limits of the photometry. In order to independently pick up the size of these segments the whole image is transformed into polar coordinates using an already existing C-program999Courtesy L. Schmidtobreick.. The polar image of NGC 5923 is shown in Fig. 9.
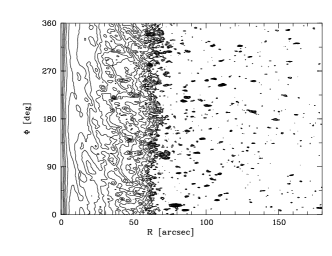
By combining the individual rows —split with the IRAF task imslice and apply the powerful rejecting and combining algorithms of imcombine— we are able to mimic an azimuthally smoothing within segments of the galaxy disk and to reduce the influence from individual ii regions. NIR images would be more suited to study the underlying mass distrubution, although currently probably infeasible to these depths. The optical passband used is therefore contaminated by star-formation in and outside the spiral arms. These intrinsic deviations within the galaxy’s structure from azimuthal symmetry are obviously present (cf. individual profiles in Fig. 10).
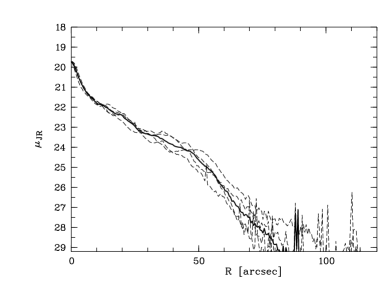
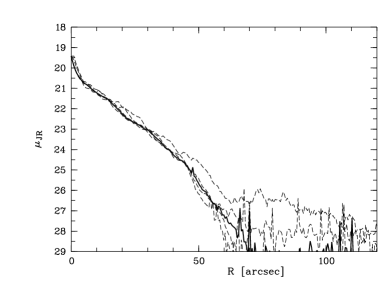
However, our azimuthally smoothing by combining the individual sliced rows does not significantly change the inner or blur the outer slope it rather averages the individual slopes in a reasonable manner, in contrast to the statement of van der Kruit (1988).
4 Analysis & Results
4.1 Derived parameters
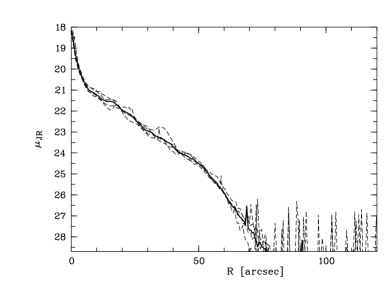
We limit the following analysis of the radial profiles to the 360° averaged profiles, except for NGC 5434 where only the 180° profile, avoiding the edge-on companion, are taken into account. The final combined profiles together with all four 90° segments obtained from the polar transformed image (see Sect. 3.5) are shown in Fig. 10. In all three cases we find a common behaviour. The radial surface brightness profile is best described by a two-slope model, characterised by an inner and outer exponential scalelength separated at a rather sharp so called break radius . The inner approximately arcsec are dominated by a bulge component followed by a rather well described first exponential decline of 3.3 mag within ″and a second also quite well described second exponential decline of 4.4 mag (down to the observing limit) within ″. Taking into account the estimated distance this translates into an inner approximately kpc wide region dominated by the bulge component followed by a first exponential decline of radially rather different sizes for the three galaxies (NGC 5434: kpc, UGC 9837: kpc, NGC 5923: kpc) and a second slope within kpc limited by the outermost measured point. The inner and outer slope are determined with an 1D exponential fit of the form to the combined radial surface brightness profile using the IRAF task tlinear. The inner boundary is defined by the bulge light and the fit is performed down to JR-mag while the break radius is determined by eye. The resulting fits are shown in Fig. 11.


The resulting values are shown in Tab. 3, for the break radius (4) in units of arcsec, kpc (with the estimated distance (2)), and in units of the inner scalelength (5), the surface brightness (3)) at the position of the break radius, as well as the ratio of inner to outer scalelength (7)). The total sizes defined as the last measured point of their disks are: 30.5 kpc (NGC 5923), 16.0 kpc (UGC 9837), and 22.3 kpc (NGC 5434). Although being probably an interacting system the derived values for NGC 5434 are in no way exceptional compared to the other two galaxies.
4.2 Comparison with the literature
| Galaxy | D | |||||||||||||
| [Mpc] | [JR-mag ] | [ ″] | [kpc] | [ ″] | [kpc] | [ ″] | [kpc] | |||||||
| (1) | (2) | (3) | (4) | (5) | (6) | (7) | ||||||||
| NGC 5923 | 80.7 | 24.7 | 21. | |||||||||||
| UGC 9837 | 40.8 | 24.4 | 9. | |||||||||||
| NGC 5434 | 65.8 | 24.7 | 14. | |||||||||||
| mean | 24.6 | |||||||||||||
The observed smooth nature of the radial truncation is consistent with earlier work on edge-on galaxies. Already early photographic profiles fitted by van der Kruit & Searle (1981) (e.g. their Fig. 9 for NGC 5907) show the smooth nature of the truncation and reveal that their sharply-truncated model explicitly overpredicts the luminosity profile at the truncation region. A similar behaviour is found in the recent work of Pohlen et al. (2000b) where they fit the sharply-truncated model of van der Kruit & Searle (1981) to CCD observations.
The derived two-slope model consisting of two exponentials separated at a break radius is also discussed by Näslund & Jörsäter (1997) and Byun (1998). By analysing a deep optical image of NGC 4565 Näslund & Jörsäter (1997) find a similar two-slope shape for their major axis profile (cf. their Fig. 2). They state that exponentials also provide a good solution at both sides beyond the break radius and that there is no clear hint in their data of any further change in the disk scalelength at surface brightnesses lower than mag . The same experience is made by Byun (1998) in the case of IC 5249. He also discovers that the major axis of IC 5249 demonstrates a peculiar two-component structure with an exponential inner disk, where the change of surface brightness is slow and also an exponential outer disk with a steep change of surface brightness. He concludes that this structure cannot be caused by internal absorption but must represent the intrinsic stellar distribution. Prior to this already Jensen & Thuan (1982) for NGC 4565 and Sasaki (1987) for NGC 5907 fitted additional exponential profiles to the truncation regions. A different approach is outlined by Florido et al. (2001). They use a model independent deprojection method to measure and analyse the truncation curve which is the difference between the measured profile and an infinitely exponential decline.
In the case of face-on galaxies van der Kruit & Shostak (1982) measure for NGC 3938 a quite similar radial profile (cf. their Fig. 10) with a break radius at ( F-mag ) and a value for the ratio of inner and outer scalelength of which is consistent for the occurrence of the break radius and only somewhat smaller for the scalelength ratio compared to our results. Using the radial velocity of 1011 km s-1 from LEDA101010Lyon/Meudon Extragalactic Database (LEDA). corrected for the Local Group infall onto Virgo and a Hubble constant of km s-1 Mpc-1 Freedman et al. (2001), we estimate the distance of NGC 3938 to 14.0 Mpc. Thereby we recompute the linear parameters and recover a rather low inner scalelength of 2.5 kpc, a more typical outer scalelength of 1.5 kpc, and a break radius at 10.2 kpc which are all similar to our values. In contrast to van der Kruit & Shostak (1982) we do not regard our derived outer scalelengths as upper limits of the true scalelength. They assume this upper limits, due to the azimuthally averaged deviations from the pure circularity of the isophotes. It is obvious by comparing the averaged profile to the individual wide strips (cf. Fig. 10) that the azimuthally averaging does not significantly change the measured outer scalelength. There are of course variations between the individual profiles due to spiral arms, prominent ii regions, and intrinsic asymmetries, but judging from the averaged profile it seems to be a reasonable mean representation.
The radial surface brightness profile of NGC 628 presented by Shostak & van der Kruit (1984) also fits quite well with our results (cf. their Fig. 13). They find a break radius at precisely ( F-mag ), although quoting to be at ” scalelength”, and a value for the ratio of inner and outer scalelength of , together with an inner scalelength of kpc and an outer of kpc.
Comparing our results with other published radial profiles of NGC 628 (Natali et al., 1992) also supports the two-slope model. According to our mean value of and using their derived scalelength we predict a break in the profile to be visible at kpc. Assuming their profiles to be reliable out to 16 kpc (cf. their Fig. 8 and Fig. 9) we find a clear break in the B, V, R and I profiles with similar shape compared to our three galaxies at 14 kpc equivalent to . Therefore their results fit well to our results for NGC 5923 and NGC 5434. Unfortunately their colour profiles just stop at this radial distance and we are not able to find a similar break in the colour profiles which would possibly constrain the physical hypothesis for the origin of these truncations.
4.3 Constraints for the origin of truncations
In order to search for a possible correlation of the break radius and the presence of spiral arm structure we visually determined the extent of the spiral arms for the target galaxies. It is well known that the spiral structure is constrained between the inner Lindblad resonance (ILR) and the outer Lindblad resonance (OLR) (eg. Canzian, 1998). Unfortunately all three galaxies are not well defined grand-design spirals. NGC 5923 and NGC 5434 show nearly similar behaviour starting with a two-arm spiral which is splitting up towards the outer parts in at least four traceable arms. UGC 9837 is even more complex. In the inner part starting with a two-arm spiral, it looks rather flocculent in the outer parts. The estimated extent of the spiral arms are ″(NGC 5923), ″(UGC 9837), and ″(NGC 5434). In the case of NGC 5434 this fits well with the derived break radius, although for NGC 5923 it is ″(2.5 kpc) and for UGC 9837 ″(1.9 kpc) larger than . However, Canzian (1998) already points out that it is unknown how often spiral structure remains relatively bright, or even optically detectable, at radii approaching the OLR. He derives for his sample of face-on to moderately inclined galaxies a large scatter of the spiral arm surface brightness at their outer extent, ranging from V-mag , compared to our mean value of R-mag .
Kennicutts study on the dependence of the star formation rate (SFR) on the density and dynamics of the interstellar gas Kennicutt (1989) proposes a dynamically critical gas density acting as a star formation threshold. Beyond this critical radius the star formation should be inhibited and if this persists for sufficient time, it should introduce a visible turnover or truncation of the observed stellar luminosity profile at that radius. These critical radii for star formation are measured by prominent breaks in the surface-brightness profiles (cf. Martin & Kennicutt, 2001). Leliévre & Roy (2000) discover that the surface brightness profiles in the case of NGC 628 diminish monotonically as a function of galactocentric distance, dropping dramatically at kpc. This fall-off in near the edge of the optical disk (defined by the 25th B-band isophote) is also observed by Ferguson et al. (1998) for NGC 628 and also NGC 6946. Leliévre & Roy (2000) conclude that the standard Schmidt law ’fails’ at this radius equivalent to a gas surface density of Mpc-2, although they find additional ii regions out to 27 kpc, and an i disk extending even much further.
However, Leliévre & Roy (2000) and Ferguson et al. (1998) do not compare their results with two profiles tracing the underlying old stellar population which are present in the literature in the case of NGC 628. Shostak & van der Kruit (1984) locate a break radius for NGC 628 at 12.4 kpc ( kpc for Mpc), whereas we deduce 14 kpc from Natali et al. (1992).
Compared to the ’ -truncation’ at kpc of Leliévre & Roy (2000) optical breaks at 13 kpc or 14 kpc clearly rule out a one-to-one correlation. Nevertheless, at 14 kpc a small plateau-like feature starts in the averaged surface brightness (Fig. 3 of Leliévre & Roy, 2000). In addition, using the data for NGC 628 of Ferguson et al. (1998) we deduce a clear break in the profile at (cf. their Fig. 2). With their distance of 10.7 Mpc this is equal to kpc ( kpc for Mpc) and therefore similar to the break found by Shostak & van der Kruit (1984) and the one deduced from Natali et al. (1992).
5 Conclusions
Our deep optical imaging of three face-on galaxies confirms the finding of Näslund & Jörsäter (1997), Byun (1998), de Grijs et al. (2001), and Pohlen (2001) that the observed truncations of galactic stellar disks are not infinitesimally sharp but better described by an additional exponential decline. Since face-on scalelengths are not influenced by line-of-sight integration problems as in the case for edge-on galaxies (so far investigated), we are able to quantitatively introduce a new two-slope model. We find that the radial surface brightness profiles are best represented by a two-slope exponential profile, characterised by an inner and outer scalelength separated at a break radius , rather than the previously assumed sharply-truncated exponential model proposed by van der Kruit & Searle (1981) and used for example in the study of Pohlen et al. (2000b). The mean value for the distance independent ratio of break radius to inner scalelength which marks the start of the truncation region is .
Although larger statistics are also definitely needed, the lack of any conspicuity in the parameters for NGC 5434 with its close physical companion points against an interaction hypothesis for explaining stellar truncations. In addition, we could not correlate undoubtedly the end of the visual spiral arms with the occurrence of the break radii, which may be a hint relating the truncation phenomenon to star formation properties. Similar deep imaging of grand-design spirals are needed to clarify this hypothesis. Since we do not have deep maps for our galaxies we have searched the literature for signs of break radii in published surface brightness profiles and have compared them in the case of NGC 628 with already available data. Although not conclusive in this case an follow up of the three observed face-on galaxies will be a promising project to determine the origin for the observed break radii (or smooth truncations) and address the star formation threshold hypothesis by Kennicutt (1989).
However, the detailed quantitative structure of the smoothness of the observed truncations presented here will set strong constraints for present and future theoretical models trying to explain this observational phenomenon.
Acknowledgements.
Part of this work was supported by the German Deutsche Forschungsgemeinschaft, DFG. We would like to thank the referee, Dr. E. Battaner, for his useful suggestions to improve this paper. This research has made use of the NASA/IPAC Extragalactic Database (NED) which is operated by the Jet Propulsion Laboratory, California Institute of Technology, under contract with the National Aeronautics and Space Administration. It also uses the Digitized Sky Survey (DSS) based on photographic data obtained using Oschin Schmidt Telescope on Palomar Mountain and The UK Schmidt Telescope and produced at the Space Telescope Science Institute.References
- Barteldrees & Dettmar (1994) Barteldrees, A., & Dettmar, R.-J. 1994, A&AS, 103, 475
- Barton & Thompson (1997) Barton, I.J., & Thompson, L.A. 1997, AJ, 114, 655
- Battaner et al. (2002) Battaner, E., Florido, E., & Jiménez-Vicente, J. 2002, A&A, 388, 213
- Byun (1998) Byun, Y. -I. 1998, Chinese Journal of Physics, 36, 677
- Canzian (1998) Canzian, B. 1998, ApJ, 502, 582
- de Grijs et al. (2001) de Grijs, R., Kregel, M., & Wesson, K.H. 2001, MNRAS, 324, 1074
- de Vaucouleurs (1948) de Vaucouleurs, G. 1948, Ann.Astrophysics, 11, 247
- de Vaucouleurs (1958) de Vaucouleurs, G. 1958, ApJ, 128, 465
- de Vaucouleurs et al. (1991) de Vaucouleurs, G., de Vaucouleurs, A., Corwin, H.G., Buta, R.J., Paturel, G., & Fouque, J.B. 1991, Third reference catalogue of bright galaxies, Springer-Verlag New York
- Ferguson et al. (1998) Ferguson, A.M.N., Wyse, R.F.G., Gallagher, J.S., & Hunter, D.A. 1998, ApJ, 506, L19
- Ferguson & Clark (2001) Ferguson, A.M.N., & Clark, C.J. 2001, MNRAS, 325, 781
- Florido et al. (2001) Florido, E., Battaner, E., Guijarro, A., Garzón, F., & Jiménez-Vicente, J. 2001, A&A, 378, 82
- Freeman (1970) Freeman K.C. 1970, ApJ, 160, 811
- Freedman et al. (2001) Freedman, W.L., Madore, B.F., Gibson, B.K., et al. (12 other authors) 2001, ApJ, 553, 47
- Jensen & Thuan (1982) Jensen, E.B., & Thuan, T.X. 1982, ApJS, 50, 421
- Landolt (1992) Landolt, A.U. 1992, AJ, 104, 340
- Leliévre & Roy (2000) Leliévre, M., & Roy, J.-R. 2000, AJ, 120, 1306
- Martin & Kennicutt (2001) Martin, C.L., & Kennicutt, R.C. 2001, ApJ, 555, 301
- Kennicutt (1989) Kennicutt, R.C., 1989, ApJ, 344, 685
- Näslund & Jörsäter (1997) Näslund, M., & Jörsäter, S. 1997, A&A, 325, 915
- Natali et al. (1992) Natali, G., Pedichini, F., & Righini, M. 1992, A&A, 256, 79
- Pohlen et al. (2000a) Pohlen, M., Dettmar, R.-J., & Lütticke, R. 2000a, A&A, 357, L1
- Pohlen et al. (2000b) Pohlen, M., Dettmar, R.-J., Lütticke, R. & Schwarzkopf, U. 2000b, A&AS, 144, 405
- Pohlen (2001) Pohlen, M., 2001, PhD Thesis, Ruhr-University Bochum, Germany
- Sasaki (1987) Sasaki, T. 1987, PASJ, 39, 849
- Shostak & van der Kruit (1984) Shostak, G.S., & van der Kruit, P.C. 1984, A&A, 132, 20
- van der Kruit (1979) van der Kruit, P.C. 1979, A&AS, 38, 15
- van der Kruit & Searle (1981) van der Kruit, P.C., & Searle, L. 1981a, A&A, 95, 105
- van der Kruit (1987) van der Kruit, P.C. 1987, A&A, 173, 59
- van der Kruit (1988) van der Kruit, P.C. 1988, A&A, 192, 117
- van der Kruit & Searle (1982) van der Kruit, P.C., & Searle, L. 1982a, A&A, 110, 61
- van der Kruit & Shostak (1982) van der Kruit, P.C., & Shostak, G.S. 1982, A&A, 105, 351
- Weiner et al. (2001) Weiner, B.J., Williams, T.B., van Gorkom, J.H., & Sellwood, J.A. 2001, 546, 916
- Wevers et al. (1986) Wevers, B.M.H.R., van der Kruit, P.C., & Allen, R.J. 1986, A&AS, 66, 505