XMM–Newton observations of ultraluminous X–ray sources
in nearby galaxies
An XMM–Newton study of ultraluminous X–ray sources (ULX) has been performed in a sample of 10 nearby Seyfert galaxies. Eighteen ULX have been found with positional uncertainty of about . The large collecting area of XMM–Newton makes the statistics sufficient to perform spectral fitting with simple models in 8 cases. The main results of the present minisurvey strengthen the theory that the ULX could be accreting black holes in hard or soft state. In some cases, the contribution of the ULX to the overall X–ray flux appears to be dominant with respect to that of the active nucleus. In addition, 6 ULX present probable counterparts at other wavelengths (optical/infrared, radio). A multiwavelength observing strategy is required to better assess the nature of these sources.
Key Words.:
galaxies: active – galaxies: general – X–rays: binaries – X–rays: galaxies1 Introduction
The X–ray emission from Seyfert host galaxies comprises the contribution of a number of discrete sources plus the hot interstellar plasma (Fabbiano 1989). Most of the discrete sources appear to be close accreting binaries, with a compact companion. Einstein observations of the bulge of M31 revealed a population of about 100 low mass X–ray binaries (Fabbiano et al. 1987). Later, Supper et al. (1997) showed, by using ROSAT data, that the most luminous of these objects in M31 has erg s-1, close to the Eddington limit for a neutron star.
Recently, several sources with X–ray luminosities higher than the Eddington limit for a typical neutron star have been detected in nearby galaxies (e.g., Read et al. 1997; Colbert & Mushotzky 1999; Makishima et al. 2000; La Parola et al. 2001; Zezas et al. 2001). Fabbiano et al. (2001) found with Chandra 14 pointlike sources in the Antennae galaxies, with luminosities above erg s-1 and up to erg s-1.
These discoveries have raised difficulties in the interpretation of these sources. Even though it is statistically possible to have some individual cases of off–centre black holes with masses of the order of (by assuming a typical Eddington ratio of ; cf. Nowak 1995), it is very difficult to explain the high number of sources detected so far within this scenario. Dynamical friction should have caused the objects to spiral to the nucleus of the galaxy. Several other hypotheses have been suggested about the nature of ULX: anisotropic emission from accreting black holes (King et al. 2001), emission from jets in microblazars (Körding et al. 2002), emission from accreting Kerr black holes (Makishima et al. 2000), and inhomogeneities in radiation–pressure dominated accretion disks (Begelman 2002). However, the lack of sufficient information has not allowed us to distinguish between the different models proposed. The search for optical counterparts has not yet yielded much data: to date only one ULX appears to have a plausible counterpart (Roberts et al. 2001), and other ULX may be associated with planetary nebulae or H II regions (Pakull & Mirioni 2002; Wang 2002).
Our team has been awarded about 250 ks of XMM–EPIC guaranteed time, and we started a distance–limited survey of Seyfert galaxies. We selected objects in the northern hemisphere with mag and Mpc (Di Cocco et al. 2000; Cappi et al. 2002) from the Palomar survey of Ho et al. (1997a). The distances were estimated according to Ho et al. (1997a), and we adopt the same convention in the present paper.
Here we present the results from a study of the discrete sources detected in the galaxies, which are neither the nucleus nor background objects. To date we have obtained 13 objects in our sample, but three observations were heavily corrupted by soft–proton flares and it was not possible to extract any useful information. Here we present part of a study of the discrete source population in the remaining 10 Seyfert galaxies (Table 1), specifically the catalog of ULX sources. Some preliminary results have been presented in Foschini et al. (2002).
Previous detections of ULX have been largely confined to late–type galaxies (e.g., IC 342, M82, NGC 3628, and NGC 5204) or interacting systems undergoing a starburst phase (e.g., the Antennae). Although the objects studied here technically have Seyfert nuclei, the level of nuclear activity is extremely low, and for the present purposes they can be considered “typical” nearby galaxies. The one selection effect to bear in mind is that most of the Palomar Seyferts tend to be relatively bulge–dominated disk galaxies (see, e.g., Ho et al. 1997b), and so late–type galaxies are underrepresented in our sample.
| Galaxy | R.A., Dec. (J2000) | Hubble Type | Sp. Class. | Date | Exp. | |||
|---|---|---|---|---|---|---|---|---|
| (1) | (2) | (3) | (4) | (5) | (6) | (7) | (8) | (9) |
| NGC1058 | 02:43:30.2, +37:20:27.2 | SA(rs)c | S2 | 9.1 | 3.02 | 6.65 | 6.0 | |
| NGC3185 | 10:17:38.7, +21:41:17.2 | SB(r)0/a | S2 | 21.3 | 2.34 | 2.12 | 9.1 | |
| NGC3486 | 11:00:24.1, +28:58:31.6 | SAB(r)c | S2 | 7.4 | 7.08 | 1.9 | 4.2 | |
| NGC3941 | 11:52:55.4, +36:59:10.5 | SB(s)0 | S2 | 18.9 | 3.47 | 1.9 | 5.0 | |
| NGC4138 | 12:09:29.9, +43:41:06.0 | SA(r)0+ | S1.9 | 17.0 | 2.57 | 1.36 | 10.0 | |
| NGC4168 | 12:12:17.3, +13:12:17.9 | E2 | S1.9 | 16.8 | 2.75 | 2.56 | 17.4 | |
| NGC4501 | 12:31:59.3, +14:25:13.4 | SA(rs)b | S2 | 16.8 | 6.92 | 2.48 | 2.8 | |
| NGC4565 | 12:36:21.1, +25:59:13.5 | SA(s)b | S1.9 | 9.7 | 15.85 | 1.3 | 10.0 | |
| NGC4639 | 12:42:52.5, +13:15:24.1 | SAB(rs)bc | S1.0 | 16.8 | 2.75 | 2.35 | 9.7 | |
| NGC4698 | 12:48:23.0, +08:29:14.8 | SA(s)ab | S1.9 | 16.8 | 3.98 | 1.87 | 9.2 |
| Host Galaxy | Object | RA, Dec (J2000.0) | Separation | XMM ID |
|---|---|---|---|---|
| (1) | (2) | (3) | (4) | (5) |
| NGC1058 | ULX1 | 02:43:23.5, +37:20:38 | 77 | XMMU J024323.5+372038 |
| ULX2 | 02:43:28.3, +37:20:23 | 19 | XMMU J024328.3+372023 | |
| NGC3185 | ULX1 | 10:17:37.4, +21:41:44 | 30 | XMMU J101737.4+214144 |
| NGC3486 | ULX1 | 11:00:22.4, +28:58:18 | 23 | XMMU J110022.4+285818 |
| NGC3941 | ULX1 | 11:52:58.3, +36:59:00 | 38 | XMMU J115258.3+365900 |
| NGC4168 | ULX1 | 12:12:14.5, +13:12:48 | 45 | XMMU J121214.5+131248 |
| NGC4501 | ULX1 | 12:32:00.1, +14:22:28 | 166 | XMMU J123200.1+142228 |
| ULX2 | 12:32:00.8, +14:24:42 | 40 | XMMU J123200.8+142442 | |
| NGC4565 | ULX1 | 12:36:05.2, +26:02:34 | 289 | XMMU J123605.2+260234 |
| ULX2 | 12:36:14.8, +26:00:53 | 127 | XMMU J123614.8+260053 | |
| ULX3 | 12:36:17.3, +25:59:51 | 59 | XMMU J123617.3+255951 | |
| ULX4 | 12:36:17.4, +25:58:54 | 51 | XMMU J123617.4+255854 | |
| ULX5 | 12:36:18.8, +26:00:34 | 83 | XMMU J123618.8+260034 | |
| ULX6 | 12:36:27.8, +25:57:34 | 139 | XMMU J123627.8+255734 | |
| ULX7 | 12:36:30.6, +25:56:50 | 197 | XMMU J123630.6+255650 | |
| NGC4639 | ULX1 | 12:42:48.3, +13:15:41 | 61 | XMMU J124248.3+131541 |
| ULX2 | 12:42:51.4, +13:14:39 | 50 | XMMU J124251.4+131439 | |
| NGC4698 | ULX1 | 12:48:25.9, +08:30:20 | 73 | XMMU J124825.9+083020 |
| Host Galaxy | Object | Count Rate | Likelihood | |||
|---|---|---|---|---|---|---|
| (1) | (2) | (3) | (4) | (5) | (6) | (7) |
| NGC1058 | ULX1 | 79 | ||||
| ULX2 | 22 | – | – | |||
| NGC3185 | ULX1 | 27 | – | – | ||
| NGC3486 | ULX1 | (∗) | ||||
| NGC3941 | ULX1 | 320 | ||||
| NGC4168 | ULX1 | 36 | – | – | ||
| NGC4501 | ULX1 | 23 | – | – | ||
| ULX2 | 93 | |||||
| NGC4565 | ULX1 | 44 | – | – | ||
| ULX2 | 90 | |||||
| ULX3 | 21 | – | – | |||
| ULX4 | 821 | |||||
| ULX5 | 57 | – | – | |||
| ULX6 | 121 | |||||
| ULX7 | 23 | – | – | |||
| NGC4639 | ULX1 | 29 | – | – | ||
| ULX2 | (∗) | – | – | |||
| NGC4698 | ULX1 | 168 |
-
∗
Data from manual analysis.
2 XMM–Newton data analysis
The present ULX catalog is based on data from the European Photon Imaging Camera (EPIC) on board the XMM–Newton satellite. EPIC comprises three instruments: the PN–CCD camera (Strüder et al. 2001) and two MOS–CCD detectors (Turner et al. 2001).
To define a ULX source as an off–nuclear galactic object, we use three selection criteria:
-
•
the object luminosity, in the energy band keV, must be greater than erg s-1;
-
•
the object has to be located inside the ellipse (i.e., the dimension equal to 25 mag/arcsec2) of the host galaxy;
-
•
the object must be sufficiently far from the optical centre, to avoid confusion with the galaxy’s active nucleus.
Considering that the absolute location accuracy for XMM–Newton is about (Jansen et al. 2001), and that the uncertainty in the optical position of the host galaxy centre, from the Digitized Sky Survey (DSS, see Cotton et al. 1999) is less than , we searched for off–nuclear sources at least away from the optical centre of the host galaxy. The characteristics of the sources in the present catalog are summarized in Table 2.
For the processing, screening, and analysis of the data we used the standard tools of XMM–SAS software v. 5.2 and HEAsoft Xspec (11.0.1). The images are prepared with DS9 v. 2.1, together with ZHTools v. 2.0.2.
Soft–proton flares affected the observations randomly, and in some cases it is necessary to filter the available data. Time intervals contaminated by flares have been excluded by extracting the background lightcurve in the keV energy band. Periods with count rates higher than s-1 have been removed.
To perform the detection, the EPIC–PN was selected, because of its larger effective area with respect to the MOS cameras, which allows more accuracy in the detection of faint X-ray sources. The detections were performed using the sliding box cell detection algorithm (eboxdetect of XMM–SAS). It uses a box, with dimension pixel as the detection cell, and as the minimum detection likelihood value, which in turn corresponds to a probability of Poissonian random fluctuations of the counts in the detection cell of (roughly ).
After the automatic procedure, each source inside the ellipse was carefully checked to exclude false or doubtful sources. Specifically, we noted that eboxdetect fails in some cases. Indeed, the software accumulates the source counts in a pixel box, while the background counts are accumulated in the region of pixels. This algorithm gives good results with uniform regions (both diffuse or with background only), but fails in border regions. By comparing visually the detections from EPIC–PN with data from the MOS cameras, it is possible to identify and exclude possible artifacts. It is worth noting that in the case of fake detection, eboxdetect gives an unusually poor point source location accuracy (PSLA) of , to be compared with a PSLA of less than for real and normal detections. (Note that the global positional uncertainty is given by the sum of the satellite pointing uncertainty of and the PSLA.)
After the detection run, we then extracted from the available list only those sources with X–ray luminosities higher than erg s-1 in the energy band keV (see Table 2).
The count rate calculated by eboxdetect has been converted into flux using a conversion factor of cntcm2/erg. This has been calculated from the graphics available in the XMM–Newton User’s Handbook (Ehle et al. 2001) and by assuming a power law with photon index 2 and an absorbing column density cm-2. This choice of the model parameters is consistent with results obtained from the spectral analysis of the brightest sources (see the next section).
We do not apply the correction for vignetting, because all the sources for which it is possible to extract the spectrum are close to the centre of the field of view (less than ) and have most of their statistics below keV (cf. Lumb 2002).
3 Analysis of the X–ray sources
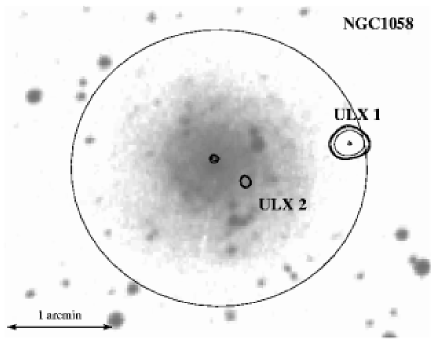
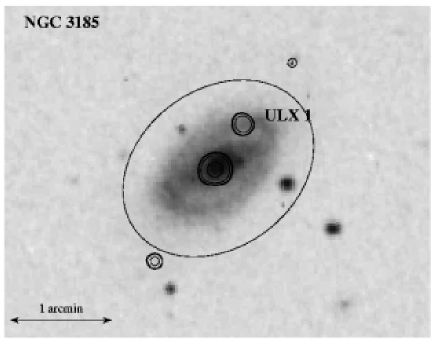
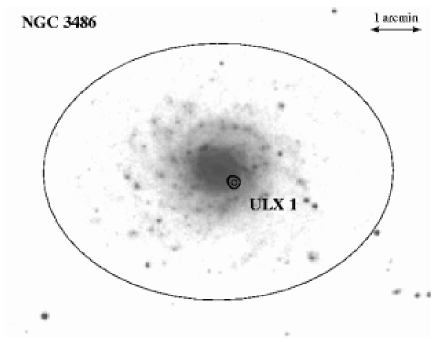
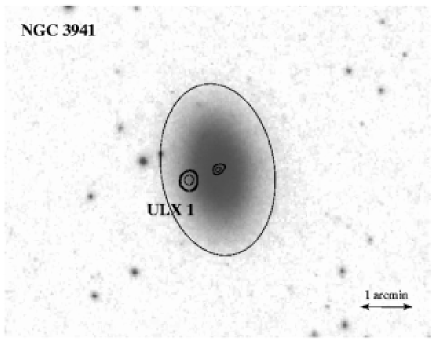
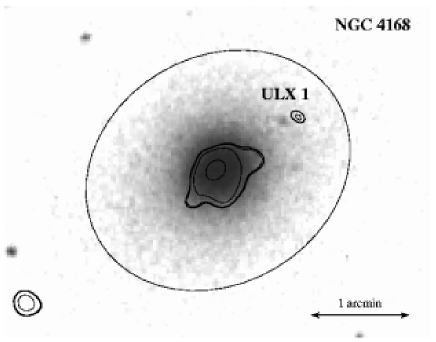
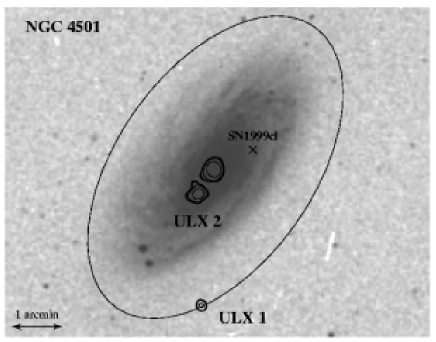
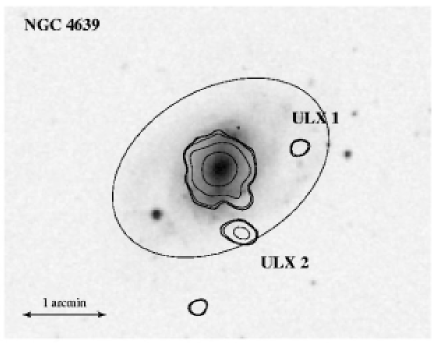
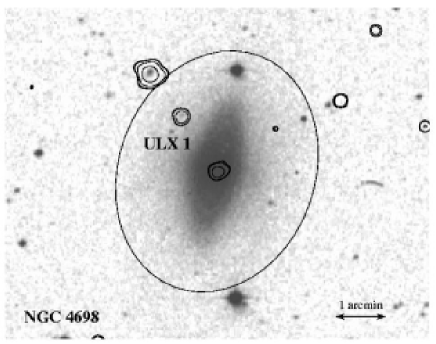
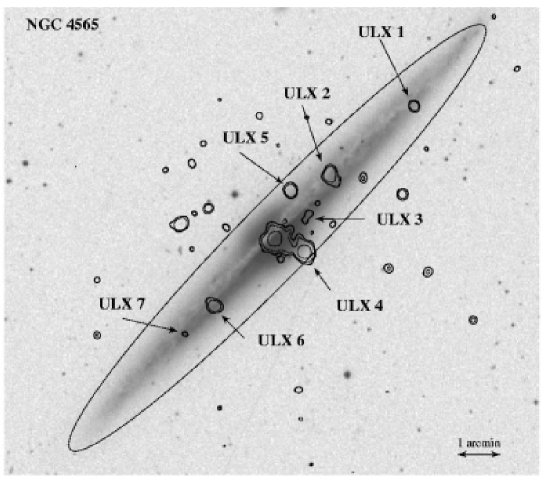
Figs show DSS images superimposed on the smoothed X–ray contour plots (data from EPIC–MOS2 camera). The ellipse is also shown for comparison. Here and in the following, if not explicitly indicated, the data on the host galaxies are obtained from the catalog of Ho et al. (1997a).
The X–ray properties of the ULX are given in Table 3. For eight of these sources the statistics are good enough (at least counts) to perform a spectral fitting with simple models. To extract the spectrum we selected source regions with radius , depending on the presence or absence of nearby sources. In all cases, the flux was corrected according to the encircled energy fraction (Ghizzardi 2001).
Data from MOS1, MOS2, and PN were fitted simultaneously. We used the following models: power law (PL), black body (BB), thermal bremstrahlung (BR), unsaturated Comptonization (CST) by Sunyaev & Titarchuk (1980), and the multicolor black body accretion disk (MCD) by Mitsuda et al. (1984). The latter two correspond to the compST and diskbb models in xspec. The unsaturated Comptonization model has two free parameters, the temperature and the optical depth. The multicolor disk has one free parameter, i.e. the temperature at the inner disk radius.
In Table 3 are summarized the results for the power-law model, while in the following we discuss other cases. We consider acceptable only the fits with reduced less than 2.
3.1 NGC1058
Two ULX have been detected and both of them appear to have no evident optical counterpart in the DSS. ULX1 has sufficient counts to be fitted. The best model is the power law, even though with an unusual low (, ). The keV flux is calculated as erg cm-2 s-1, which corresponds to a luminosity of erg s-1. Other models give worse fits; for example, the black body model with keV gives for , and we get an upper limit for the temperature of the inner disk in the MCD model of keV (, ).
3.2 NGC3185
This source is the farthest in our sample, and inside its small angular size (), we find one clear ULX, for which the low statistics do not allow a spectral fit. No clear optical counterpart is visible in the DSS.
3.3 NGC3486
One ULX has been detected at from the optical centre. The statistics are sufficient to perform a spectral fitting. The best-fit model is obtained with a simple power law model with a photon index of (, ). The keV flux is erg cm-2 s-1, which corresponds to a luminosity of erg s-1. The fits are worse, but still acceptable, with the BB (, ) and MCD (, ) models. The former gives a temperature of keV, while the latter gives a temperature of the inner disk of keV.
After the analysis of 41.3 ks of ASCA/SIS0 data, Pappa et al. (2001) found, for this galaxy, an observed flux of erg cm-2 s-1 (in the energy band keV), using a power law with absorbed by an additional column density of cm-2. They suggested that NGC3486 may be an obscured Seyfert 2 galaxy. However, from XMM-Newton data, in a circle of centered in the optical centre of NGC3486, the count rate is s-1, which corresponds to a flux of erg cm-2 (given the conversion factor used in this paper). The luminosity is erg s-1 in the keV energy band. These data are compatible with those of Chandra (Ho et al. 2001) and the upper limit of ROSAT/HRI ( erg cm-2 s-1 in the keV band; Halderson et al. 2001).
Since the ASCA flux was calculated by extracting photons in wider regions (), because of the low angular resolution, this suggest the source observed by ASCA was not the nucleus, but the ULX, at only (825 pc) from the optical centre of NGC3486.
3.4 NGC3941
Only one ULX has been detected in this galaxy at from the centre. The spectrum is well fitted with a PL model with (, ) or a BR model with keV (, ). In the first case, the flux is erg cm-2 s-1 and the luminosity is erg s-1.
3.5 NGC4138
No ULX was detected inside the ellipse (figure not shown). The flux limit is about erg cm-2 s-1 for this observation.
3.6 NGC4168
The XMM–Newton observation shows one clear ULX in this galaxy, which appears to have a possible correlation with a point source in the 2MASS survey. No spectral fitting was possible.
3.7 NGC4501
We clearly detected two ULX in this galaxy, one of them just on the border of the ellipse. ULX2 has sufficient counts for a spectral fitting. The best fit (, ) is a power law with , which corresponds to a flux of erg cm-2 s-1 and a luminosity of erg s-1. Other acceptable models are BB (, ) with keV and MCD (, ) with keV. For BR we obtain only an upper limit for keV (, ).
3.8 NGC4565
We find seven sources inside the ellipse, but since this galaxy is edge–on, there could be additional sources projected along the minor axis above the plane of the disk. Examination of Fig. 3 suggests that this indeed might be the case, although interestingly none of the sources seem to coincide with known globular clusters (Kissler-Patig et al. 1999).
For three ULX (2, 4, and 6) it is possible to perform spectral fitting. Specifically, ULX4 has the highest counts in all the present catalog. The best fit is still the power law with photon index (, ). The flux and the corresponding luminosity are erg cm-2 s-1 and erg s-1, respectively.
It is worth noting that, with the exception of the BB model, all of the other models give an acceptable spectral fit for ULX4. In addition, it is also the only source that is fitted well with the unsaturated Comptonization model. Specifically, the BR model is fitted with keV (, ), the MCD with keV (, ), and the CST has keV with optical depth (, ).
ULX2 is best fitted with the black body model at keV (, ). The flux and luminosity for this model are erg cm-2 s-1 and erg s-1, respectively. Other reasonable fits are obtained with PL (see Table 3) and with MCD, with the temperature of the inner disk of keV (, ).
ULX6 also is best fitted with BB, but with keV (, ). In this case the flux is erg cm-2 s-1 and the luminosity is erg s-1. Yet other statistically acceptable models are the PL (see Table 3) and the MCD, with temperature of the inner disk of keV (, ).
Four of the ULX sources have already been detected by ROSAT (Vogler et al. 1996), namely (ULX2), (ULX4), (ULX5), (ULX6). For ULX4, ROSAT observations suggest an additional intrinsic absorption, with values from to cm-2, in addition to the Galactic column density ( cm-2). Instead, the best fit from ASCA data gives an upper limit of cm-2 (Mizuno et al. 1999). In our sample, only ULX2 indicates a possible extra absorption in addition to the Galactic , with 95% significance (cf. Table 3). Additional absorption in the fitting of ULX4 and ULX6 has low significance (68% and 82%, respectively). The values of are cm-2 and cm-2, respectively.
It is useful to note that Mizuno et al. (1999) suggest, on the basis of ASCA data, that this galaxy has no X-ray nucleus and that the twin bright sources in the middle of the galaxy could be two ULX. XMM-Newton has sufficient angular resolution to separate the two sources, one of them being ULX4; this is consistent with the ROSAT results. We identify the other source with the active nucleus.
3.9 NGC4639
We find two ULX, but one of them (ULX2) was detected with the MOS, but not with the PN, because its position fell into a gap between the PN chips. In both cases, the statistics were not sufficient to perform spectral fitting.
3.10 NGC4698
We find one ULX with sufficient statistics to perform spectral fitting. The best fit is a power law with (, ) that gives a flux of erg cm-2 s-1 and a luminosity of erg s-1.
Other statistically acceptable models are BB with keV (, ), BR with keV (, ), and MCD with keV (, ).
4 Counterparts at other wavelengths
We performed a search for possible counterparts at other wavelengths using available online databases (NED and Simbad). Results from a more extensive search are beyond the scope of the present paper and will be presented in a future work.
We find a point source in the online 2MASS catalog at from NGC4168–ULX1. Magnitudes are , , and in the , , and bands, respectively. ULX1 in NGC4168 also has a possible counterpart, away (EO1385–0040047), detected with the Automatic Plate Measuring Machine. In this case, the magnitude in the band is , while in the band it is .
At from NGC4565–ULX3, we find the dust cloud NGC4565–D–064–016 (Howk & Savage 1999). The cloud has dimensions pc and a column density cm-2. At the distance of Mpc, the angular dimensions are , so that this association could be possible.
Inside the error box of NGC4565–ULX4, we find two objects: one is the planetary nebula NGC4565–19, separated by (Jacoby et al. 1996), and the other is the globular cluster KAZF , separated by (Kissler–Patig et al. 1999).
Both ULX in NGC4639 are close to H II regions (see Evans et al. 1996). NGC4639–ULX1 is close to the region NGC4639–07 ( angular separation), while NGC4639–ULX2 is near NGC4639–64 () and NGC4639–81 (). The angular areas of these H II regions are arcsec2, arcsec2, arcsec2, respectively.
For NGC4698–ULX1 we found radio counterparts with the VLA at 6 cm, with an approximate flux density of mJy (Ho & Ulvestad 2001). Also in the optical band there are counterparts detected with the DSS (EO0041–0230928) and by the Hubble Space Telescope. A more detailed study on this source is in preparation (Foschini et al., in preparation).
5 Overall view and discussion
We have analyzed the X–ray data from XMM–Newton observations of 10 nearby Seyfert galaxies. The host galaxies are located between and Mpc, with 7/10 between and Mpc. Only one host galaxy (NGC4168) is elliptical (E2), while all the remaining are spirals of various types (see Table 1).
We found ULX in 9 of the 10 galaxies. The contamination with background sources is very low. Indeed, from XMM–Newton observations of the Lockman Hole, Hasinger et al. (2001) found about sources per square degree with flux higher than erg cm-2 s-1 in the energy band keV, and about sources per square degree in the energy band keV. Assuming the same and considering the flux limit reached by our observations, we expect to find, in the worst case (NGC4565), fewer than one (0.7) background source inside the ellipse. For all remaining host galaxies, the expected number of background objects is significantly less than one (0.2 for most of the cases). Therefore, we expect that, in the worst case, the overall sample contains fewer than 2 background objects.
The total number of ULX in the present catalog is 18. The mean value is 1.8 ULX per galaxy, with the maximum value in NGC4565 with 7 ULX and the minimum in NGC4138 with no detection. By omitting NGC4565, we have a mean value of about 1.2 ULX per galaxy. With respect to the ROSAT/HRI survey by Roberts & Warwick (2000), we find that XMM–Newton allows a significative improvement in the number of ULX detections (see Table 4). In Table 4 we list also the luminosities in and far-infrared bands of the host galaxies, the latter being a rough indicator of the star formation activity. At a first look, no evident correlation appears, but the present sample is very small. Although it appears that host galaxies with high and (NGC4501 and NGC4565) have a higher number of ULX, we caution that this effect could be spurious because our survey does not reach a uniform luminosity threshold to detected ULX. NGC4565, for example, reaches a flux limit of erg cm-2 s-1, which is deeper than the flux corresponding to the ULX luminosity limit of erg s-1 (cf. Sect. 2). For NGC4501, on the other hand, the flux limit is too shallow to reach this luminosity limit.
| Galaxy | Expected | Found | |||
|---|---|---|---|---|---|
| (1) | (2) | (3) | (4) | (5) | (6) |
| NGC1058 | 0.15 | 0.1 | 2 | 1.9 | |
| NGC3185 | 0.30 | 0.2 | 1 | 5.1 | |
| NGC3486 | 0.21 | 0.1 | 1 | 2.7 | |
| NGC3941 | 0.87 | 0.6 | 1 | 5.3∗ | |
| NGC4138 | 0.32 | 0.2 | 0 | 2.0∗ | |
| NGC4168 | 0.32 | 0.2 | 1 | 0.37 | |
| NGC4501 | 2.5 | 1.7 | 2 | 48 | |
| NGC4565 | 1.7 | 1.2 | 7 | 10 | |
| NGC4639 | 0.40 | 0.3 | 2 | 4.1 | |
| NGC4698 | 0.70 | 0.5 | 1 | 1.5 |
-
∗
Since no FIR data were available in Ho et al. (1997a), we calculate the FIR luminosity according to the relationship (Pogge & Eskridge 1993).
The luminosities observed are in the range erg s-1, depending on the model considered. If we make the simplistic assumptions that the accretion is uniform and spherical, that the bolometric luminosity approximately equals the X–ray luminosity, and that the Eddington ratio is , these luminosities correspond to compact objects with masses between and . However, the X–ray luminosity is generally only of the bolometric luminosity of the accreting sources (e.g., Mizuno et al. 1999). In addition, if the Eddington ratio is in the range of , as suggested by observations of Galactic black hole candidates (e.g., Nowak 1995), the mass range would shift toward . Unless the sources are very young, such high masses are difficult to explain for off–centre sources, because dynamical friction would tend to drag the objects toward the centre in less than the Hubble time (cf. Binney & Tremaine 1987).
Therefore, as proposed by several authors, alternative scenarios must be considered. For example, Makishima et al. (2000) proposed a Kerr black hole scenario: in this case, the luminosity produced by a spinning black hole can be up to 7 times larger than in a Schwarzschild black hole. On the other hand, King et al. (2001) suggested that the matter could accrete anisotropically: an anisotropic factor of reduces the values of the mass to those typically observed in X–ray binaries in the Milky Way. Something similar has been suggested by Begelman (2002): in this case, the presence of inhomogeneities in radiation pressure–dominated accretion disks, as a consequence of photon–bubble instability, would allow the radiation to escape. Finally, Körding et al. (2002) and Georganopoulos et al. (2002) suggested the possibility of relativistic beaming due to the presence of jets coupled to an accretion disk. Both are based on the microquasar model by Mirabel & Rodriguez (1999).
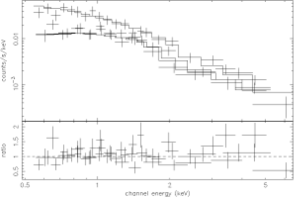
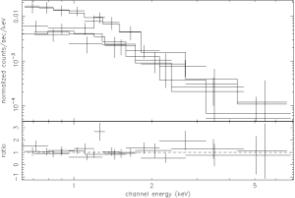
The statistics of the present observations do not allow us to discriminate clearly between the different models, but we can infer some useful hints from the eight sources, which gave sufficient counts for a spectral fitting. In 5/8 cases the best-fit model is obtained with a simple power law with (for an example of spectra, see Fig. 4). One of these five sources (NGC1058–ULX1) presents an almost flat spectrum (). For the remaining sources (2/8), we obtained a best fit with the black body model with keV.
It is known that the emission expected from a black hole X–ray binary is variable: in the hard state, the spectrum is typically a power law with , while in the soft state the spectral index increases up to about 2.5 and a soft component appears in the X–ray spectrum (e.g., Ebisawa et al. 1996). Therefore, our sources could be black hole X–ray binaries in a hard or soft state. Terashima & Wilson (2002) proposed the existence of two different populations of ULX, one characterized by soft thermal and the other by non–thermal X–ray emission. A possible key to distinguish between the available hypotheses can be to perform time variability studies, but current statistics are too low for such a study.
It is interesting to note that the MCD model, which has often been successful in the past for ULX (e.g., Colbert & Mushotzky 1999; Makishima et al. 2000) is never the best fit in our data. Even when we obtain a reasonable fit with MCD, a simple black body model is statistically better. This may be due to the low photon counts of the present spectra.
The unsaturated Comptonization (CST) model does not give acceptable fits, except for ULX4 in NGC4565, for which it represents the second best fit, after the power law.
Our understanding of the nature of ULX is limited by the fact that, to date, counterparts at other wavelengths are quite rare (Roberts et al. 2001; Pakull & Mirioni 2002; Wang 2002). In our sample, we note that one source (NGC4698–ULX1) is detected in the radio (6 cm). NGC4168–ULX1 and NGC4639–ULX2 both show a highly probable optical counterpart. In the second case, it is identified as a H II region, which is a type of counterpart frequently associated with ULX (Pakull & Mirioni 2002). It is worth noting the case of NGC4656–ULX3 could be obscured by, rather than correlated with, a dust cloud. Finally, the probable counterparts of NGC4168–ULX1 and NGC4698–ULX1 appear to be considerably red objects, with mag.
6 Final remarks
We have found 18 ULX in a sample of 10 nearby Seyfert galaxies. This is the first step of a larger survey comprising 28 Seyfert galaxies with distances smaller than 22 Mpc to be observed with XMM–Newton.
A more detailed analysis will be presented in later papers, when the complete sample of XMM–Newton observations will be available, together with follow–up observations at other wavelengths. In the meantime, the present X–ray catalog provides a basis for future X–ray and optical studies.
Acknowledgements.
This work is based on observations obtained with XMM–Newton, an ESA science mission with instruments and contributions directly funded by ESA Member States and the USA (NASA). This research has made use of the NASA’s Astrophysics Data System Abstract Service and of the NASA/IPAC Extragalactic Database (NED), which is operated by the Jet Propulsion Laboratory, California Institute of Technology, under contract with the National Aeronautics and Space Administration. We acknowledge the partial support of the Italian Space Agency (ASI) to this research.References
- (1) Begelman M.C., 2002, ApJ 568, L97
- (2) Binney J. & Tremaine S., 1987, Galactic dynamics. Princeton University Press, Princeton
- (3) Cappi M., Di Cocco G., Panessa F., et al., 2002, Proc. Symp. New Visions of the X–ray Universe in the XMM–Newton and Chandra era, astro–ph/0202245
- (4) Colbert E.J.M. & Mushotzky R.F., 1999, ApJ 519, 89
- (5) Cotton W.D., Condon J.J. & Arbizzani E., 1999, ApJS 125, 409
- (6) Di Cocco G., Cappi M., Trifoglio M., et al., 2000, American Astronomical Society, HEAD Meeting 32
- (7) Ebisawa K., Titarchuk L. & Chakrabarti S.K., 1996, PASJ 48, 59
- (8) Ehle M., Breitfellner M., Dahlem M., et al., 2001. XMM–Newton User’s Handbook Issue 2.0. ESA XMM-SOC
- (9) Evans I.N., Koratkar A.P., Storchi–Bergmann T., et al., 1996, ApJS 105, 93
- (10) Fabbiano G., 1989, ARA&A 27, 87
- (11) Fabbiano G., Trinchieri G. & Van Speybroeck L.S., 1987, ApJ 316, 127
- (12) Fabbiano G., Zezas A. & Murray S.S., 2001, ApJ 554, 1035
- (13) Foschini L., Di Cocco G., Dadina M., et al., 2002, Proc. Symp. New Visions of the X–ray Universe in the XMM–Newton and Chandra era, astro–ph/0202247
- (14) Georganopoulos M., Aharonian F.A. & Kirk J.G., 2002, A&A 388, L25
- (15) Ghizzardi S., 2001. In flight calibration of the PSF for the MOS1 and MOS2 cameras. EPIC–MCT–TN–011 (Internal report)
- (16) Jacoby G.H., Ciardullo R. & Harris W.E., 1996, ApJ 462, 1
- (17) Jansen F., Lumb D., Altieri B., et al., 2001, A&A 365, L1
- (18) Halderson E.L., Moran E.C., Filippenko A.V., et al., 2001, ApJ 122, 637
- (19) Hasinger G., Altieri B., Arnaud M., et al., 2001, A&A 365, L45
- (20) Ho L.C., Feigelson E.D., Townsley L.K., et al., 2001, ApJ 549, L51
- (21) Ho L.C., Filippenko A.V. & Sargent W.L.W., 1997a, ApJS 112, 315
- (22) Ho L.C., Filippenko A.V. & Sargent W.L.W., 1997b, ApJ 487, 568
- (23) Ho L.C. & Ulvestad J.S., 2001, ApJS 133, 77
- (24) Howk J.C. & Savage B.D., 1999, AJ 117, 2077
- (25) King A.R., Davies M.B., Ward M.J., et al., 2001, ApJ 552, L109
- (26) Kissler–Patig M., Ashman K.M., Zepf S.E., et al., 1999, AJ 118, 197
- (27) Körding E., Falcke H. & Markoff S., 2002, A&A 382, L13
- (28) La Parola V., Peres G., Fabbiano G., et al., 2001, ApJ 556, 47
- (29) Lumb D.H., 2002, Proc. Symp. New Visions of the X–ray Universe in the XMM–Newton and Chandra era, astro–ph/0203278
- (30) Makishima K., Kubota A., Mizuno T., et al., 2000, ApJ 535, 632
- (31) Mirabel I.F. & Rodríguez L.F., 1999, ARAA 37, 409
- (32) Mitsuda K., Inoue H., Koyama K., et al., 1984, PASJ 36, 741
- (33) Mizuno T., Ohnishi T., Kubota A., et al., 1999, PASJ 51, 663
- (34) Nowak M.A., 1995, PASP 107, 1207
- (35) Pakull M.W. & Mirioni L., 2002, Proc. Symp. New Visions of the X–ray Universe in the XMM–Newton and Chandra era, astro–ph/0202488
- (36) Pappa A., Georgantopoulos I., Stewart G.C. et al., 2001, MNRAS 326, 995
- (37) Pogge R.W. & Eskridge P.B., 1993, AJ 106, 1405
- (38) Read A.M., Ponman T.J. & Strickland D.K., 1997, MNRAS 286, 626
- (39) Roberts T.P., Goad M.R., Ward M.J., et al., 2001, MNRAS 325, L7
- (40) Roberts T.P. & Warwick R.S., 2000, MNRAS 315, 98
- (41) Strüder L., Briel U., Dennerl K., et al., 2001, A&A 365, L18
- (42) Sunyaev R.A. & Titarchuk L.G., 1980, A&A 86, 121
- (43) Supper R., Hasinger G., Pietsch W., et al., 1997, A&A 317, 328
- (44) Terashima Y. & Wilson A.S., 2002, Proc. Symp. New Visions of the X–ray Universe in the XMM–Newton and Chandra era, astro–ph/0204321
- (45) Turner M.J., Abbey A., Arnaud M., et al., 2001, A&A 365, L27
- (46) Vogler A., Pietsch W. & Kahabka P., 1996, A&A 305, 74
- (47) Wang Q.D., 2002, MNRAS 332, 764
- (48) Zezas A., Fabbiano G., Prestwich A., et al., 2001, astro–ph/0109302