L.V. Shalyapina,
A Spectroscopic Study of the Peculiar Galaxy UGC 5600
Abstract
We present our observations of the galaxy UGS 5600 with a long-slit spectrograph (UAGS) and a multi-pupil field spectrograph (MPFS) using the 6-m telescope of Special Astrophysical Observatory. Radial-velocity fields of the stellar and gaseous components were constructed for the central region and inner ring of the galaxy. We proved the existence of two almost orthogonal kinematic subsystems and conclude that UGC 5600 is a galaxy with an inner polar ring. In the circumnuclear region, we detected noncircular stellar motions and suspected the existence of a minibar. The emission lines are shown to originate in H II regions. We estimated the metallicity from the intensity ratio of the [NII] and Hα lines to be nearly solar, which rules out the possibility that the polar ring was produced by the accretion of gas from a dwarf companion. c 2002 MAIK ”Nauka/Interperiodica ”.
1 INTRODUCTION
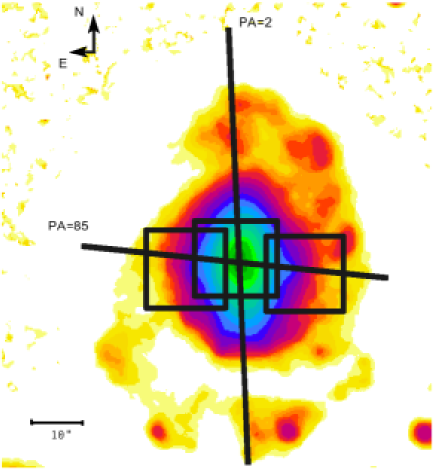
Polar-ring galaxies (PRGs) are objects with two kinematic subsystems rotating in roughly orthogonal planes. Based on its structural features (see Fig. 1), Whitmore et al. (1990) listed the peculiar galaxy UGC 5600 among the most probable PRG candidates: its amorphous main body is surrounded by a broad outer ring and the brightenings attributed to the inner ring are observed in the EW direction on both sides of the center at a distance of . UGC 5600 is a member of a double system (VV 330). Its companion, the galaxy UGC 5609, is at 14 (about 15 kpc in projection onto the plane of the sky) to the southeast and has a similar radial velocity. Recently two other galaxies with similar redshifts have been detected near VV 330 (Galletta et al. 1997) ; all of them may represent a group of galaxies.
Among other galaxies from the catalog of Whitmore et al. (1990) , UGC 5600 was observed in the radio range at a wavelength of 21 cm (Richter et al. 1994). The ratio was found to be 0.86 , characteristic of late-type galaxies. CO-line observations revealed molecular hydrogen in all structures of the galaxy (Galletta et al. 1997).
The spectra of the galaxy along its major and minor axes were obtained by Reshetnikov and Combes (1994). The radial-velocity curves are complex in shape. The authors suggested counterrotation in the central part of the galaxy ( ) and gas rotation around its major axis. In addition, they pointed out that the galaxy is rich in gas and that the Hα emission extends to (6 kpc).
A detailed photometric study of UGC 5600 (Karataeva et al., 2001) shows that this is most likely a late-type spiral (Scd) galaxy with an inner polar ring, which is projected onto the galaxy main body on the northern side and is seen through it on the southern side. The structure that was taken in the catalog of Whitmore et al. (1990) as an outer ring represents two tightly wound spiral arms.
The final conclusion whether UGC 5600 belongs to PRGs can be reached only after proving the existence of two nearly orthogonal kinematic subsystems.
The distance to the galaxy is 37.6 Mpc () and the scale is 0.18 kpc in .
2 OBSERVATIONS AND DATA REDUCTION
All of the spectroscopic data were obtained at the prime focus of the 6m telescope of Special Astrophysical Observatory (SAO). A log of observations is given in the table 1.
The observations with the UAGS long-slit spectrograph (Afanasiev et al., 1995) were carried out in January 2000 at two slit positions: along the galaxy major axis () and along the polar-ring major axis () ; according to Karataeva et al. (2001), this axis passes south of the galaxy photometric center (see Fig. 1). The spectral range covered included the Hα , [N II ] , and [S II ] emission lines. The detector was a Photometrics -pixel CCD array. In the observations, the spectrograph slit size was , the reciprocal dispersion was 1.2Åper pixel, the spectral resolution was 3.6Å, and the angular scale along the slit was 04 per pixel.
The UAGS spectra were reduced by using standard procedures from the ESO-MIDAS package. After the primary reduction, we carried out a smoothing along the slit with a 08 window for the central region and a window starting from a distance of from the center. The radial velocities were measured from the centroid positions of the Gaussians fitted in the emission lines. The accuracy of these measurements was estimated from the night-sky [OI] line to be . We also measured the relative intensities and FWHMs of the above emission lines. The observed FWHMs were corrected for the instrumental profile width using the standard relation .
To study the kinematics of the ionized gas and stars in the inner regions of UGC 5600 in detail, we observed the galaxy by the method of integral-field spectroscopy with a multi-pupil fiber spectrograph (MPFS) (Afanas ’ev et al. 2001) attached to the 6m
telescope. The spectrograph simultaneously takes spectra from 240 spatial elements (constructed in
the form of square lenses) that form an array of elements in the plane of the sky. The angular
size of a single element is . A description of the spectrograph is given in the Internet on the SAO
www-page (http://www.sao.ru/~gafan/devices.htm.). Simultaneously with galaxy spectra, we took a
night-sky spectrum from an area located at 45 from the center of the field of view.
The detector was a TK1024 -pixel CCD array. The spectrograph reciprocal dispersion was Å per pixel and
the spectral resolution was Å. The observations were performed sequentially in two spectral ranges.
The ”green” range included emission lines (Hβ , [O III ]) and absorption lines of the
galaxy stellar population (Mg I , Fe I, Fe I +Ca I, etc.). The ”red ”range contained the
Hα , [N II], [S II] emission lines.
| Date, instrument | Exposure time, s | Field | Seeing | Spectral range, Å | PA, field |
|---|---|---|---|---|---|
| Jan. 28, 2000 | 1800 | 20 | |||
| UAGS | 1800 | 2.0 | |||
| 1200 | 2.0 | ||||
| Jan. 28, 2001 | 1800 | 2.0 | Center | ||
| MPFS | 1200 | 2.0 | E side | ||
| 1200 | 2.0 | W side | |||
| 900 | 1.5 | Center | |||
| 1200 | 2.0 | E side | |||
| 1200 | 2.0 | W side | |||
| Apr. 28, 2001 | 600 | 2.0 | Center | ||
| MPFS | 1200 | 2.0 | to north | ||
| Aug. 11, 2001 | 1200 | 1.0 | Center | ||
| MPFS | 900 | 1.0 | Center |
We reduced the observations using the software developed at the SAO and running in the IDL environment. The primary reduction included bias subtraction, flat-fielding, cosmic-ray hit removal, extraction of individual spectra from CCD images, and their wavelength calibration using the spectrum of a calibration lamp. Subsequently, we subtracted the nightsky spectrum from the galaxy spectra. The spectra of spectrophotometric standard stars were used to convert fluxes into absolute energies.
We constructed two-dimensional intensity and radial-velocity (velocity fields) maps in the Hα , Hβ , [O III], and [N II] lines; the emission line profiles were also fitted with Gaussians. The accuracy of the absolute radial-velocity determination estimated from sky lines ranges from 10 to . The radial-velocity fields for the stellar component were constructed by the cross correlation technique (Tonry and Davis 1979) modified to work with integral-field spectroscopy and detailed by Moiseev (2001). We used the spectral range 5200 to 5500Å containing high-contrast lines of the galaxy stellar population. The spectra of G8-K3 III stars and the twilight sky observed on the same nights as the galaxy were taken as the radial-velocity standards. The accuracy of the radial-velocity determination is .
The January 2001 observations were carried out at three different positions of the spectrograph field of view (Fig. 1). The resulting fields of velocities and emission-line intensities were combined to give a total field of view. We measured the radial velocities of the stellar component only for the central field, because the contrast of the stellar lines in the outermost parts decreases sharply.
In April 2001, we managed to construct a more extended radial-velocity field by using two MPFS fields (one coincided with the galaxy photometric center and the other was displaced by to the north). The resulting field of view was . When studying this velocity field in detail, we suspected that the central region of the galaxy, in size, was kinematically decoupled (see below). To check this feature, we repeated our observations of the stellar kinematics in the central region of UGC 5600 in August 2001, at seeing. The derived velocity field with a higher angular resolution was also used in our analysis. Here, all radial velocities were reduced to the solar center (heliocentric velocities).
3 RESULTS OF OBSERVATIONS WITH THE LONG-SLIT SPECTROGRAPH
Data on the UAGS observations are given in the first three rows of the table. In our spectra of the galaxy UGC 5600 along its major axis, the Hα emission line is traceable up to distances of kpc from the center.
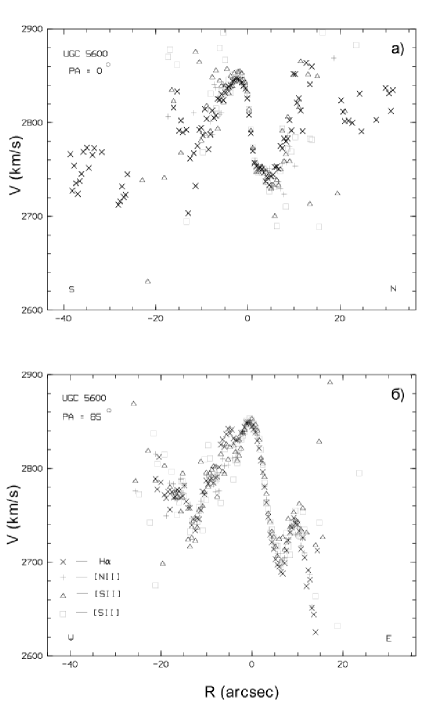
The radial-velocity curves along the galaxy major axis ( ) and along the major axis of the inner ring ( ) are shown in Fig. 2a and 2b. We see from these figures that the radial velocities measured from different emission lines are equal, within the error limits. Our radial-velocity curves are similar to those in Reshetnikov and Combes (1994) and the small deviations are most likely due to difference in the spectrograph slit positions. The mean heliocentric velocity of the photometric center is , which is lower than its value in Reshetnikov and Combes (1994) by .
The radial-velocity curve along the galaxy major axis is complex in shape. The curve exhibits a small rectilinear segment where the velocity increases from 0 to ; then, at a distance of from the center, the scatter of points increases and further out, the mean radial velocity decreases. Reshetnikov and Combes (1994) concluded that counterrotation was observed in the central part of the galaxy ( ). However, a detailed photometric study of this galaxy (Karataeva et al., 2001) shows that we see the total radiation from the galactic disk and inner ring exactly at distances of from the center. Therefore, the interpretation of the observed radial velocities in this range is rather complex and contradictory.
Where the slit crosses the spiral arms , the measurement errors of the radial velocities are large because the lines are weak. However, the velocity relative to the system center is, on average, , with the southern side approaching us and the northern side receding. The radial-velocity curve along the ring major axis (Fig. 2b) is also complex in shape. This is most likely because the cut passes through different galactic structures.
Thus, we see that despite a wealth of information obtained with the long-slit spectrograph, the interpretation of the observed radial velocities of the emitting gas is ambiguous. One-dimensional cuts are not enough to understand the kinematics of such a multicomponent object. It is necessary to investigate the two-dimensional velocity fields of the gas and stars. This is the goal of our MPFS observations.
4 KINEMATICS OF THE STELLAR AND GASEOUS COMPONENTS
Data on the MPFS observations are also given in the table. Below, we discuss the results of our 2D spectroscopy.
4.1 The Radial-Velocity Distribution for the Stellar Component
We determined the radial velocities of the stellar component by cross-correlation analysis. Since the stellar-velocity dispersion turned out to be comparable with the spectrograph instrumental profile , we could not reliably measure it and study its variations across the galaxy. The low stellar velocity dispersion confirms the conclusion of Karataeva et al. (2001) that UGC5600 is a late-type galaxy.
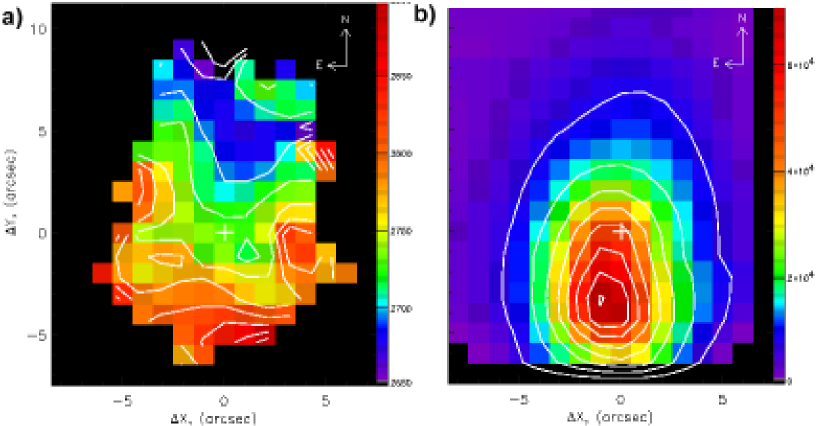
Figure 3 shows the stellar radial-velocity field and the continuum (Å) intensity distribution. We see from Fig. 3a that the isovels are complex in shape. The isophotes in the continuum image (Fig. 3b) are clearly distorted. These distortions may be due to the presence of a feature in the nuclear region, due to the clumpy structures in the ring superimposed on the galaxy main body, and due to the nonuniform distribution of dust, whose presence follows from the IR fluxes (Richter et al. 1994), both in the ring and in the galactic disk. The presence of dust may also affect the pattern of the radial-velocity field.
If we consider the central region belonging to the galactic disk, then the shape of the isovels mainly corresponds to the circular rotation of stars around the galaxy minor axis. For this region, we constructed the average rotation curve and the radial dependence of the kinematic-axis position angle. We used the tilted ring technique (Begeman 1989; Moiseev and Mustsevoi 2000): the velocity field is broken down into elliptical rings of fixed width and the rotation velocity and the kinematic-axis position angle are determined in each ring under the assumption of circular rotation. In addition, conclusions about the pattern of noncircular motions can be drawn from an analysis of the variations in the position of the kinematic axis and in the disk inclination to the line of sight.
The cross in Fig. 3 marks the position of the kinematic center of the stellar component, which was determined from the symmetry of the velocity field. The photometric and kinematic centers do not coincide, but the separation between them is less than . The differences in the positions of the photometric and kinematic centers may be due to the presence of features in the circumnuclear region. Within the accuracy of our modeling, the position angle of the kinematic axis coincides with the position angle of the photometric axis from Karataeva et al. (2001) and the system heliocentric velocity is . The system velocities that we determined from stars and gas differ approximately by ; such differences are also observed for other galaxies (see, e. g. , Sil ’chenko 1998). The inclination of the stellar disk to the plane of the sky is , which is close to the value from Karataeva et al. (2001), and its rotation velocity slowly increases from (at a distance of ) to (at ).
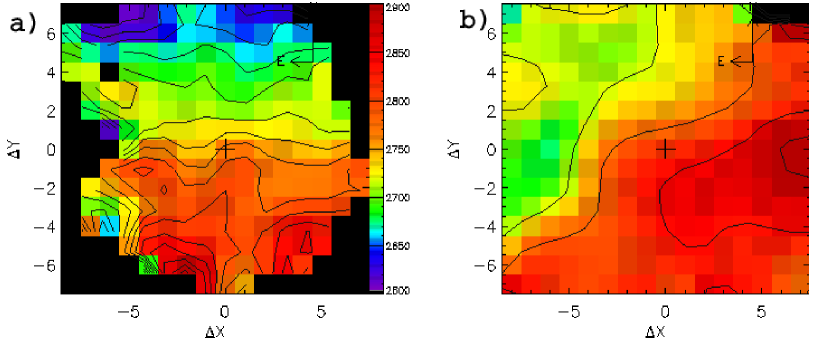
Analyzing in detail the stellar radial-velocity field in the circumnuclear region, in size, we suspected a peculiarity in the behavior of the isovels. However, the space resolution was too low to study it. Therefore, as we pointed out above, additional observations were carried out at seeing no worse than . Figure 4a shows the stellar radial-velocity field constructed from these data. Noncircular stellar motions clearly show up in a region, which may suggest the existence of a minibar that is possibly formed in the disk because of the close passage of a companion (Noguchi 1987). The (nearly triangular) shape of the isophotes in Fig. 3b and the asymmetry in the circumnuclear region of the photometric cuts along the galaxy major axis shown in Fig. 2 from Karataeva et al. (2001) are also consistent with this suggestion. However, observations with a higher space resolution are needed for the final conclusion about the presence of a minibar to be reached.
Two features that recede with velocities show up at 45 from the center in the NE and W directions (Fig. 3a). The W feature may belong to the inner ring. At the same time, the velocity of the NE feature is opposite to the velocity of the ionized gas in the inner ring, while this feature is located far ( kpc) from the disk center.
4.2 The Radial-Velocity Distribution for the Gaseous Component
We constructed the radial-velocity fields of the gas from hydrogen (Hα , Hβ ) lines and from the forbidden [O III] line. They all proved to be similar. The radial-velocity curves obtained from the velocity fields are in good agreement with the radial-velocity curves given in the preceding section.
Hα is the brightest emission line. Since the accuracy of measuring the radial velocities from it is higher, below we present only the data obtained from this line. For convenience of comparing the behaviors of the gaseous and stellar components, Fig. 4 shows the velocity fields of the stars (a) and the ionized gas (b) for the galaxy central region. A detailed analysis of the gas kinematics indicates that the slope of the isovels in the central part, in diameter, is identical to the slope of the isovels for the stellar component. Further out, in the E -W direction, the isovels are turned through about , suggesting gas rotation about the galaxy major axis.
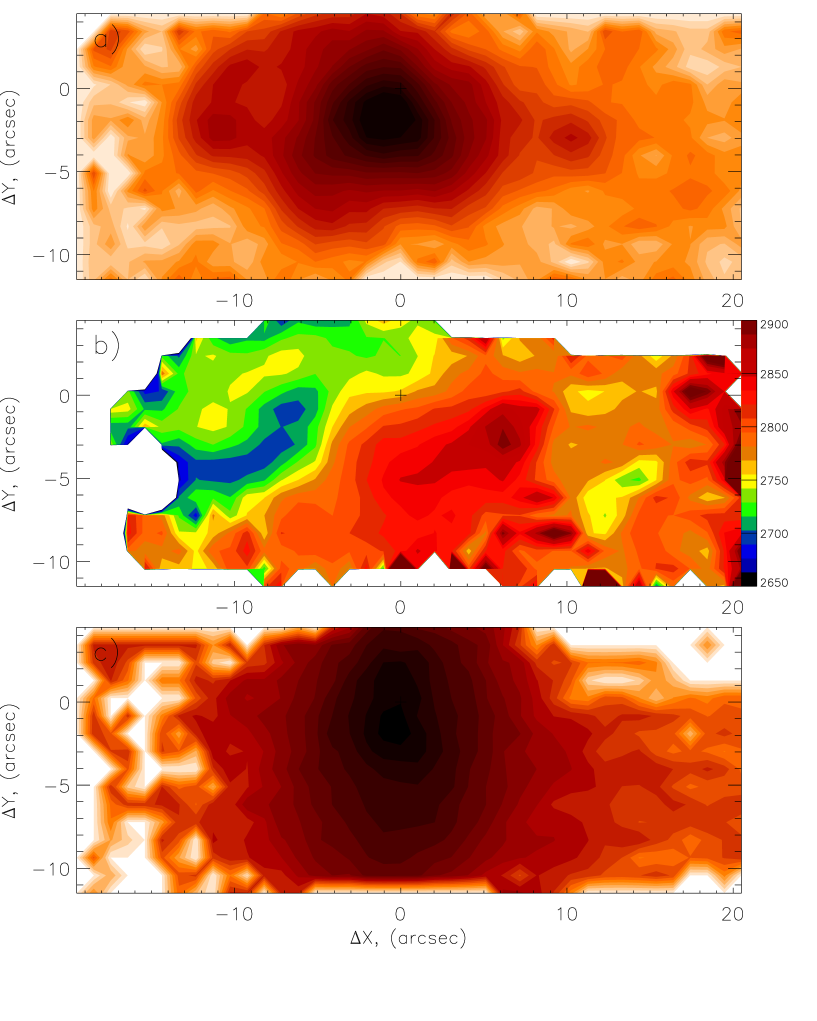
To analyze the behavior of the emitting gas in the galactic inner ring, Fig. 5 shows the Hα intensity distribution, the total radial-velocity field, and continuum ( Å) intensity variations. In contrast to the continuum intensity distribution (Fig. 5c), the Hα image (Fig. 5a) is elongated from east to west and coincides with the ring location, but the ellipticity of the Hα isophotes changes. They become rounder as one approaches the center. South of the center, the isophotes flatten. This isophotal behavior can be explained by assuming that there are two gaseous components. The first is associated with the galactic disk and the second is associated with the inner ring. In the central region, we observe the total radiation from the two components. The isophote flattening south of the center may imply that on this side the ring is projected onto the galactic disk and its dust partially absorbs the disk radiation. Note that our assumption is in conflict with the conclusion of Karataeva et al. (2001). Since the region with blue color indices on the southern side is narrower than on the northern side, these authors assumed that the ring was projected onto the galactic body north of the center and was seen through it south of the center. However, such a peculiarity of the color indices may be due to the nonuniform ring structure. For example, it may stem from the fact that the southern side of the ring is slightly narrower than its northern side. Therefore, the behavior of the Hα isophotes seems to characterize the ring orientation more reliably, especially since the isophotes are similar in shape in all emission lines.
The existence of two gaseous components must affect the shape of the line profiles along the galaxy major axis, particularly at distances of south and north of the center, where the ring and the disk are superimposed on each other. A significant scatter of points is observed precisely in these segments of the radial-velocity curve (Fig. 2). The line profiles are irregular in shape and can be fitted by two Gaussians. However, the reliability of this fit is low, because the errors are large.
The assumption that there are two gaseous components is also confirmed by the shape of the isovels in Figs. 4b and 5b. At the center, where the directions of the isovels for the gaseous and stellar components coincide, the radial-velocity field is determined by the motion of the gas belonging to the galactic disk, while starting approximately from east and west of the center, the ring gas motion shows up clearly.
Assuming circular rotation, we attempted to model the gas motion in the ring (without the central region in size) and to estimate the ring inclination to the plane of the sky. We estimated the latter to be . Knowing the inclination of the galactic disk and the ring to the plane of the sky, we can determine the angle between the disk and the ring from the relation
where and are the disk and ring inclinations to the plane of the sky, and are the position angles of the major axes of the galactic disk and the ring. This angle was found to be about ; i. e. , the ring is polar. A close examination of Fig. 5b reveals several features in the radial-velocity field. For example, there is a feature receding with a velocity of at distance of to the west. Such features may result from the nonuniform ring structure. Their presence may stem from the fact that individual bright H II regions fall on the line of sight. The right part of Fig. 5b, starting from , corresponds to the spiral arm receding at a velocity of .
5 CHARACTERISTICS OF THE EMISSION-LINE REGIONS
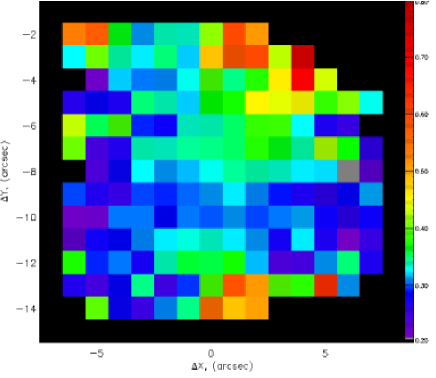
As was already pointed out above, we measured the Hα FWHMs and the relative emission-line intensities at various distances from the nucleus. Our measurements for the nuclear region closely agree, within the error limits, with the results of Reshetnikov and Combes (1994), who showed that the nuclear emission originates from H II regions. Figure 6 presents the distribution of the Hα ratio for the central region of the galaxy. The logarithms of this ratio fall within the range to , which is characteristic of H II regions (Veilleux and Osterbrock 1987). Therefore, we may conclude that the emission lines in the nucleus and in the ring originate in H II regions. The intensity ratio of forbidden and permitted lines is virtually constant along the major axis of the polar ring, suggesting that the physical conditions in the emission-line regions are similar. The forbidden-line intensity increases with distance from the nucleus along the galaxy major axis compared to Hα . To confirm that the increase in forbidden-line intensity (Fig. 6) is unrelated to the edge effects of the multipupil spectrograph, we considered the data acquired with the long-slit spectrograph. It turned out that the Hα ratio at the center is 0.35 and then gradually increases, reaching 0.6 at ; further out, it is roughly constant up to . The emission-line intensity decreases with distance from the center and starting from about , the signal-to-noise ratio is . Therefore, we cannot reliably determine the line intensity ratio in these regions.
The strengthening of the nitrogen forbidden lines compared to Hα appears to be due to an increase in the importance of the collisional excitation as the galactic gaseous disk interacts with the polar-ring gas.
Here, our prime objective was to study the kinematics of the gaseous and stellar components. Therefore, the observations were carried out only in the green and red spectral ranges and we cannot determine the physical conditions in H II regions and their chemical composition from our data. However, we attempted to estimate the metallicity in the emission-line regions.
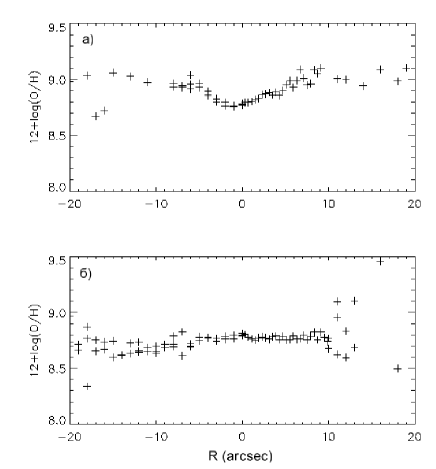
According to Denicolo et al. (2001), there is an empirical relation between and :
its form depends neither on the flux calibration nor on the reddening corrections. Using this relation, we estimated the metallicity in H II regions. Figure 7 shows the radial distribution of along the galaxy major axis and along the ring major axis. As was already pointed out above, the shape of the distribution in Fig. 7a results from an increase in the nitrogen-line intensity compared to the Hα intensity, possibly because the collisional excitation increases in importance. Besides, the empirical relation is reliable for an ratio below 0.5. Therefore, the increase in in the regions between and north and south of the center may not result from an increase in metallicity. The values of are virtually constant along the major axis of the polar ring (Fig. 7b), suggesting that the physical conditions in the ring are homogeneous.
The mean metallicity in the circumnuclear region and in the polar ring is , which corresponds to . A similar estimate was also obtained from [S II] lines by using the sum of the [S II] line fluxes. This result corresponds to normal evolution in galaxies with such luminosities (Richer et al. 1998).
The nearly solar metallicity in the polar ring implies that it cannot not be produced by the capture of a dwarf companion.
6 CONCLUSIONS
In conclusion, we summarize our main results.
-
1.
Based on 2D spectroscopy, we constructed the radial velocity fields of the stellar and gaseous components for the central regions of the peculiar galaxy UGC 5600.
-
2.
An analysis of these fields revealed two kinematic subsystems: the first is related to the galactic disk and the second is related to the inner ring.
-
3.
The angle between the disk and ring planes was found about ; i.e., the inner ring is polar. This provides compelling evidence that the galaxy UGC 5600 belongs to PRGs.
-
4.
We established from the intensity ratio of forbidden and permitted lines that the emission originates in H II regions; the metallicity was estimated. It proved to be nearly solar, which rules out a dwarf galaxy as the donor in forming the polar ring.
Acknowledgements.
We are grateful to the 6m telescope committee for allocating telescope observational time and to the SAO staff: V. L. Afanasiev for assistance in the MFPS observations and for providing data reduction software; A. N. Burenkov for assistance in the UAGS observations and data reductions. We wish to thank O. K. Sil ’chenko for helpful discussions and remarks. This study was supported in part by the ”Astronomy ” program (project no.1.2.6.1) and the ”Integration ” program (project no.A0007).References
- [] Afanasiev V.L., Burenkov A.N., Vlasyuk V.V., and Drabek S., 1995, Report of the SAO RAS, 234 [in Russian]
- [] Afanasiev V.L., Dodonov S.N., and Moiseev A.V. , 2000, in Stellar Dynamics: from Classic to Modern, Ed. by Ossipkov L.P. and Nikiforov I.I., St. Petersburg.
- [] Begeman K.G., 1989, A&A, 223 , 47
- [] Denicolo G., Terlevich R., and Terlevich E., 2001, MNRAS, 330, 69
- [] Galletta G., Sage L.J., and Sparke L.S., 1997, MNRAS, 284 , 773
- [] Karataeva G.M., Yakovleva V.A., Hagen-Thorn V.A., and Mikolaichuk O.V., 2001, Astron. Lett., 27 , 74
- [] Moiseev A. V., Bull. SAO, 2001, 51, 11 (astro-ph/0111219).
- [] Moiseev A.V. and Mustsevoi V.V., 2000, Astron. Lett., 26, 565
- [] Noguchi M., 1987, MNRAS, 228, 635
- [] Reshetnikov V.P. and Combes F., 1994, A&A, 291, 57
- [] Richer M.G., McCall M.L., and Stasinska G., 1998, (astro-ph/9809302).
- [] Richter O.R., Sackett P.D., and Sparke L.S., 1994, AJ, 107 , 99
- [] Sil ’chenko O.K., A&A, 330, 412
- [] Tonry J. and Davis M., 1979, AJ, 84 , 1511
- [] Veilleux S. and Osterbrock D.E., 1987, ApJS, 63, 295
- [] Whitmore B.C., Lucas R.A., McElroy D.B., et al. , 1990, AJ, 100, 1489
Translated by N. Samus’