Membership, metallicity and lithium abundances for solar-type stars in NGC 6633
Abstract
We present spectroscopic observations of candidate F, G and K type stars in NGC 6633, an open cluster with a similar age to the Hyades. From the radial velocities and metal-line equivalent widths we identify 10 new cluster members including one short period binary system. Combining this survey with that of Jeffries (1997), we identify a total of 30 solar-type members. We have used the F and early G stars to spectroscopically estimate [Fe/H] for NGC 6633. When compared with iron abundances in other clusters, determined in a strictly comparable way, we can say with more precision that NGC 6633 has dex less iron than the Pleiades and dex less iron than the Hyades. A photometric estimate of the overall metallicity from the locus of cluster members in the B-V, V-Ic plane, yields [M/H] . A new estimate, based upon isochrones that are empirically tuned to fit the Pleiades, gives a distance modulus to NGC 6633 that is larger than the Pleiades.
Lithium abundances have been estimated for the NGC 6633 members and compared with consistently determined Li abundances in other clusters. Several mid F stars in NGC 6633 show strong Li depletion at approximately the same effective temperature that this phenomenon is seen in the Hyades. At cooler temperatures the Li abundance patterns in several open clusters with similar ages (NGC 6633, Hyades, Praesepe and Coma Berenices) are remarkably similar, despite their differing [Fe/H]. There is however evidence that the late G and K stars of NGC 6633 have depleted less Li than their Hyades counterparts. This qualitatively agrees with models for pre-main sequence Li depletion that feature only convective mixing, but these models cannot simultaneously explain why these stars have in turn depleted Li by more than 1 dex compared with their ZAMS counterparts in the Pleiades. Two explanations are put forward. The first is that elemental abundance ratios, particularly [O/Fe], may have non-solar values in NGC 6633 and would have to be higher than in either the Hyades or Pleiades. The second is that additional non-convective mixing, driven by angular momentum loss, causes additional photospheric Li depletion during the first few hundred Myr of main sequence evolution.
keywords:
stars: abundances – stars: late-type – stars: rotation – open clusters and associations: individual: NGC 66331 Introduction
Solar-type stars in open clusters are the obvious laboratories in which to study the evolution and timescales of a variety of physical phenomena (e.g. magnetic activity, rotation, mixing). Over the last couple of decades the Pleiades and Hyades, with ages of approximately 100 Myr and 700 Myr, have been the basis of much that has been deduced about the time-scales for the decline of rotation rates, X-ray activity and surface lithium abundances in solar type stars (e.g. Stern et al. 1992, 1995; Soderblom et al. 1993a,b; Thorburn et al. 1993; Stauffer et al. 1994; Krishnamurthi et al. 1997, 1998).
Consideration of these clusters alone, is not sufficient. Younger and older clusters need to be (and have been) studied of course, but observing clusters with similar ages to the Pleiades and Hyades is also important. Reasons include the possibilities: (a) that initial angular momentum or binary fractions are different from cluster to cluster, influencing their later behaviour; (b) that differing compositions or abundance ratios affect convection zone properties, which then feed in to the physical processes mentioned above. An important illustration of this is the, as yet unexplained, different X-ray luminosity functions of solar-type stars in the Hyades and Praesepe, even though they share similar ages (Randich & Schmitt 1995).
In the last few years we have been adding to this database by studying the open cluster NGC 6633 ( C 1825065, Jeffries 1997; Briggs et al. 2000; Harmer et al. 2001). The age of this cluster is found to be similar to the Hyades and Praesepe by a number of authors by looking at the main sequence turn-off and position of evolved stars in the Hertzsprung-Russell diagram (e.g. Harris 1976; Mermilliod 1981). However, the metallicity of NGC 6633 may be lower than either. Schmidt (1976), using photometry, estimated a metallicity 0.2 dex lower than the Hyades and a distance of 348 pc. Cameron (1985) gives [M/H] of , and for NGC 6633, the Hyades and Praesepe using UBV photometry, and also finds distance and reddening estimates for NGC 6633 of 336 pc and . The Lynga (1987) catalogue uses weighted means from several different studies (see Janes, Tilley & Lynga 1988) to give [M/H] of , , and ages of 630 Myr, 710 Myr, 830 Myr for NGC 6633, the Hyades and Praesepe respectively and we will adopt these ages in the rest of the paper. A distance of 312 pc and is also quoted for NGC 6633 by Lynga (1987), although we have the means in this paper to make an independent distance estimate. Spectroscopic estimates of the metallicity are currently rather crude. Jeffries (1997) estimates [Fe/H] between and for a range of possible reddenings. In summary, NGC 6633 likely provides a slightly lower metallicity analogue of the Hyades and Praesepe at a similar age.
Membership for solar-type stars in NGC 6633 can come via several routes. Sanders (1973) presents proper motions for 497 stars, complete to nearly . Only a small fraction of these are classed as probable members and are primarily brighter stars. Proper motion appears to be a poor discriminator for stars with , probably because the mean cluster peculiar tangential velocity is very small (about 1.5 km s-1 with respect to the field average) and the fraction of contaminating background stars increases rapidly at fainter magnitudes. In some cases it is possible to rule out cluster membership on the basis of a large proper motion. Photometry can be used to select stars close to the ZAMS in colour-magnitude and/or colour-colour diagrams. Photoelectric UBV photometry for 161 stars with was presented by Hiltner, Iriarte & Johnson (1958). This survey seems (by comparison with Sanders’ work) complete to but severely incomplete at fainter magnitudes. This work was extended by Jeffries (1997) using BVI CCD photometry that was nearly complete to . Radial velocities were determined to km s-1, for candidate cluster members with , resulting in a refined list of 21 F to early K-type cluster members which shared a common radial velocity. Several likely short-period cluster binaries were identified on the basis of high proper motion membership probabilities but variable radial velocities.
Lithium is destroyed in cool star interiors as a consequence of encounters with protons at K. Convection and perhaps other mixing processes bring Li-depleted material to the surface, where the photospheric abundance can be measured using the Li I 6708Å resonance doublet. The Li depletion pattern in NGC 6633 shows both similarities and differences to that in Hyades stars of equivalent temperature (Jeffries 1997). Depletion among the F stars was small and indistinguishable from the Hyades, though there was an absence of evidence for the “Boesgaard gap” of severely Li-depleted Hyades mid F stars – a phenomenon thought to be driven by non-convective mixing processes (e.g. Boesgaard & Tripicco 1986; Boesgaard & Budge 1988). The G and early K-stars show tentative evidence for less Li depletion than the Hyades. This is expected from standard models that incorporate only convective mixing. Pre main sequence (PMS) Li depletion among stars with ultimate ZAMS temperatures of K should be strongly composition dependent – lower metallicity stars have cooler convection zone bases and burn Li less efficiently for the same photospheric temperature. However, the same standard models cannot also explain why the G and K stars of NGC 6633 have depleted much more Li than their counterparts in the younger Pleiades, because little depletion is predicted on the main sequence. There is accumulating evidence that age, rather than composition is the primary determinant of the Li depletion suffered by a star of a given mass, pointing to roles for both additional mixing and perhaps a mechanism that inhibits strong PMS Li depletion amongst metal-rich stars (Jeffries & James 1999; Jeffries 2000; Ford et al. 2001; Barrado y Navascués, Deliyannis & Stauffer 2001).
The status of NGC 6633 in testing these ideas is hampered both by small number statistics and uncertainty in the cluster metallicity compared with the better studied Hyades and Pleiades. The purpose of this paper is to extend the study of Jeffries (1997) and define a larger sample of solar-type members of NGC 6633. This enlarged sample can then be used to study X-ray activity (see Briggs et al. 2001; Harmer et al. 2001), to continue the investigation of lithium depletion among the low-mass stars of NGC 6633 and to provide the first precise spectroscopic estimate of the cluster iron abundance.
In Section 2 we describe the photometric catalogue from which spectroscopic targets were selected. In Section 3 we discuss the spectroscopic observations and their analysis, including measurement of radial and rotational velocities. Section 4 presents these results and combines them with those from Jeffries (1997). A revised membership list is constructed, we discuss the status of some individually peculiar stars and estimate to what extent our sample is complete or contaminated with non-members. Section 5 presents new estimates, both spectroscopic and photometric, of the metallicity of NGC 6633 in comparison with the Hyades and Pleiades. In Section 6 we determine the Li abundances of our cluster candidates and compare the Li depletion pattern of NGC 6633 with other clusters and theoretical models. The results are discussed in Section 7 and our conclusions presented in Section 8.
2 The photometric catalogue
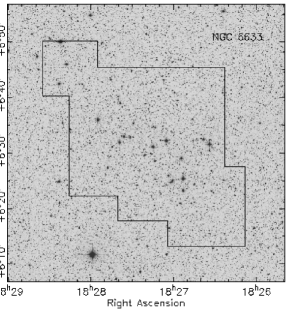
The photometry from which we select cluster candidates is taken from the survey described in Jeffries (1997) and Harmer et al. (2001). In brief, this consists of 42 overlapping arcmin fields, for which exposures were taken with a set of Harris filters and a Tektronix CCD at the f/15 Cassegrain focus of the Jacobus Kapetyn 1-m telescope, at the Observatorio del Roque de los Muchachos. The data were taken between 1 June 1995 and 8 June 1995, and consisted of a series of short (20-s, 10-s, 10-s) and long (250-s, 100-s, 100-s) exposures in B, V and respectively. At least 30 photometric standard stars from Landolt (1992) were observed every night. Aperture photometry of these gave magnitudes on the Johnson , Cousins systems, with rms differences from the Landolt values of less than 0.02 mag. The mean external uncertainty in tying our photometry to the system is about 0.005 mag in V, B-V and for the stars targeted for spectroscopy in this paper, but is larger for cooler stars. The survey area considered in this paper is larger than that described by Jeffries (1997), where only a subset of 30 of the 42 fields were used. The survey area is illustrated in Fig. 1.
To select targets for our spectroscopy, we performed aperture photometry on all the bright (approximately ) stars, averaging the results where stars are present in more than one field. The signal-to-noise ratio of these measurements exceeds 100 in all cases. Subsequent to this we used the optimal photometry package and algorithms for generating open cluster colour-magnitude diagrams described by Naylor (1998) and Naylor et al. (2002), to perform an automated photometric analysis of all the fields down to an approximate signal-to-noise ratio of 10 at . Saturation in the short exposure limits our photometry to . For consistency with the analysis presented in Jeffries (1997) and Harmer et al. (2001), we quote the aperture photometry measurements here, although the agreement with the automated reduction is very good in the vast majority of cases. Comparison of the magnitudes for stars observed twice or more in overlapping fields gives an estimate of mag for our internal photometry uncertainties in V, B-V and V-Ic, for .
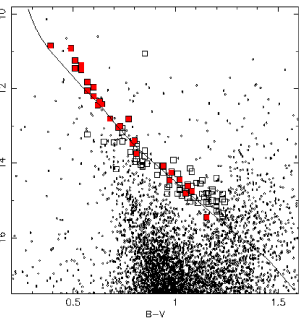
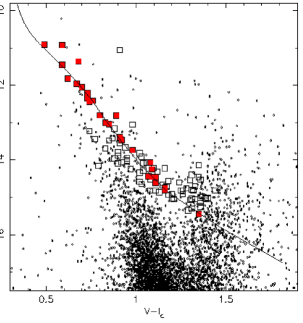
The colour-magnitude diagrams (CMDs) are shown in Figs. 2 and 3. We have indicated those stars which were chosen for spectroscopy, both in this paper and in Jeffries (1997). We have added fiducial main sequences at the distance of NGC 6633, although we defer a discussion of how these were generated until Section 5.4. Spectroscopic targets were chosen to be close to the main sequence in the V versus B-V CMD and a V-Ic versus B-V diagram. In this context, close means about in V and in V-Ic. We did not apply these criteria rigorously and in any case, our photometric reduction has changed slightly since the preliminary analysis used for target selection. Therefore, the boundaries of our selection regions in the colour-magnitude diagram are ragged at the level of a few hundredths of a magnitude and also include some targets, which with hindsight, are clearly discrepant from the cluster main sequence. The one target (J104) which lies more than a magnitude above the main sequence is discussed further in Section 4. As a last selection we also discarded a number of candidate photometric members which were listed as having zero proper motion membership probability by Sanders (1973), although some others were observed as a sanity check on our other selection criteria (i.e. we do not expect any of these to satisfy both photometric and radial velocity membership criteria). Note that our selection criteria were biased against the discovery of binaries with mass ratios greater than around 0.9, as these would lie more than 0.5 mag above the main sequence.
3 Spectroscopy
| (1) | (2) | (3) | (4) | (5) | (6) | (7) | (8) | (9) | (10) |
| Ident | RA | DEC | JD | V | B-V | V-Ic | PM | RV | |
| J2000.0 | 2450990 | ( km s-1) | |||||||
| J57 | 18 26 25.0 | +6 15 34 | 2.560 | 14.80 | 1.16 | 1.32 | – | ||
| J58 | 18 26 56.4 | +6 13 45 | 2.482 | 15.03 | 1.07 | 1.20 | – | ||
| J59 | 18 26 48.3 | +6 15 07 | 2.509 | 14.76 | 1.18 | 1.28 | – | ||
| J60 | 18 26 25.6 | +6 18 05 | 2.535 | 14.86 | 1.03 | 1.13 | – | ||
| J61 | 18 26 34.8 | +6 15 01 | 2.592 | 14.83 | 1.16 | 1.26 | – | ||
| J62 | 18 26 37.0 | +6 14 33 | 2.613 | 15.15 | 1.20 | 1.36 | – | ||
| J63 | 18 26 18.4 | +6 15 50 | 2.457 | 13.82 | 0.85 | 1.02 | 32 | ||
| J64 | 18 26 09.2 | +6 18 13 | 2.646 | 15.07 | 1.11 | 1.30 | – | ||
| J65 | 18 26 15.0 | +6 22 19 | 2.434 | 11.82 | 0.57 | 0.62 | 93 | ||
| 5.699 | |||||||||
| J66 | 18 26 14.1 | +6 19 34 | 2.667 | 14.61 | 1.06 | 1.11 | – | ||
| 5.465 | |||||||||
| 6.568 | |||||||||
| J67 | 18 26 12.7 | +6 22 24 | 2.686 | 13.66 | 0.85 | 0.94 | 33 | ||
| J68 | 18 27 59.0 | +6 23 35 | 2.467 | 13.42 | 0.65 | 0.87 | 74 | ||
| J69 | 18 27 45.5 | +6 29 24 | 2.442 | 10.84 | 0.39 | – | 69 | ||
| 6.710 | |||||||||
| J70 | 18 27 32.3 | +6 33 09 | 2.448 | 12.05 | 0.57 | 0.70 | 69 | ||
| 4.712 | |||||||||
| J71 | 18 26 59.9 | +6 33 07 | 3.679 | 14.22 | 1.08 | 1.16 | – | ||
| 4.533 | |||||||||
| J72 | 18 28 01.5 | +6 42 31 | 3.649 | 13.95 | 0.84 | 0.95 | 30 | ||
| J73 | 18 27 01.6 | +6 26 14 | 3.513 | 14.92 | 1.09 | 1.20 | |||
| J74 | 18 28 15.2 | +6 38 47 | 3.713 | 11.49 | 0.54 | – | 1 | ||
| 6.678 | |||||||||
| J75 | 18 28 32.5 | +6 44 25 | 3.702 | 13.69 | 0.78 | 0.83 | – | ||
| J76 | 18 28 09.9 | +6 46 55 | 3.464 | 13.41 | 0.74 | 0.91 | – | ||
| J77 | 18 28 33.0 | +6 49 17 | 3.441 | 11.95 | 0.60 | 0.67 | – | ||
| J78 | 18 28 33.1 | +6 45 56 | 3.452 | 13.05 | 0.74 | 0.98 | – | ||
| J79 | 18 27 34.1 | +6 26 25 | 3.500 | 15.04 | 1.24 | 1.39 | – | ||
| J80 | 18 27 30.7 | +6 25 26 | 3.485 | 15.09 | 1.16 | 1.36 | – | ||
| J81 | 18 26 18.8 | +6 25 34 | 3.528 | 14.82 | 1.05 | 1.25 | – | ||
| J82 | 18 26 08.4 | +6 24 13 | 3.565 | 15.45 | 1.15 | 1.35 | – | ||
| 5.542 | |||||||||
| 6.477 | |||||||||
| J83 | 18 26 55.5 | +6 30 43 | 3.549 | 14.81 | 1.05 | 1.16 | – | ||
| 5.534 | |||||||||
| 6.510 | |||||||||
| J84 | 18 26 50.0 | +6 31 08 | 3.585 | 15.05 | 1.16 | 1.21 | – | ||
| J85 | 18 27 02.1 | +6 29 59 | 3.599 | 15.30 | 1.21 | 1.31 | – | ||
| J86 | 18 27 00.6 | +6 27 56 | 3.617 | 15.35 | 1.23 | 1.29 | – | ||
| J87 | 18 27 15.9 | +6 31 28 | 3.635 | 14.46 | 1.13 | 1.35 | – | ||
| J88 | 18 27 05.3 | +6 27 56 | 3.665 | 14.54 | 1.12 | 1.30 | – | ||
| 4.587 | |||||||||
| J89 | 18 28 16.7 | +6 42 16 | 4.685 | 14.24 | 0.94 | 0.97 | – | ||
| J90 | 18 28 13.3 | +6 41 05 | 4.667 | 15.05 | 1.20 | 1.33 | – | ||
| J91 | 18 27 57.7 | +6 42 48 | 4.698 | 14.64 | 0.96 | 1.03 | – | ||
| J92 | 18 27 57.3 | +6 46 50 | 4.626 | 13.04 | 0.72 | 0.85 | 25 | ||
| 5.579 | |||||||||
| J93 | 18 27 58.4 | +6 47 00 | 4.635 | 14.70 | 1.02 | 1.17 | – | ||
| J94 | 18 27 20.9 | +6 35 22 | 4.651 | 14.82 | 0.96 | 1.08 | – | ||
| J95 | 18 27 32.1 | +6 42 01 | 5.681 | 15.26 | 1.20 | 1.36 | – | ||
| J46 | 18 26 52.4 | +6 43 00 | 5.664 | 14.75 | 1.08 | 1.16 | – | ||
| J96 | 18 28 03.1 | +6 23 10 | 5.635 | 14.80 | 1.15 | 1.31 | – | ||
| J97 | 18 28 15.9 | +6 26 36 | 5.650 | 15.00 | 1.18 | 1.36 | – | ||
| J98 | 18 28 10.2 | +6 23 33 | 5.512 | 14.56 | 1.06 | 1.18 | – | ||
| J99 | 18 28 16.9 | +6 28 24 | 5.610 | 14.07 | 0.91 | 1.06 | – | ||
| (1) | (2) | (3) | (4) | (5) | (6) | (7) | (8) | (9) | (10) |
| Ident | RA | DEC | JD | V | B-V | V-Ic | PM | RV | |
| J2000.0 | 2450990 | ( km s-1) | |||||||
| J100 | 18 27 42.5 | +6 43 42 | 6.467 | 13.54 | 0.81 | 0.91 | 0 | ||
| J101 | 18 27 25.5 | +6 44 40 | 6.458 | 13.16 | 0.74 | 0.88 | 3 | ||
| 6.633 | |||||||||
| J102 | 18 28 34.0 | +6 48 09 | 6.474 | 14.52 | 1.10 | 1.36 | – | ||
| J103 | 18 27 42.4 | +6 25 36 | 6.445 | 14.07 | 0.94 | 1.08 | – | ||
| 6.604 | |||||||||
| J12 | 18 27 49.9 | +6 25 26 | 6.538 | 13.44 | 0.70 | 0.77 | 86 | ||
| J7 | 18 26 47.2 | +6 25 38 | 6.531 | 13.80 | 0.82 | 0.90 | 74 | ||
| J104 | 18 26 31.0 | +6 22 50 | 6.432 | 11.05 | 0.85 | 0.91 | 0 | ||
| J37 | 18 26 32.3 | +6 23 09 | 6.426 | 10.91 | 0.49 | 0.49 | 72 | ||

3.1 Observations and data reduction
Spectroscopy of 48 new candidate NGC 6633 members, plus 4 targets that were previously observed by Jeffries (1997) (see below), was performed at the 2.5-m Isaac Newton Telescope on the nights of 27 July 1998 to 1 August 1998 inclusive. The instrumental setup, spectrograph, grating and CCD camera were as described by Jeffries (1997). We obtained spectra with a dispersion of 0.23Å per pixel in the spectral range –Å. A 1 arcsec slit gave a resolution of 0.5Å, marginally poorer than in Jeffries (1997), possibly attributable to the camera focus. Each target exposure was accompanied by a thorium-argon lamp exposure for accurate wavelength calibration.
Initial data reduction was performed at the telescope and included bias subtraction and flat-field correction using tungsten lamp spectra. After sky subtraction, the spectra were wavelength calibrated and a correction for telluric lines was made to first order by dividing by a scaled, high signal-to-noise spectrum of a rapidly rotating B-star.
3.2 Radial and rotational velocities
The observing strategy was to obtain a short exposure (600–1200 s) of each target, reduce the data at the telescope and get a radial velocity by cross-correlation with radial velocity standards (see below). Those targets which seemed likely radial velocity members of the cluster were re-observed, either on the same or subsequent nights to obtain further velocity measurements and boost the total signal-to-noise ratio. We also re-observed two objects (J7 and J12) that were identified as possible short-period binaries (those with high proper motion probabilities but discrepant radial velocities) by Jeffries (1997) along with the peculiar high Li abundance object J37. We also (mistakenly!) re-observed J46, identified as a cluster member in Jeffries (1997). We aimed to get signal-to-noise ratios of per pixel in total for these cluster candidates, which required about 5000-s for a 15th-magnitude star. Spectra of our new candidate members (defined in Section 4) are shown in Fig. 4.
Detailed analysis to yield more precise rotational and radial velocities proceeded as described in Jeffries (1997), using observations of the same radial velocity standards – HD 114762 (F7V), HD 112299 (F8V) and HD 213014 (G8V). Cross-correlations were performed between 6610–6750Å and then heliocentric corrections applied to the measured velocity lags. The heliocentric radial velocities are given in Table 1, where the quoted results refer to cross-correlation with the standard that gave the highest cross-correlation peak. The internal errors are dominated by small shifts in the wavelength calibration during exposures. Cross-correlations of arc spectra demonstrate that this uncertainty is about km s-1. Additional uncertainties were introduced by finite signal-to-noise ratios and rotational broadening. These were estimated by simulation (using noisy, broadened radial velocity standards) and then added in quadrature. Where a star demonstrated a significant rotational broadening (see below), appropriately broadened standard stars were used as cross-correlation templates.
From multiple observations of the standard stars and comparing them with observations of other IAU radial velocity standards, we were able to put our radial velocities onto a common system with an estimated external error of about 1 km s-1. This was checked by cross-correlating standard stars observed for this paper with the same objects observed by Jeffries (1997). We found average shifts of km s-1 for the standard stars common to both sets of observations. We shifted the radial velocities in this paper to lie on the radial velocity system defined in Jeffries (1997). This allows us to legitimately compare the radial velocities quoted here with those in Jeffries (1997), with only the internal errors to consider. None of our velocities have been corrected for gravitational redshift.
Projected equatorial velocities () were derived from the widths of the cross-correlation peaks. The relationship between and the width of the cross-correlation peak was calibrated by broadening and then adding Gaussian noise to spectra of the radial velocity standards and twilight sky that were taken during the same observing night. We matched the spectral types of the targets to those of the standards when choosing which standard should be used for a measurement. Practically it proved impossible to resolve any rotation below 15 km s-1. At higher speeds the errors are roughly 10-15 percent of the value (again, determined by simulation), although for some of the earlier type stars we found it impossible to get any precise idea of when it exceeded 50 km s-1. We note that precise measurements require stability of the spectrograph focus, at least on timescales commensurate with obtaining spectra of the targets and standards. We kept the spectrograph slit at the same width during our entire run and did not see any significant change in the focus (from the widths of arc lines).
3.3 Equivalent width measurements
We estimated the equivalent widths (EWs) of the Li I 6708Å resonance line in our spectra as well as the EWs of 14 neutral iron and aluminium lines between 6600 and 6752Å. The EWs were measured by direct integration below a continuum that was estimated by fitting low-order polynomials to line free regions of the spectra. The rms discrepancy to these fits gives an empirical (and conservative) estimate of the signal-to-noise ratio (S/N) of each spectrum. Where multiple spectra were obtained, we performed measurements on the weighted mean spectrum. The Li I line at 6707.8Å is blended with a weak Fe I line at 6707.4Å. No attempt was made to separate these lines.
There are internal and external errors on the EW measurements, as discussed in Jeffries (1997). The internal errors are statistical in nature. The continua were defined using the same regions for all stars. For our candidate members, where spectra with a S/N of roughly 80-150 were accumulated, the internal errors (incorporating the statistical uncertainty in the continuum fit) are about 4–8 mÅ for the individual lines and 20–40 mÅ for the sum of the metal lines. The errors were estimated on an individual basis for each star, taking into account the S/N and rotational broadening.
External errors may be important in our discussion of the Li I line in this paper and are chiefly due to the continuum definition. We compared sky spectra measured during our run with the Kitt Peak solar atlas (Kurucz, Furenlid & Brault 1984), degraded to our resolution using arc line profiles as a broadening kernel. We found that continua defined using our spectra are positioned about 0.3 percent lower on average than we would define in higher resolution data, presumably due to blanketing by weak lines. As a result, EWs in our target spectra are likely to be under-estimated by a negligible mÅ in a single unresolved line. A small discrepancy was found between measured EWs in our daylight spectrum and those in the broadened atlas. The lines were weaker in our daylight spectrum by about 5 percent. We assume that this difference is due to scattered light in the spectrograph. Scattered light has been subtracted from all our target spectra and standards on the assumption that it makes a constant contribution to the signal in the spatial direction, but this was impossible in the case of the daylight spectrum, which filled the spectrograph dekker.
4 Cluster membership
In this section and in the rest of the paper we merge the results from this paper with those in Jeffries (1997).
4.1 Cluster membership from radial velocities
The positions, Julian dates of observation, results from CCD photometry, proper motion membership probability from Sanders et al. (1973 – where available), our measured projected equatorial velocities () and heliocentrically corrected RVs are presented in Table 1. As discussed in Section 2, our targets were selected to be close to an assumed cluster main sequence in colour-magnitude and colour-colour diagrams. There will still be significant contamination within such a sample, but the majority of this can be excluded by choosing stars which have a radial velocity within a narrow range around the cluster mean.
Our selection criterion is that the weighted mean RV of a star must lie within 2-sigma of a weighted cluster mean, where sigma is the sum in quadrature of the radial velocity error and the expected km s-1 radial velocity dispersion of an open cluster (Rosvick, Mermilliod & Mayor 1992). This criterion is chosen in order to include the vast majority of cluster members, yet not include too many contaminating field stars with similar radial velocities (see Sect. 4.4). The criterion was applied iteratively, adjusting the mean each time until a consistent group of members were chosen and we also included the stars observed in Jeffries (1997).
This radial velocity selection criterion is different to that originally applied by Jeffries (1997), where we simply accepted any star within 5 km s-1 of a mean cluster value of km s-1. This neglects the fact that different targets have different radial velocity uncertainties. The new criterion results in us accepting all but three of the cluster candidates included by Jeffries (1997); namely J18, J24 and J31. Interestingly there was additional evidence based on the metal line EWs (see next subsection) that J18 was not a cluster member. From the sample observed in this paper we find 9 new candidate single cluster members (J65, 66, 70, 74, 77, 82, 83, 92, 103). We have also confirmed the membership status of J37 (discussed in more detail below) and J46. From these targets and those accepted as members from the Jeffries (1997) sample, we obtain a weighted mean cluster heliocentric velocity of from 27 stars. When comparing this result with other determinations an external error of about 1 km s-1 should be allowed. We have also made no adjustment for gravitational redshift.
In addition to these candidate single cluster members we also see objects with significantly varying radial velocities, yet with high proper motion membership probabilities. These are candidate short period binary members of the cluster. J3 and J25 were identified as such objects by Jeffries (1997). It was also suggested that J7 and J12 might be binary members. They had a single radial velocity measurement which was discrepant from the cluster mean and proper motion membership probabilities of 74 and 86 percent respectively. The radial velocities presented here do not support this hypothesis. Both have radial velocities consistent with the values in Jeffries (1997). In this paper we have identified J69 as a single lined spectroscopic binary with a high proper motion membership probability. J68 exhibits a very broad, asymmetric cross-correlation function that may be indicative of a close binary status. It too has a high membership probability from its proper motion, but as we have only one radial velocity measurement it is not included as a candidate. Examining the “single” stars more closely, we also see that J14 and J103 have radial velocities that vary at a greater than 95 percent confidence level. Of course with a sample size of objects, one would expect 1-2 objects to exhibit variability at this level by chance.
| (1) | (2) | (3) | (4) | (5) | (6) | (7) | (8) | (9) | (10) | (11) |
| Identifier | V | B-V | V-Ic | Li I Fe I | Status | Li I | A(Li) | |||
| ( km s-1) | (mÅ) | (mÅ) | (K) | (mÅ) | ||||||
| J1 | 11.24 | 0.51 | – | P | 6806 | 48.1 | ||||
| J2 | 11.45 | 0.51 | 0.59 | S | 6806 | 46.1 | ||||
| J3 | 12.20 | 0.60 | 0.73 | B | 6477 | 99.3 | ||||
| J5 | 14.46 | 0.97 | 1.11 | S | 5276 | 65.9 | ||||
| J8 | 13.39 | 0.80 | 0.91 | S | 5747 | 89.3 | ||||
| J14 | 13.00 | 0.73 | 0.83 | B? | 6003 | 105.7 | ||||
| J15 | 12.80 | 0.68 | 0.80 | S | 6185 | 94.7 | ||||
| J16 | 12.34 | 0.63 | 0.73 | S? | 6368 | 73.7 | ||||
| J17 | 12.81 | 0.77 | 0.89 | P | 5857 | 96.9 | ||||
| J19 | 14.44 | 1.02 | 1.07 | S | 5155 | |||||
| J25 | 11.36 | 0.54 | 0.68 | P,B | 6696 | 35.5 | ||||
| J26 | 12.41 | 0.64 | 0.76 | S | 6331 | 41.5 | ||||
| J27 | 13.47 | 0.79 | 0.92 | S | 5784 | 90.5 | ||||
| J28 | 13.73 | 0.81 | 0.98 | S | 5718 | 50.1 | ||||
| J32 | 14.45 | 0.97 | 1.09 | S | 5276 | 22.9 | ||||
| J34 | 12.44 | 0.62 | 0.74 | S | 6404 | 51.9 | ||||
| J37 | 10.91 | 0.49 | 0.49 | P | 6879 | 193.5 | ||||
| J38 | 14.25 | 0.98 | 1.09 | S | 5252 | 31.7 | ||||
| J46 | 14.75 | 1.08 | 1.16 | S | 5014 | 16.7 | ||||
| J56 | 10.92 | 0.49 | 0.59 | P,S? | 6879 | 23.5 | ||||
| J65 | 11.82 | 0.57 | 0.62 | B? | 6587 | |||||
| J66 | 14.61 | 1.06 | 1.11 | S | 5061 | 14.1 | ||||
| J69 | 10.84 | 0.39 | – | B | – | – | – | |||
| J70 | 12.05 | 0.57 | 0.70 | S | 6587 | |||||
| J74 | 11.49 | 0.54 | – | S | 6696 | 60.5 | ||||
| J77 | 11.95 | 0.60 | 0.67 | S? | 6477 | |||||
| J82 | 15.45 | 1.15 | 1.35 | S | 4850 | |||||
| J83 | 14.81 | 1.05 | 1.16 | S | 5084 | |||||
| J92 | 13.04 | 0.72 | 0.85 | S | 6039 | 21.9 | ||||
| J103 | 14.07 | 0.94 | 1.08 | B? | 5351 | 28.5 |
4.2 Line equivalent widths
In Jeffries (1997) we showed how the summed EW of the 14 metal lines discussed in Section 3.3 could be used as an additional membership constraint and also provide an estimate of the reddening and metallicity of the cluster. The metallicity of NGC 6633 is dealt with in much more detail in Section 5, but here we check that our candidate members have metal line strengths that are consistent with their B-V colours.
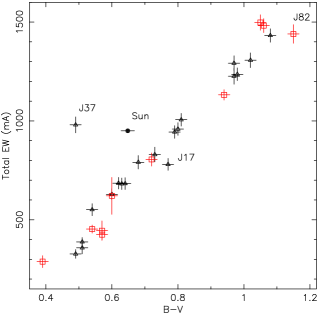
Figure 5 shows the summed metal line EWs (given in Table 2) as a function of B-V. Also shown is a point measured from a broadened version of the Kitt Peak solar atlas, using Gray’s (1995) value of 0.648 for the solar B-V. Most of the new candidate members (both single and binary) are consistent with the quasi-linear relationship defined by the points from Jeffries (1997). The lack of scatter in this relationship limits any possible differential reddening within the cluster to less than about in – although there are firmer constraints than this discussed in Section 5.1. The displacement of the Sun from the mean cluster relationship implies if the cluster has a solar composition, which compares favourably with previous estimates of 0.17 from UBV photometry (Hiltner et al. 1958). The solar point also demonstrates to what extent we would be able to exclude contaminating objects if they had the “wrong” reddening to belong in the cluster.
A number of individual cases deserve comment. J17 and J82 lie a little way beneath the trend, although not very significantly so. The colours of J17 may be unusual. It is identified as a photometric binary in Section 4.3. There is a high probability that J82 is in fact a contaminating non-member (see Section 4.4). J37 is clearly very anomalous. In Jeffries (1997) we suggested that this star might have been mistakenly identified at the telescope and that an object with a redder B-V (that would put it on the mean cluster relation in Fig. 5) lying only 27 arcsec away (not 12 arcsec as mistakenly reported in Jeffries 1997) had instead been observed. We can now confirm that this is not the case. The other star in question is J104 and it is neither a photometric or radial velocity cluster candidate. We have obtained a further spectrum of J37 confirming its very strong metal lines and Li I 6708Å feature. The proper motion, photometry and two radial velocity measurements now support this object’s cluster membership. Furthermore the appearance of its H absorption line (see Fig. 4) confirms it to be a late A or early F-star, reasonably consistent with its de-reddened B-V if it belongs to the cluster. We believe that this star may be the first of its type to show the enhanced Li (and Fe) that is predicted to occur for stars of around 7200 K by the diffusion models of Richer & Michaud (1993) and Turcotte, Richer & Michaud (1998). We discuss the status of this extraordinarily Li-rich star in detail in a separate paper (Deliyannis, Steinhauer & Jeffries 2002).
4.3 Photometric binaries
The V vs B-V and V vs V-Ic colour-magnitude diagrams for our selected members are shown in Figs. 2 and 3. The majority of cluster members form a reasonably tight sequence but there are several objects which are significantly brighter in one or both diagrams. These are probable binary systems. In one case (J25) radial velocity variations are also seen, indicating a short period binary status. For the others a wide binary status is deduced.
Table 2 contains a final status summary for our proposed cluster candidates from this paper and Jeffries (1997). For J37 and J46, where we have made new measurements in this paper, we quote the weighted average with those in Jeffries (1997). In column 8 we classify the candidates using the letters S, P and B. S indicates a target with a constant radial velocity that lies along the single star cluster sequence. P indicates a star which lies above the single star sequence in one or both CMDs by magnitudes and is a probable binary star. B indicates radial velocity variables with photometry and proper motions consistent with cluster membership. Several stars are listed as S? or B? These are either stars on the single star sequence for which we have only one radial velocity measurement or stars which show some, but not conclusive evidence for radial velocity variability. The position of J37 in the V versus B-V CMD would suggest it is a wide binary, but this is not confirmed in the V versus V-Ic CMD. Instead, we suspect that this star appears anomalously red in , because of its high photospheric metallicity and consequent line-blanketing in the B band. The temperature of J37 may therefore be underestimated when using , leading to an underestimate of its Li abundance (see Sect. 6).
4.4 Completeness and contamination
Based on our photometric catalogue, which we estimate is percent complete for stars with , and assuming that the velocity dispersion of single stars in the cluster is unresolved, then we estimate that the radial velocity selected sub-sample is almost ( per cent) complete for single stars with ( in the cluster) over the area covered by our photometry. Although Figs. 2 and 3 might suggest there are many candidates left to observe, they are either anomalous in the B-V versus V-Ic diagram or have proper motion membership probabilities of zero. Hence our final list of cluster members in this colour interval should also be nearly complete apart from the likely exclusion of equal mass binary systems (photometrically excluded) and stars in moderately close binary systems of any mass ratio (radial velocity excluded). For we have certainly not observed all the viable photometric cluster candidates.
Incompleteness is not in itself a great problem for this paper as long as the selected sub-sample is not biased in its iron or lithium abundances. Of more consequence is the likelihood of including cluster non-members as a result of our membership criteria being too loose. Such objects might confuse our interpretation of the Li depletion pattern in NGC 6633. The main culprit here is likely to be the radial velocity selection from photometric candidates.
In Jeffries (1997) and here, we have identified 30 cluster members from a total of 103 candidates (we do not include J104) with radial velocity information. The heliocentric radial velocity distribution for non-members is virtually flat between and km s-1. There are 13 non-members with radial velocities between -60 and -40 km s-1 and 15 non-members with radial velocities between -20 and 0 km s-1. Assuming the density of non-members to be a constant per km s-1 between these ranges, then we would expect (1-sigma) non-members to contaminate the approximate km s-1 range over which the cluster members were selected. However, the colour distribution of radial velocity non-members is heavily weighted towards the redder objects. Indeed we have found only 1 candidate member (J82) from 28 stars observed with . A look at the CMDs suggests that this might partly be caused by selecting objects that lay somewhat above the true cluster locus. Practically, it means that of the expected 4.2 contaminants have , so J82 is very likely to be a non-member. A further 1.5 contaminants would be expected in the range and the remainder would most likely be found with .
We have of course attempted to exclude some of these contaminants by checking the summed metal line EWs versus observed colour. This is effectively checking a (somewhat degenerate) combination of reddening and composition. We found no obvious contaminants, although we had suspicions about J82. The distribution of radial velocity non-members in the same plot would suggest about a 40 per cent chance of rejecting non-members in this manner. This might indicate that the true number of contaminants is smaller than 4.2, but the precision of these statistics is poor. In summary, we must accept the possibility that a few objects might be non-members, but that these are likely to have . To reduce contamination further we need better information. A more accurate radial velocity survey would allow tighter velocity constraints on cluster membership, although because of the likely intrinsic cluster dispersion, this could not be reduced much below km s-1 without rejecting many genuine cluster members. An accurate and deeper proper motion survey may help. Unfortunately the cluster proper motion is small and much of the contamination may be background subgiants and giants which also have small proper motion. Spectroscopy including gravity sensitive features such as the calcium near-infrared triplet would be useful.
5 Reddening, metallicity and distance
The possibility that NGC 6633 has a lower metallicity than the Hyades or Praesepe, yet is at a similar age, was our prime motivation for studying the cluster. Several lines of evidence, point to this being the case – UBV and photometry of cluster members and Fig. 5, which suggests that the cluster cannot have a significantly non-solar metallicity without requiring a reddening that is inconsistent with other determinations.
The data in Jeffries (1997) and here allow us to determine the metallicity in two further ways. The first is to use Fe I lines in our spectra and attempt a spectroscopic iron abundance analysis, differentially with respect to the Sun. The second is to use our refined list of cluster members and constrain the metallicity using their B-V and V-Ic colours (Pinsonneault et al. 1998).
5.1 The cluster reddening
Unlike the Hyades and Pleiades, the reddening is significant in NGC 6633 and uncertainties in it will feed through to errors in our metallicity determinations. The first reddening estimate comes from Hiltner et al. (1958). They used UBV photometry of early-type (A and early F) cluster members to show that . No error was quoted, but Cameron (1985) used the same data to obtain , and to find that [Fe/H], based on the excess of the F-stars. The statistical errors in the reddening are thus small, but Hiltner et al. estimated external calibration errors of and 0.006 in their and B-V indices respectively. This additional uncertainty leads to a combined error estimate of about in and in [Fe/H]. Schmidt (1976) used photometry and obtained , corresponding to . Schmidt also claimed that there was a small change of about 0.03 in the reddening, increasing from west to east.
Combining these high quality studies yields . However, it is well known, although frequently neglected, that the colour excess is dependent on the intrinsic colour of the objects considered. This is discussed in the context of the system by Dean, Warren & Cousins (1978). They find that
| (1) |
where is the intrinsic colour and is the colour excess for a star with . Bessell, Castelli & Plez (1998) have revisited this problem using modern model atmospheres and find an analogous and almost identical relationship. As the above NGC 6633 estimates were obtained predominantly from A stars and our candidate members are F and G stars, this implies an average of about for our targets.
Dean et al. (1978) also provide a relationship between and ,
| (2) |
where is the appropriate ratio for a star with . This ratio turns out to be crucial in estimating the metallicity from the B-V vs V-Ic diagram (see below). Dean et al. estimate to be 1.25 and hence for our targets. can also be determined from the reddening laws provided by Rieke & Lebofsky (1985) and Cardelli, Clayton & Mathis (1989), with results comparable to . depends on both the assumed effective central wavelength of the bandpass (for an A0 stellar atmosphere) and the ratio . Dean et al.’s is equivalent to assuming , which is probably appropriate for a relatively low extinction environment like NGC 6633 (Mathis 1990). Bessell et al. (1998) use model atmospheres and the Cardelli et al. (1989) reddening law and find
which, given the ratio between the intrinsic B-V and V-Ic values of our cluster candidates, is essentially identical to Dean et al.’s result, but with .
In what follows we assume that the average for our targets is , where the error represents a 1-sigma confidence interval. We also adopt as an estimate of the error (in addition to the uncertainty in our photometry) in the intrinsic colour of each star due to any differential reddening across the cluster. We will ignore the change in colour-excess as a function of intrinsic colour over the range spanned by our targets, because it is small compared with the photometry errors. We also allow to be , which means that the of our cluster candidates is .
5.2 A new spectroscopic metallicity estimate
| Star | 6677.99Å | 6703.57Å | 6705.12Å | 6726.67Å | 6750.15Å | 6752.72Å |
|---|---|---|---|---|---|---|
| J8 | 132 | 31 | 37 | 31 | 61 | 58 |
| J14 | 138 | 33 | 40 | 40 | 59 | 31 |
| J15 | 123 | 16 | 34 | 43 | 58 | 47 |
| J16 | 106 | 8 | 27 | 30 | 42 | 16 |
| J26 | 100 | 17 | 26 | 25 | 41 | 18 |
| J27 | 141 | 46 | 54 | 44 | 63 | 37 |
| J34 | 103 | 16 | 33 | 38 | 33 | 25 |
| J65 | 107 | 17 | 41 | 24 | 28 | 31 |
| J74 | 99 | 12 | 28 | 22 | 33 | 14 |
| J92 | 139 | 34 | 33 | 34 | 70 | 32 |
| Sun | 143 | 37 | 49 | 47 | 73 | 40 |
| -1.508 | -3.100 | -1.073 | -1.111 | -2.754 | -1.209 |
| Star | (K) | 6677.99Å | 6703.57Å | 6705.12Å | 6726.67Å | 6750.15Å | 6752.72Å | |
| NGC 6633 | ||||||||
| J8 | 5747 | 7.303 | 7.412 | 7.294 | 7.214 | 7.262 | 7.834 | |
| J14 | 6003 | 7.504 | 7.626 | 7.446 | 7.482 | 7.392 | 7.445 | |
| J15 | 6185 | 7.459 | 7.355 | 7.423 | 7.621 | 7.528 | 7.821 | |
| J16 | 6368 | 7.244 | 7.142 | 7.349 | 7.449 | 7.384 | 7.230 | |
| J26 | 6331 | 7.333 | 7.498 | 7.336 | 7.350 | 7.391 | 7.292 | |
| J27 | 5784 | 7.544 | 7.752 | 7.654 | 7.506 | 7.392 | 7.506 | |
| J34 | 6404 | 7.509 | 7.520 | 7.531 | 7.669 | 7.303 | 7.519 | |
| J65 | 6587 | 7.551 | 7.661 | 7.729 | 7.425 | 7.302 | 7.708 | |
| J74 | 6696 | 7.432 | 7.552 | 7.516 | 7.415 | 7.469 | 7.303 | |
| J92 | 6039 | 7.436 | 7.655 | 7.318 | 7.374 | 7.542 | 7.466 | |
| Weighted Mean [Fe/H]= | ||||||||
| Pleiades | ||||||||
| Hz 470 | 6755 | 7.580 | 7.564 | 7.522 | 7.450 | 7.486 | 7.620 | |
| Hz 948 | 5967 | 7.544 | 7.592 | 7.532 | 7.535 | 7.657 | 7.626 | |
| Hz 1613 | 6220 | 7.549 | 7.481 | 7.596 | 7.564 | 7.406 | 7.510 | |
| Hz 1726 | 6280 | 7.489 | 7.518 | 7.460 | 7.467 | 7.372 | 7.495 | |
| Hz 1739 | 5900 | 7.460 | 7.346 | 7.490 | 7.352 | 7.354 | 7.486 | |
| Hz 1856 | 6150 | 7.345 | 7.660 | 7.647 | 7.568 | 7.327 | 7.617 | |
| Weighted Mean [Fe/H]= | ||||||||
| Hyades | ||||||||
| VB 19 | 6279 | 7.656 | 7.670 | 7.701 | 7.656 | 7.626 | 7.670 | |
| VB 20 | 6673 | 7.621 | 7.620 | 7.681 | 7.841 | 7.826 | 7.671 | |
| VB 59 | 6170 | 7.667 | 7.669 | 7.756 | 7.655 | 7.542 | 7.603 | |
| VB 61 | 6272 | 7.708 | 7.711 | 7.737 | 7.605 | 7.574 | 7.646 | |
| VB 62 | 6191 | 7.596 | 7.700 | 7.718 | 7.523 | 7.697 | 7.633 | |
| VB 65 | 6198 | 7.544 | 7.458 | 7.600 | 7.574 | 7.513 | 7.630 | |
| VB 77 | 6313 | 7.542 | 7.623 | 7.681 | 7.437 | 7.537 | 7.616 | |
| VB 78 | 6484 | 7.690 | 7.673 | 7.728 | 7.622 | 7.715 | 7.665 | |
| Weighted Mean [Fe/H]= | ||||||||
Many of our spectra were of sufficent quality to attempt a spectroscopic iron abundance determination. From the point of view of open cluster studies, the best approach here is to define the abundance relative to other well studied clusters such as the Pleiades and Hyades. To do this we performed a differential iron abundance analysis (with respect to the Sun), using lines for which EWs have been published for a set of Pleiades and Hyades stars. By using these equivalent widths to calculate the iron abundances of the Pleiades and Hyades using our model atmospheres and temperature scales, we can identify any systematic shift in the abundance scale with respect to previously published determinations.
We chose to work with a set of 6 isolated, unblended Fe I lines concentrated around 6700Å (specifically, 6677.49Å, 6703.57Å, 6705.12Å, 6726.67Å, 6750.15Å, 6752.72Å). EWs for these lines in Pleiades and Hyades F dwarfs (and the Sun) are given by Boesgaard & Budge (1988), Boesgaard, Budge & Burck (1988) and Boesgaard, Budge & Ramsay (1988). These data were taken at a higher resolution (Å) and signal-to-noise ratio than our own, and have been used along with data from longer wavelengths to yield the commonly used [Fe/H] values for both the Pleiades and Hyades as well as a number of other open clusters (Boesgaard & Friel 1990; Friel & Boesgaard 1992).
We measured the EWs of our chosen lines in the single cluster candidates with and which were not rapidly rotating. The reasons for restricting the colour range are (a) to ensure that we have comparison stars in the Pleiades and Hyades in the same intrinsic colour range with published EWs; (b) the temperature scale becomes much more uncertain for higher temperatures (see Balachandran 1995). (c) the lines we have chosen become very weak at higher temperatures and so for a given EW error the abundances become much more uncertain. The six lines were also measured in a broadened version of the Kitt Peak Solar Atlas. Our EWs are listed in Table 3 so that others could repeat our analysis with alternative atmospheric models. We then used the Kurucz, 1-D, homogeneous, LTE, atlas 9 model atmospheres, incorporating the mixing length treatment of convection with (Kurucz 1993), to calculate iron abundances. We did this in a differential way with respect to the Sun, assuming solar parameters of K, and a microturbulence of 1.25 km s-1. The values for the lines were tuned to give a solar iron abundance of 7.54 (A(Fe) N(Fe/H) + 12). For the Hyades and Pleiades samples taken from the literature, we repeated this procedure using the solar EWs reported in the same papers. By doing so, we avoid systematic errors associated with the different instrumentation and spectral resolutions. In fact the solar EW values in Table 3 are not systematically discrepant from those reported by Boesgaard & Budge (1988), although they do vary by a few per cent from line to line.
The EWs for our target stars and for the Pleiades and Hyades F stars were then fed into the same models, with determined from B-V via the Saxner & Hammärback (1985) relationship, assuming [Fe/H] for NGC 6633, [Fe/H] for the Pleiades and [Fe/H] for the Hyades, and . In practice these [Fe/H] values were chosen iteratively, to be reasonably consistent with the deduced [Fe/H] for each cluster. The derived [Fe/H] is not highly sensitive to the value used to determine ; a 0.1 dex change in the [Fe/H] used to estimate only leads to a 0.01 dex change in the derived [Fe/H]. We assumed for NGC 6633, for the Pleiades and for the Hyades to obtain intrinsic colours. We allowed the microturbulence to be a fitting parameter, requiring that the derived iron abundance was independent of line EW. We found that in all cases the microturbulence was in the range 1.0 to 2.0 km s-1 with an uncertainty of about 0.25 km s-1. From the six iron abundance estimates for each star, we calculated a weighted mean and standard deviation of the linear ratio, (Fe)/(H). The weights for each line were estimated using the standard deviation of the (linear) abundances about a cluster mean abundance from that line (i.e. the standard deviation of each column in Table 4). This weight takes into account the strength of each line and how precisely it can be measured. It also implicitly incorporates an estimate of by how much each line might be separately affected by uncertainties in temperature and microturbulence for each star.
We then took the logarithm of the mean linear abundance to find the mean A(Fe) for each star. The error in this was formed from the sum (in quadrature) of the (weighted) standard error in the mean (from the six lines) and a contribution from the microturbulence and temperature errors for each star. These latter uncertainties have not been accounted for so far, except that they contribute to the scatter in abundance from each line. However, an error in temperature or microturbulence will systematically change the abundance of that star from all the lines. For simplicity we assumed (relative) temperature uncertainties of K (corresponding to a combination of in our B-V photometry and uncertainty in the reddening of each star – see Section 5.1) and for the microturbulence. Perturbing these parameters in our models we find that this leads to abundance errors, [Fe/H], of about and dex respectively.
Table 4 presents a matrix of temperatures and abundance measurements, together with the final weighted mean [Fe/H] and its error for each star. The final estimate of the cluster metallicity is formed from a weighted mean of each of the individual [Fe/H] values. Because we do see some small systematic variation in the abundances determined from each line, the Hyades and Pleiades samples include only those stars for which we could find measurements of all six lines, and are therefore limited to eight and six objects respectively. We note, importantly, that the reduced chi-squared statistic for a fit to the mean value for each of the clusters is around unity or less (1.21, 0.91 and 0.31 for NGC 6633, the Pleiades and Hyades respectively). This vindicates our estimates of the internal abundance errors for each star (if we assume there is no real star-to-star abundance scatter) in the case of NGC 6633 and the Pleiades, although it would also suggest we have over-estimated those errors in the case of the Hyades (i.e. the estimated uncertainties are larger than the scatter we see). This may be attributable to more accurate photometry in the Hyades and so our precision estimate for the Hyades is probably conservative.
To interpret our results we must be careful to distinguish between the internal and external errors. To put our measurements onto an absolute abundance scale we need to consider errors due to uncertainties in the microturbulence assumed for the Sun, the solar EWs and hence assumed line values, the assumed gravities, the temperature scale and the particular atmospheres used. The contributions to [Fe/H] from the first four factors are estimated as dex (for km s-1 in the solar microturbulence), dex (for over or under-estimates of the solar Fe I EWs by 2 percent), dex (for in ) and dex (for a systematic shift of K in the temperature scale). Additionally for NGC 6633 we must add a contribution of dex to account for in the assumed reddening. Thus our final answer for the absolute [Fe/H] for NGC 6633 (using this set of atmospheric models) is ( internal error and external error). We note that our abundances for the Pleiades and Hyades of [Fe/H] and (internal errors) compare extremely well to the values of [Fe/H]= and [Fe/H]= (internal errors) found by Boesgaard & Friel (1990) using an earlier version of the atlas models. This is not unduly surprising because they used similar gravities and also partially relied on the Saxner & Hammarbäck temperature scale – which is the dominant source of external error.
The size of the abundance error is drastically reduced when strictly comparing NGC 6633 to the Hyades and Pleiades (or other clusters with metallicities derived using the methodology and models of Boesgaard & Friel 1990). In that case, as we have used the same solar microturbulence, gravities, atmospheric models and temperature scales, and as the stars considered occupy a similar temperature range, then the only additional uncertainties come from the reddening of NGC 6633 and the estimates of the solar EWs (recall we used slightly different values for NGC 6633 and the Hyades/Pleiades because they were observed at different resolutions). Thus the logarithmic ratio of iron abundances in NGC 6633 to that in the Pleiades is , and to that in the Hyades is . Our main result is therefore that the spectroscopic [Fe/H] of NGC 6633 determined in a strictly comparable way to the Pleiades and Hyades is significantly (5-sigma) lower than the Hyades, and marginally lower than the Pleiades. It is worth noting that these conclusions are not significantly altered if the sample of 10 stars we have used for the metallicity determination in NGC 6633 contains the odd non-member. The discussion in Section 4.4 reveals that this is quite unlikely among these hotter stars of our sample in any case.
5.3 A new photometric metallicity estimate

Our second attempt to find the metallicity of NGC 6633 uses the metallicity-dependent empirical ZAMS loci derived by Pinsonneault et al. (1998) for the V vs B-V and V vs CMDs. A B-V vs plot is metallicity sensitive because B-V is more affected by line blanketing than the V-Ic index. The ZAMS loci are calibrated on the Hyades and Pleiades and are consistent with the [Fe/H] values of and derived for these clusters by Boesgaard & Friel (1990). Assuming that a 0.1 dex increase in [Fe/H] produces a decrease in MV of 0.13 magnitudes at fixed B-V and 0.06 magnitudes at fixed (Alonso, Arribas & Martinez-Roger 1996), the empirical loci yield a relationship between intrinsic B-V and of
| (3) | |||||
which is valid for intrinsic between about 0.5 and 0.9. We selected 13 of our targets which lie within this range and which were not radial velocity variables or photometric binaries. These stars were de-reddened using equations 1 and 2, using and calculated from equation 2, using and an average . After obtaining the intrinsic colours we performed a chi-squared fit using equation 3 as a model. The errors in both B-V and V-Ic were used and we added an additional 0.01 error in quadrature to account for the small amount of differential reddening discussed in Section 5.1.
We find that the parameters are highly degenerate. That is, one cannot fit all three parameters ([Fe/H], and ) simultaneously. Fortunately we believe that is limited to (1-sigma) and . With these constraints we obtain [Fe/H] (1-sigma) with a reduced chi-squared of 1.12 – see Fig. 6. The error is due almost equally to the statistical errors () and the range of we have allowed (). The error due to the small uncertainty in the reddening is negligible in this case (). The higher values of metallicity are favoured by larger and hence larger values of .
5.4 The cluster distance
Having established the reddening of the cluster and its metallicity, we are in a position to estimate the cluster distance via main sequence fitting. We generated model main sequences for NGC 6633 using the theoretical calculations of Siess, Dufour & Forestini (2000), assuming a cluster age of 600 Myr. Our approach was to transform the bolometric luminosities and effective temperatures from these models in to the observational plane using the Pleiades cluster as an empirical template. Therefore our distances are strictly relative to an assumed distance for the Pleiades. The transformation procedure is described in some detail by Jeffries, Thurston & Hambly (2001), and involves fitting the models to the Pleiades at an assumed age and distance, thus defining the relationship between effective temperature and colour. This relationship can then be used to transform any other isochrone into the observational CMD.
We assume an age of 120 Myr, an intrinsic distance modulus of 5.36 and , for the Pleiades (Stauffer, Schultz & Kirkpatrick 1998; Robichon et al. 1999). A 600 Myr, solar metallicity isochrone from Siess et al. (2000) was then transformed into the V, B-V and V, V-Ic CMDs, assuming and and that (see Section 5.1). An intrinsic distance modulus of provides a reasonable fit to the single cluster members. These models are the ones illustrated in Figs. 2 and 3.
Clearly there are additional errors to consider. If we alter the Pleiades distance modulus this simply increases or decreases the distance to NGC 6633 by a similar amount. Changing the age of the Pleiades by Myr makes a negligible difference to the colour- calibrations and changing the age of NGC 6633 by Myr also makes no difference because the stars are already settled onto the ZAMS. Altering the reddening values within their error bounds provides only an additional mag. uncertainty in the distance modulus. Uncertain metallicity is a source of error. Both the spectroscopic and photometric metallicity estimates have uncertainties of about 0.1 dex. If we were to allow the metallicity to reflect the spectroscopic [Fe/H] of , then this would reduce the distance modulus by 0.06 mag in the V, V-Ic CMD and 0.13 mag from the V, B-V CMD (Alonso et al. 1996).
Adopting the photometric metallicity of , our final distance modulus for NGC 6633, relative to a Pleiades distance modulus of 5.36, is . Our distance modulus estimate is a little high compared with previous estimates of 7.5 to 7.7 (e.g. Cameron 1985, Lynga 1987), but agrees with the crude hipparcos distance modulus estimate of (Robichon et al. 1999).
Finally we note that using the more conventional distance modulus of 5.6 to the Pleiades, which is obtained by fitting the Hyades main sequence to the Pleiades data (e.g. see Pinsonneault et al. 1998), would result in a distance modulus to NGC 6633 as high as . This larger distance would partially remove the discrepancy between the median X-ray luminosities of solar-type stars in NGC 6633 and the Hyades (Harmer et al. 2001).
6 Lithium in NGC 6633
6.1 Calculating Lithium Abundances
The main purpose of our paper is to compare the Li abundances of cool stars in NGC 6633 with those in other clusters such as the Pleiades, Hyades and Coma Berenices. To do this, it is absolutely essential that consistent abundance determination techniques are used for all the stars involved in the comparison, including atmospheric models, deblending techniques and temperature scales (see Balachandran 1995). The comparison data we will use comes from a variety of literature sources for most of which we have only Li I 6708Å equivalent widths available. We are thus forced to use curve of growth techniques for abundance estimations.
The Li i (6707.7Å6707.9Å) doublet is blended with the Fe i 6707.4Å line in lower resolution data. Where the Li doublet and Fe line are resolved we use EWs for the Li doublet alone if quoted. For NGC 6633 the lines are not resolved in our spectra and the EW is the sum of both. For these spectra and other lower resolution data in the literature we adopt a single deblending correction to the integrated LiFe EW. The empirical correction we use is that the EW of the Fe line (plus some even weaker CN features) is given by mÅ (Soderblom et al. 1993b). The total EWs (and errors from the fitting and integration) for NGC 6633 are listed in Table 2 along with the deblended Li doublet EWs. Note that colour errors feed through to a negligible additional error (mÅ) in the empirical deblending formula.
Of course, when dealing with clusters with differing metallicities we might expect the deblending to vary. The Hyades Fe abundance is 1.6 times that of NGC 6633 and we would expect the weak blended Fe line to be 1.6 times as strong as well. Fortunately, all the Hyades data we will consider were taken at high spectral resolutions (e.g. Thorburn et al. 1993), where the lines were resolved. For those clusters where it was not possible to resolve the lines (NGC 6633, Pleiades, Praesepe and some Coma Berenices stars), the metallicities are similar enough to each other that the errors introduced will be small.
Effective temperatures for all stars were derived from colours using the calibration of Saxner & Hammarbäck (1985) for stars with or Böhm-Vitense (1981) otherwise. The Saxner & Hammarbäck relation includes a small metallicity dependent term. For the cooler stars we used the metallicity dependence of the atlas 9 models, amounting to an an additive term of [Fe/H] K (Castelli 1999).
Li abundances (quoted as A(Li) [N(Li)/N(H)]) were conveniently estimated by interpolation of the LTE curves of growth provided by Soderblom et al. (1993b) - which are appropriate for the ZAMS stars considered here. Small (of order 0.05-0.1 dex) NLTE corrections were made to these using the code of Carlsson et al. (1994). A few stars lay well above the 6500 K limit of the published curves of growth. Extrapolation was used as far as 6750 K, but beyond this abundances were estimated using the atmospheric models described in Section 5.2.
The EWs and values adopted for NGC 6633, and their associated errors, are given in Table 2. NLTE Li abundances are also given along with an error that is derived purely by folding the EW and errors through the curves of growth. These errors represent the levels of uncertainty for comparing relative abundances between stars in NGC 6633. When comparing with other clusters we also have to bear in mind any possible systematic uncertainty, largely connected with defining a continuum, in measured EWs for each sample. By comparison with a high resolution spectral atlas we have estimated that this error could be as large as a few mÅ with underestimates of the EW in NGC 6633 most likely because of the relatively low spectral resolution. The effects of this extra error are not too serious. The reader can judge this from the fact that the errors listed in Table 2 already include a contribution from the statistical EW error, which is larger than 5 mÅ in all cases, and also incorporate the effects of an uncertain – which is usually dominant.
For the purposes of comparison with theoretical models it is also important to have an idea of the accuracy of the absolute Li abundances. We expect larger, systematic errors in the absolute Li abundances than the uncertainties listed in Table 2. This is because we must include contributions from uncertain temperature scales, microturbulence and the fact that different atmospheres and convection models will yield slightly different abundances. Changes in the atmospheric assumptions change the abundances in all the clusters systematically with respect to the theoretical models. We have experimented with this by performing a spectral synthesis using the model atmospheres described in Section 5.2, using different convection models (mixing length theory with and without overshoot or full spectrum turbulence), different microturbulence parameters and temperatures differing by K.
The main effect we see is that hotter temperature scales lead to systematically higher Li abundances. The other perturbations are less important. We conclude that for the purposes of comparison with theoretical models, systematic absolute errors in the Li abundance of about 0.1 dex should be added to the relative errors listed in Table 2, but note that the effective temperatures also change so that the individual points tend to simply move along the general A(Li) trend without altering the general shape of the correlation.
Figure 7 shows the trend of NLTE Li abundance versus in NGC 6633. The error bars show the internal errors attributable to EW uncertainties and errors in the photometry/reddening. The error bars are slightly misleading. The majority of the abundance error can be attributed to the error, in the sense that higher leads to higher Li abundance for a given EW. So, the “true” error bar should lie diagonally from top left to bottom right. The three confirmed binary systems have been marked with open symbols.
Our general picture of the mass dependence of Li depletion in NGC 6633 has not been changed by the addition of 10 new points compared with Jeffries (1997), but has been clarified. There seems to be little if any depletion of Li in stars with K, depending on what exact value of the cosmic Li abundance is assumed. Observations of young, PMS objects suggest A(Li)initial is 3.2-3.3 (e.g. Soderblom et al. 1999). Whilst our derived abundances are 0.1-0.3 dex lower than this, a hotter temperature scale than Saxner & Hammärback for stars of this spectral type (as advocated by Balachandran 1995 for instance), could easily erase this difference.
There are now three stars with K with 2-sigma upper limits to their Li abundance which suggest considerable (more than 0.5 dex in two cases and more than 1 dex in another) Li depletion. Although three is not a large sample, it seems that this is the equivalent of the deep dip in Li abundances that has been well documented among the mid F stars of the Hyades and Praesepe.
At lower temperatures there is a gradual decline in Li abundance which seems to follow a relatively uniform trend with a couple of exceptions – J5 and J92. J5, at K, was discussed in some detail by Jeffries (1997). There are no reasons to doubt its membership, although there is a reasonable probability (see Section 4.4) of finding 1-2 contaminants within our sample at colours of . Given that this is the case then suspicion should obviously fall on objects that seem peculiar in any way. However, there is a counter-argument that contaminating field stars at these colours would tend to exhibit small Li I 6708Å EWs and Li abundances. Samples of field stars and older dwarfs in the M67 open cluster show that A(Li) for K in stars as old as 5 Gyr (Favata, Micela & Sciortino 1996; Pasquini, Randich & Pallavicini 1997; Jones et al. 1999). J92 at K appears to have an anomalously small Li abundance, that cannot be explained by the various sources of error in our calculations. With a it is hot enough that the statistics discussed in Section 4.4 make it very unlikely to be a contaminating non-member. Its metallicity, derived in Section 5.2 agrees perfectly with the cluster mean.
We continue to be able to detect traces of Li in our spectra down to K. Two of the five NGC 6633 stars with K have Li detections rather than upper limits, but as we discuss in the next subsection, these detections may be an artefact of our deblending procedure.
6.2 Comparison with other clusters

A difficulty that must be faced when comparing the Li abundances of clusters with different metallicities is whether to compare those abundances at a given temperature, colour or mass? As the conversions from colour to temperature or mass and the deblending of the Li I 6708Å line are metallicity dependent there is no straightforward answer to this. We choose our main comparison to be in the A(Li)- plane, because this is the output that is readily available from theoretical models, although we will also discuss how the metallicity dependence of the colour- conversion affects these comparisons.
In Fig. 7, we compare the A(Li)- distribution of NGC 6633 with that in the Pleiades (age 100 Myr, [Fe/H] ), the Hyades (age Myr, [Fe/H] ), the Coma Berenices cluster (age Myr, [Fe/H] ) and Praesepe (age Myr, [Fe/H] ). The ages quoted here those listed by Lynga (1987), while the metallicities come from Boesgaard & Friel (1990) or Friel & Boesgaard (1992). The age for NGC 6633 from Lynga (1987) is 630 Myr, whilst in Section 5.2, we established that the metallicity is , on a scale that is comparable to the Boesgaard & Friel work.
The NLTE Li abundances for each cluster were calculated in the same manner as for NGC 6633. Li I 6708Å EWs and B-V photometry are taken from Soderblom et al. (1993b) for the Pleiades; Boesgaard & Budge (1988), Thorburn et al. (1993) and Soderblom et al. (1995) for the Hyades; Boesgaard & Budge (1988) and Soderblom et al. (1993a) for Praesepe; and Boesgaard (1987), Jeffries (1999) and Ford et al. (2001) for the Coma Berenices open cluster. For the other clusters we have only included stars where there is no evidence for binarity. Specifically, we have excluded anything (listed in the same sources) as having radial velocity variability. The Li I EWs were deblended from the Fe I line as necessary (for the Pleiades, Praesepe and some of the Coma Ber stars).
These comparisons demonstrate the following features, where we have arbitrarily divided each sample into the F stars ( K) and the G/K stars ( K). A caveat to all the statements below is that we are implicitly assuming that each cluster had a similar initial Li abundance. It is not at all clear that this is the case, especially as the iron abundances appear to vary by 0.2 dex. Any evidence for differences smaller than this should be treated with caution.
-
1.
There is little evidence that the F stars of NGC 6633 are more Li-depleted than those in the younger Pleiades, except in a narrow range centred on 6600 K, where NGC 6633 shows evidence for the “Boesgaard gap” of heavily depleted F stars, but the Pleiades does not.
-
2.
The G/K stars of NGC 6633 are more Li-depleted than their Pleiades counterparts by between 0.5 and more than 2 dex. There is a clear spread in Li abundances in the Pleiades for K. This spread may be present in NGC 6633 also, but the evidence is limited to one star that is less depleted than the rest and there is a possibility that this is a non-member.
-
3.
The level of Li depletion among the F stars of NGC 6633 and the Hyades appears similar. The “Boesgaard gap” is at the same (to within K). The dip could be deeper in the Hyades, but better data in NGC 6633 would be required to test that. However, the G/K stars show more Li depletion in the Hyades. This is quite marginal above 5500 K, but at cooler temperatures we have clear detections of Li up to 1 dex above the upper limits to the undetected Li in the Hyades. We discuss this in some detail below.
-
4.
There is some evidence that the F stars in Coma Berenices are more Li-depleted than their counterparts in NGC 6633 for K, but this is based on few stars. The “Boesgaard gap” appears to coincide in these clusters and there are also a couple of “peculiar” Li-poor F stars in Coma Berenices which seem to be bona fide members (Ford et al. 2001). The pattern of Li depletion among the G/K stars of NGC 6633 and Coma Berenices are indistinguishable, except perhaps at 5100 K. We have a couple of tentative Li detections at this temperature whereas in Coma Berenices there is just one star with a significantly smaller upper limit to its Li abundance.
-
5.
The pattern of Li depletion is also very similar for the F stars in Praesepe and NGC 6633. Once again there is an example of an anomalously depleted F star which appears to be a bona fide cluster member in all other respects. Agreement between the G/K stars in the two clusters is better than between NGC 6633 and the Hyades, but there is some evidence that Praesepe has depleted more Li below 5500 K.


The reality of the differences between these clusters at K needs exploring in more detail. Figure 7 is capable of concealing a number of possible problems in our calculations of Li abundances.
The first of these is the deblending procedure. The reader might be suspicious that given the weakness of the lines in these cooler stars, that uncertainties in the EW of the blended Fe I line might become important. There is also the issue that differences in cluster metallicity should naturally lead to different strengths of the blended line at a given . To counter this argument we show in Fig. 8, the total blended EWs of the Li I Fe I feature as a function of intrinsic colour (i.e. the observational plane). Data are shown for NGC 6633 (assuming ) and for the Hyades, where blended EWs come from the same sources as the deblended Li I EWs. The group of four NGC 6633 stars at appear to have larger blended EWs than the Hyades stars in the same region. This difference is not readily apparent in the cooler NGC 6633 objects.
A complication in the interpretation of Fig. 8 is that the two clusters have metallicities that are quite different. The significantly higher metallicity of the Hyades means that (a) the blended Fe I line should be stronger at the same and (b) that a Hyades star of a given will be hotter by K than one in NGC 6633.
The first of these factors certainly should increase the Li abundance discrepancy between NGC 6633 and the Hyades upon deblending. In Fig. 9 we show spectra of our coolest NGC 6633 stars with compared with spectra for some of the Hyades objects with . These latter spectra were obtained for a different project using an echelle spectrograph at the William Herschel Telescope, at a resolving power of 45 000 and a signal-to-noise ratio of about 200 per 0.04Å pixel. For comparison purposes we smoothed these spectra to approximately match the lower resolution of the spectra considered here. Even a comparison by eye reveals that the Fe I lines in the Hyades stars (at 6703.57Å and 6705.12Å) are stronger than those in the cooler NGC 6633 stars111These iron lines would be expected to become stronger in cooler stars. J82 is a clear exception to this trend. As we commented in Section 4.4 there is a high probability that this star is a non-member.. It is reasonable to suppose that the Fe I line blended into the Li I feature is similarly affected and so a greater proportion of that feature is due to Fe I in the Hyades. We note that the EWs we measure from these smoothed Hyades spectra are in good agreement with Thorburn et al.’s (1993) measurements of the blended EWs, vindicating our choice of continuum level in the NGC 6633 stars, despite the poorer resolution. Quantitatively, Thorburn et al. (1993) present both blended and deblended EWs for cool Hyades stars from their high resolution data. We have subtracted one from the other and fitted the residual (mainly Fe I) EW as a function of B-V, finding mÅ. For stars with the intrinsic colours considered here, this is about 4 mÅ larger than given by the empirical deblending formula we have used for NGC 6633. Consequently the deduced Li I EWs are smaller in the Hyades by a similar amount, which widens the Li abundance discrepancy between NGC 6633 and the Hyades. As the empirical deblending formula we have adopted is probably most suitable for a solar iron abundance, it is even possible that we have underestimated the Li I EWs in NGC 6633 by a few mÅ.
The second factor is less important. The hotter of the Hyades stars at a given B-V pushes them to the left of NGC 6633 in the abundance plot, widening the Li abundance discrepancy between the clusters. However, simultaneously, the deduced Li abundances in the Hyades are increased because of the larger , moving the points upward in the abundance plot. These almost cancel, in the sense that a star moves nearly parallel to the mean trend of Li abundance with seen in all these clusters.
In summary we believe that so long as our relative metallicity determinations in NGC 6633 and the Hyades are secure, then so is the conclusion that there are several cool NGC 6633 objects exhibiting less Li depletion than in the Hyades. We are less confident about the the Li “detections” in J46 and J66 at . These result entirely from the deblending procedure, because their blended EWs are similar to those in Hyades stars of similar colour. Higher spectral resolution observations, capable of resolving the blend, would be useful for all these objects.
7 Discussion
There were two main goals of the present paper. First, to obtain a better estimate of the cluster metallicity and second, to enlarge our sample of cluster members in order to better define its Li depletion pattern.
We have largely succeeded in the first of these goals. Using comparable methods for NGC 6633, the Pleiades and Hyades we have been able to show that [Fe/H] for NGC 6633 is dex lower than in the Hyades, marginally lower than the Pleiades and hence similar to the Coma Berenices open cluster. Our new photometric metallicity is less precise but entirely consistent with this conclusion. Armed with a metallicity value we are now in a position to re-visit the Li abundances in NGC 6633 and discuss them in the light of evolutionary models that predict a strong dependence of Li depletion on metallicity.
7.1 The F-stars ( K)

Standard stellar evolution models, which in this context means those that feature only convective mixing, predict little Li depletion during the PMS phase and none at all once a star has reached the ZAMS (e.g. Pinsonneault 1997). Still smaller differences in depletion should exist for stars with metallicities covering the range exhibited by the clusters discussed in this paper.
The most obvious contradiction to these models is the “Boesgaard gap” of highly depleted F-stars at K in the Hyades, Praesepe, and Coma Ber cluster (but not the Pleiades). The data presented in this paper show that this gap is present in NGC 6633 and at the same to within K. That the “Boesgaard gap” occurs in all these clusters at nearly the same , despite their differing metallicities, must be a strong clue to the processes responsible for particle transport below the convection zone. Candidates include downward microscopic diffusion of Li or slow (non-convective) mixing caused by rotation or gravity waves that brings Li-depleted material to the base of the convection zone.
A useful summary of these mechanisms is presented by Balachandran (1995), who also showed that the ZAMS at the centre of the “Boesgaard gap” was independent of metallicity by considering data from the Hyades, Praesepe and the older M67 and NGC 752. Our data provide further support for this view, because the iron abundance in NGC 6633 is clearly lower than either the Hyades or Praesepe. Balachandran concluded that the most promising explanation for the “Boesgaard gap” was microscopic diffusion. Predictions from models (e.g. Richer & Michaud 1993; Turcotte, Richer & Michaud 1998) produce a “Boesgaard gap” that is too narrow when compared to observations, but which occurs at the correct and has roughly the correct depth. The centre of this model Li dip is quite age dependent but only modestly metallicity dependent. For a cluster like NGC 6633 which may be slightly younger than the Hyades by Myr and has a 0.2 dex lower metallicity, the Richer & Michaud models predict a “Boesgaard gap” centre that is hotter in NGC 6633, but not by more than 100 K. Given the few points we have in NGC 6633 we cannot rule out that such a difference exists. Unfortunately there are unlikely to be many more mid F stars (at least in the area surveyed by us) with which to better define the shape and centre of the gap in NGC 6633.
The excess width of the “Boesgaard gap” compared with the pure diffusion models occurs mainly on the low temperature side. There is accumulating evidence, both observational and theoretical, that depletion amongst young F stars with is caused by turbulent mixing induced by the rapid spindown of these stars as they reach the ZAMS. Deliyannis et al. (1998), Boesgaard et al. (2001) and Boesgaard & King (2002) have found correlated Li and Be depletion in field and Hyades F stars with K. This correlation is well described by the turbulent mixing models (e.g. Chaboyer, Demarque & Pinsonneault 1995; Deliyannis & Pinsonneault 1997; Pinsonneault et al. 1999). The amount of Li depletion predicted by such models is modestly dependent on metallicity. NGC 6633 should have depleted about 0.2 dex less Li than the Hyades. We certainly do not see any evidence for this. The only significant difference is the anomalously Li-depleted star J92 in NGC 6633, which we discuss further below. However, the dominant factor in determining the amount of depletion in these models is the initial stellar angular momentum rather than the metallicity. Initially fast rotating stars lose more angular momentum, since rotation rates converge on timescales of only a few hundred Myr or less. This rapid spindown causes more mixing and Li depletion.
To explain why the late F stars of NGC 6633 and the Hyades have similar abundances in the context of the turbulent mixing models we could hypothesize either: (a) that the clusters had differing initial Li abundances – say A(Li)initial of 3.4 in the Hyades and 3.0 in NGC 6633; or (b) that the initial angular momenta of stars in NGC 6633 were higher than in their Hyades counterparts. Both these suggestions are difficult to rule out with the presently available information.
The rotation rates as a function of in NGC 6633 are compared with the Hyades in Fig. 10. There are no significant differences among the F stars. However, this does not show that the initial angular momenta were not different. Magnetic braking causes convergence of rotation rates with age and this may have erased any major differences between the clusters after a few hundred Myr.
It is worth noting that J92, the F star with anomalously low Li abundance, also rotates faster than most of the stars of similar in NGC 6633 and the Hyades. This possibly points to a role for rotation and turbulent mixing in reducing its Li by more than in the other F stars. We also note that the [Fe/H] derived for this star is consistent with the cluster average, which makes it unlikely that there is any great error in the photometrically derived . J92 joins Tr76 in the Coma Ber cluster (Boesgaard 1987) and KW392 in Praesepe (Soderblom et al. 1993a) as an F star which appears to have depleted its Li by a factor of ten or more in Myr, yet is significantly cooler than stars in the “Boesgaard gap”. Neither Tr76 or KW392 have published rotation velocity measurements, although the appearance of the spectrum of Tr76 in Boesgaard (1987) suggests it does not have a large . Further detailed observations of these unusual objects may prove a productive means of investigating the dominant Li depletion mechanisms in late F stars.
7.2 The G and K-stars ( K)
That we needed to go to some lengths in order to demonstrate that the late-G/early-K stars of NGC 6633 have depleted less Li than their counterparts in the more metal-rich Hyades cluster is notable. From Fig. 7 we can see that the metallicity of such stars should, according to evolutionary models featuring only convective mixing, strongly influence Li depletion. The models presented (from Pinsonneault 1997) are quite representative of others in the literature (e.g. Swenson et al. 1994b; Chaboyer et al. 1995), although some more recent models predict a similar metallicity dependence but much more PMS Li depletion on average for G and K stars (e.g. Ventura et al. 1998; Piau & Turck-Chièze 2002). All of these models concur that very little Li-depletion occurs once the G and K stars (with K) are settled onto the main sequence, because the base of their convection zones is too cool to destroy Li. Figure 7 contradicts this type of model in a number of ways.
The expected metallicity dependence may not be as extreme as the model predictions. The Hyades, Praesepe, Coma Ber and NGC 6633 clusters, which cover a range of dex in [Fe/H], have indistinguishable Li abundance patterns until K. We have been able to show that the Li-depletion in NGC 6633, which has the lowest [Fe/H], has less Li-depletion than the Hyades among its cooler late G and early K stars. Ford et al. (2001) also found that this was the case for Coma Ber, the cluster with the next lowest [Fe/H]. The magnitude of the difference at these temperatures might be compatible with the “standard” models. It is impossible to tell because of the difficulty in measuring the very weak Li I lines and because the Hyades data are upper limits.
The overall amount of Li depletion is greater than the “standard” models presented in Fig. 7. The discrepancy becomes wider at cooler temperatures and is more than an order of magnitude at K. In part this may be a solved problem in some of the more recent calculations, through a combination of improved opacities, nuclear cross-sections, treatment of convection and computational methods (Ventura et al. 1998; Piau & Turck-Chiéze 2002) . Indeed Piau & Turck-Chiéze demonstrate (their Figs. 5 and 6) that their models can match the Hyades and Coma Ber data.
Whichever of these models we choose, we are still left with major difficulties. If the Pinsonneault (1997) models shown in Fig. 7 are used then these predict about the right amount of PMS Li depletion for the Pleiades, but cannot explain how the Pleiades Li depletion pattern evolves into the Coma Ber pattern after 500 Myr. The same argument can be put forward using the Hyades and Blanco 1 Li depletion patterns. Blanco 1 has an [Fe/H] similar to the Hyades but has a similar age and Li depletion pattern to the Pleiades (Jeffries & James 1999). The favoured explanation would then be that additional, non-convective mixing has occurred during the first 500 Myr of main-sequence evolution. However, this cannot be the whole story because the ZAMS clusters Blanco 1 and the Pleiades cannot have yet suffered any main sequence depletion, have very different [Fe/H] and yet both show the same Li depletion pattern. Something must have prevented the expected PMS Li depletion in Blanco 1.
If we choose instead to believe the models which have much larger PMS Li depletion, these problems do not go away. We must still explain how the Li abundances in the younger clusters are depleted during main sequence evolution. Thus, non-standard mixing mechanisms are still required. However, in addition we now have the problem of explaining why PMS Li depletion is inhibited in both the Pleiades and Blanco 1.
We see two general classes of solution to these problems emerging, for one of which at least there is a clear observational test. Swenson et al. (1994a) showed that PMS Li depletion is crucially dependent on interior opacities and these in turn are dependent on the exact mixture of chemical elements present in the star. So far we have used [Fe/H] as a proxy for the overall metallicity of a star, implicitly assuming that the other elements have abundances in accord with solar ratios. There is compelling evidence, based on abundance studies of field stars (e.g. Edvardsson et al. 1993), that the Sun is unusual in some respects – particularly its [O/Fe] which is dex higher than average, while [Al/Fe] and [Mg/Fe] are about 0.1 dex lower than average. Furthermore, it is known that the Hyades for instance has a slightly sub-solar [O/H], despite its super-solar [Fe/H] (Garcia-Lopez et al. 1993). The abundance of oxygen in particular is crucial to predictions of PMS Li depletion. Piau & Turck-Chièze (2002) show that a 0.2 dex smaller [O/Fe] can, on its own, account for 1 dex less PMS Li depletion in a solar-type star. It is therefore possible to explain the observed Li depletion patterns of each of the clusters we have considered, by appropriate tuning of [O/Fe]. In such an approach [O/Fe] for Blanco 1 must be lower than in the Pleiades by 0.1-0.2 dex and [O/Fe] for Coma Ber and NGC 6633 must be much higher than in the Pleiades and also higher than in the Hyades.
These predictions are testable, but in our view unlikely to be correct, simply because the Li depletion patterns of all open clusters studied to date show a clear age dependence, with no exceptions (see Jeffries 2000). Even though many of these clusters have very uncertain [Fe/H], the chances of a cosmic conspiracy to tune [O/Fe] to accomplish such a clear correlation seems remote. It is more likely that additional mixing mechansims caused by rotation, and especially differential rotation driven by angular momentum loss, can result in Li-depletion which progresses even whilst stars are on the main sequence. Appropriate initial angular momentum distributions, braking laws and coefficients controlling the internal redistribution of angular momentum are capable of reproducing the decline of Li with age in solar type stars (Chaboyer et al. 1995; Pinsonneault 1997), with the prediction that those stars spinning faster as they reach the ZAMS will subsequently undergo more rapid Li depletion. As we explained above, additional ingredients are probably required to limit PMS depletion in order to account for the very similar Li abundance patterns seen in clusters with the same age but quite different [Fe/H]. Since the structural effects of rotation are unlikely to be significant for PMS Li depletion (Mendes, D’Antona & Mazzitelli 1999; Piau & Turck-Chièze 2002), attention has focused on the role of magnetic fields in the convection zone (Ventura et al. 1998; D’Antona, Ventura & Mazzitelli 2000). Dynamo-generated magnetic fields are expected in rapidly rotating low-mass stars with convection zones. Their effect is to make a small increase in the temperature gradient required for convective instability, reducing the size of the convection zone and temperature of the convection zone base. This could dramatically reduce the amount of PMS Li depletion expected and effectively compress the expected metallicity dependence of Li depletion into a much smaller dynamic range.
8 Conclusions
We have extended the spectroscopic survey of F–K type photometrically selected NGC 6633 candidates which was begun by Jeffries (1997). By considering the stellar radial velocities and metal line EWs we have found an additional 10 strong cluster candidates, including one new single-lined, short period, spectroscopic binary. Using uniform selection techniques we have added these stars to the data in Jeffries (1997) and arrived at a total of 30 likely cluster members with B-V and spectral types from early F to early K. The mean heliocentric radial velocity of these stars (uncorrected for general relativistic effects) is km s-1.
We have spectroscopically estimated the iron abundance of NGC 6633 using 10 single F and early G-type stars and the atlas 9 atmospheres. We find [Fe/H], where the error includes (and is dominated) by an allowance for systematic errors caused by choice of a colour- error and uncertainties in the cluster reddening. When strict comparison is made with stars from the Pleiades and Hyades which have their [Fe/H] measured in an identical way, we find that [Fe/H]NGC6633 - [Fe/H] and that [Fe/H]NGC6633 - [Fe/H]. A photometric estimate of the metallicity using the versus locus yields [M/H] . Thus NGC 6633 appears to be a metal-poor (or at least iron-poor) version of the Hyades at a similar age. An estimate of the cluster distance is found from the colour-magnitude diagrams of the cluster members by using empirically tuned isochrone fits to the Pleiades ZAMS. We find that NGC 6633 has a distance modulus that is larger than the Pleiades.
We have derived Li abundances using the Li I 6708Å resonance doublet and compared these abundances to those estimated in a consistent fashion for other open clusters. We find that the Li depletion patterns among the F and early G stars of a group of similarly aged clusters (the Hyades, Praesepe, Coma Ber and NGC 6633) are almost identical, despite their differing [Fe/H]. We can confirm the presence of severely Li-depleted F stars at around 6600 K in NGC 6633, in close agreement with the “Boesgaard gap” already identified in the other three clusters.
We have shown that the Li abundance patterns in the late G and early K stars of NGC 6633 and the Hyades are different. There is now firm evidence that Li can still be detected in NGC 6633 stars with K at abundances nearly 1 dex higher than the upper limits found for Hyades stars at the same temperature. This difference is qualitatively in agreement with the expected dependence of PMS Li depletion on metallicity. However, this dependence is not clearly seen at higher temperatures and neither can PMS Li depletion explain why the G/K stars of NGC 6633 have less Li than their counterparts in the Pleiades which have similar or even higher [Fe/H].
We outline two scenarios that might explain these observations. One is that the elemental abundances in these clusters have non-solar ratios, altering the interior opacities and resulting in different amounts of Li depletion than would be predicted in models that assume all elemental abundances scale with iron. This would require [O/Fe] to be higher in NGC 6633 than either the Hyades or Pleiades. Alternatively, we propose that mixing between the convection zone base and regions hot enough to destroy Li is effective. This would be responsible for depleting Li in NGC 6633 from a level similar to, or higher than, that in the Pleiades during the first Myr of main sequence evolution.
Acknowledgements
The support of the Nuffield Foundation for SH during the course of this research is gratefully acknowledged. Computational work was performed on the Keele node of the PPARC funded Starlink network. EJT and SH acknowledge the financial support of the UK Particle Physics and Astronomy Research Council. The Isaac Newton and Jacobus Kapetyn Telescopes are operated on the island of La Palma by the Isaac Newton Group in the Spanish Observatorio del Roque de los Muchachos of the Instituto de Astrofisica de Canarias.
References
- [\citefmtAlonso, Arribas & Martinez-Roger1996] Alonso A., Arribas S., Martinez-Roger C., 1996, A&A, 313, 873
- [\citefmtBalachandran1995] Balachandran S., 1995, ApJ, 446, 203
- [\citefmtBarrado y Navascués, Deliyannis & Stauffer2001] Barrado y Navascués D., Deliyannis C. P., Stauffer J. R., 2001, ApJ, 549, 452
- [\citefmtBessell, Castelli & Plez1998] Bessell M. S., Castelli F., Plez B., 1998, A&A, 333, 231
- [\citefmtBoesgaard & Budge1988] Boesgaard A. M., Budge K. G., 1988, ApJ, 332, 410
- [\citefmtBoesgaard & Friel1990] Boesgaard A. M., Friel E. D., 1990, ApJ, 351, 467
- [\citefmtBoesgaard & King2002] Boesgaard A. M., King J. R., 2002, ApJ, 565, 587
- [\citefmtBoesgaard & Tripicco1986] Boesgaard A. M., Tripicco M. J., 1986, ApJ, 302, L49
- [\citefmtBoesgaard, Budge & Burck1988] Boesgaard A. M., Budge K. G., Burck E. E., 1988, ApJ, 325, 749
- [\citefmtBoesgaard, Budge & Ramsay1988] Boesgaard A. M., Budge K. G., Ramsay M. E., 1988, ApJ, 327, 389
- [\citefmtBoesgaard et al.2002] Boesgaard A. M., Deliyannis C. P., King J. R., Stephens A., 2002, ApJ, 553, 754
- [\citefmtBoesgaard1987] Boesgaard A. M., 1987, ApJ, 321, 967
- [\citefmtBöhm-Vitense1981] Böhm-Vitense E., 1981, ARA&A, 19, 295
- [\citefmtBriggs et al.2000] Briggs K. R., Pye J. P., Jeffries R. D., Totten E. J., 2000, MNRAS, 319, 826
- [\citefmtCameron1985] Cameron L. M., 1985, A&A, 147, 39
- [\citefmtCardelli, Clayton & Mathis1989] Cardelli J. A., Clayton G. C., Mathis J. S., 1989, ApJ, 345, 245
- [\citefmtCarlsson et al.1994] Carlsson M., Rutten R., Bruls J. H. M. J., Shchukina N. G., 1994, A&A, 288, 860
- [\citefmtCastelli1999] Castelli F., 1999, A&A, 346, 564
- [\citefmtChaboyer, Demarque & Pinsonneault1995] Chaboyer B., Demarque P., Pinsonneault M. H., 1995, ApJ, 441, 876
- [\citefmtD’Antona, Ventura & Mazzitelli2000] D’Antona F., Ventura P., Mazzitelli I., 2000, ApJ, 543, L77
- [\citefmtDean, Warren & Cousins1978] Dean J. F., Warren P. R., Cousins A. W. J., 1978, MNRAS, 183, 569
- [\citefmtDeliyannis & Pinsonneault1997] Deliyannis C. P., Pinsonneault M. H., 1997, ApJ, 488, 836
- [\citefmtDeliyannis et al.1998] Deliyannis C. P., Boesgaard A. M., Stephens A., King J. R., Vogt S. S., Keane M. J., 1998, ApJ, 498, L147
- [\citefmtDeliyannis, Steinhauer & Jeffries2002] Deliyannis C. P., Steinhauer A., Jeffries R. D., 2002, ApJ, submitted
- [\citefmtEdvardsson et al.1993] Edvardsson B., Andersen J., Gustafsson B., Lambert D. L., Nissen P. E., Tomkin J., 1993, A&A, 275, 101
- [\citefmtFavata, Micela & Sciortino1996] Favata F., Micela G., Sciortino S., 1996, A&A, 311, 951
- [\citefmtFord et al.2001] Ford A., Jeffries R. D., James D. J., Barnes J. R., 2001, A&A, 369, 871
- [\citefmtFriel & Boesgaard1992] Friel E. D., Boesgaard A. M., 1992, ApJ, 387, 170
- [\citefmtGarcía López et al.1993] García López R. J., Rebolo R., Herrero A., Beckman J. E., 1993, ApJ, 412, 173
- [\citefmtGray1995] Gray D. F., 1995, PASP, 107, 120
- [\citefmtHarmer et al.2001] Harmer S., Jeffries R. D., Totten E. J., Pye J. P., 2001, MNRAS, 324, 473
- [\citefmtHarris1976] Harris G. L. H., 1976, ApJS, 30, 451
- [\citefmtHiltner, Iriarte & Johnson1958] Hiltner W. A., Iriarte B., Johnson H. L., 1958, ApJ, 127, 539
- [\citefmtJanes, Tilley & Lynga1988] Janes K. A., Tilley C., Lynga G., 1988, AJ, 95, 771
- [\citefmtJeffries & James1999] Jeffries R. D., James D. J., 1999, ApJ, 511, 218
- [\citefmtJeffries, Thurston & Hambly2001] Jeffries R. D., Thurston M. R., Hambly N. C., 2001, A&A, 375, 863
- [\citefmtJeffries1997] Jeffries R. D., 1997, MNRAS, 292, 177
- [\citefmtJeffries1999] Jeffries R. D., 1999, MNRAS, 304, 821
- [\citefmtJeffries2000] Jeffries R. D., 2000, in R. Pallavicini G. Micela S. S., ed, Stellar clusters and associations: Convection, rotation and dynamos. ASP Conference Series, Vol. 198, San Francisco, p. 245
- [\citefmtJones, Fischer & Soderblom1999] Jones B. F., Fischer D., Soderblom D. R., 1999, AJ, 117, 330
- [\citefmtKraft1965] Kraft R. P., 1965, ApJ, 142, 681
- [\citefmtKrishnamurthi et al.1997] Krishnamurthi A., Pinsonneault M. H., Barnes S., Sofia S., 1997, ApJ, 480, 303
- [\citefmtKrishnamurthi et al.1998] Krishnamurthi A. et al., 1998, ApJ, 493, 914
- [\citefmtKurucz, Furenlid & Brault1984] Kurucz R. L., Furenlid I., Brault J., 1984, Solar flux atlas from 296 to 1300nm. National Solar Observatory
- [\citefmtKurucz1993] Kurucz R. L., 1993, Technical Report, ATLAS9 Stellar Atmosphere Programs, Smithsonian Astrophysical Observatory, Kurucz CD-ROM No. 13
- [\citefmtLandolt1992] Landolt A., 1992, AJ, 104, 340
- [\citefmtLynga1987] Lynga G., 1987, Technical Report, Catalogue of open cluster data, 5th ed., Lund Observatory
- [\citefmtMathis1990] Mathis J. S., 1990, ARA&A, 28, 37
- [\citefmtMendes, D’Antona & Mazzitelli1999] Mendes L. T. S., D’Antona F., Mazzitelli L., 1999, A&A, 341, 174
- [\citefmtMermilliod1981] Mermilliod J. C., 1981, A&A, 97, 235
- [\citefmtNaylor et al.2002] Naylor T., Totten E. J., Jeffries R. D., Pozzo M., Devey C. R., Thompson S. A., 2002, MNRAS, in press
- [\citefmtNaylor1998] Naylor T., 1998, MNRAS, 296, 339
- [\citefmtPasquini, Randich & Pallavicini1997] Pasquini L., Randich S., Pallavicini R., 1997, A&A, 325, 535
- [\citefmtPiau & Turck-Chièze2002] Piau L., Turck-Chièze S., 2002, ApJ, 566, 419
- [\citefmtPinsonneault et al.1998] Pinsonneault M. H., Stauffer J. R., Soderblom D. R., King J. R., Hanson R. B., 1998, ApJ, 504, 170
- [\citefmtPinsonneault et al.1999] Pinsonneault M. H., Walker T. P., Steigman G., Narayanan V. K., 1999, ApJ, 527, 180
- [\citefmtPinsonneault1997] Pinsonneault M. H., 1997, ARA&A, 35, 557
- [\citefmtRadick et al.1987] Radick R. R., Thompson D. T., Lockwood G. W., Duncan D. K., Baggett W. E., 1987, ApJ, 321, 459
- [\citefmtRandich & Schmitt1995] Randich S., Schmitt J. H. M. M., 1995, A&A, 298, 115
- [\citefmtRicher & Michaud1993] Richer J., Michaud G., 1993, ApJ, 416, 312
- [\citefmtRieke & Lebofsky1985] Rieke G. H., Lebofsky M. J., 1985, ApJ, 288, 618
- [\citefmtRobichon et al.1999] Robichon N., Arenou F., Mermilliod J. C., Turon C., 1999, A&A, 345, 471
- [\citefmtRosvick, Mermilliod & Mayor1992] Rosvick J. M., Mermilliod J. C., Mayor M., 1992, A&A, 255, 130
- [\citefmtSanders1973] Sanders W. L., 1973, A&AS, 9, 213
- [\citefmtSaxner & Hammarbäck1985] Saxner M., Hammarbäck G., 1985, A&A, 151, 372
- [\citefmtSchmidt1976] Schmidt E. G., 1976, PASP, 88, 63
- [\citefmtSiess, Dufour & Forestini2000] Siess L., Dufour E., Forestini M., 2000, A&A, 358, 593
- [\citefmtSoderblom et al.1993a] Soderblom D. R., Fedele S., Jones B. F., Stauffer J. R., Prosser C. F., 1993a, AJ, 106, 1080
- [\citefmtSoderblom et al.1993b] Soderblom D. R., Jones B. F., Balachandran S., Stauffer J. R., Duncan D. K., Fedele S. B., Hudon J. D., 1993b, AJ, 106, 1059
- [\citefmtSoderblom et al.1995] Soderblom D. R., Jones B. F., Stauffer J. R., Chaboyer B., 1995, AJ, 110, 729
- [\citefmtSoderblom et al.1999] Soderblom D. R., King J. R., Siess L., Jones B. F., Fischer D., 1999, AJ, 118, 1301
- [\citefmtStauffer et al.1994] Stauffer J. R., Caillault J. P., Gagné M., Prosser C. F., Hartmann L. W., 1994, ApJS, 91, 625
- [\citefmtStauffer, Schultz & Kirkpatrick1998] Stauffer J. R., Schultz G., Kirkpatrick J. D., 1998, ApJ, 499, L199
- [\citefmtStern et al.1992] Stern R. A., Schmitt J. H. H. M., Rosso C., Pye J. P., Hodgkin S. T., Stauffer J. R., 1992, ApJ, 399, 159
- [\citefmtStern, Schmitt & Kahabka1995] Stern R. A., Schmitt J. H. M. M., Kahabka P. T., 1995, ApJ, 448, 683
- [\citefmtStrobel1991] Strobel A., 1991, A&A, 247, 35
- [\citefmtSwenson et al.1994a] Swenson F. J., Faulkner J., Iglesias C. A., Rogers F. J., Alexander D. R., 1994a, ApJ, 422, L79
- [\citefmtSwenson et al.1994b] Swenson F. J., Faulkner J., Rogers F. J., Iglesias C. A., 1994b, ApJ, 425, 286
- [\citefmtThorburn et al.1993] Thorburn J. A., Hobbs L. M., Deliyannis C. P., Pinsonneault M. H., 1993, ApJ, 415, 150
- [\citefmtTurcotte, Richer & Michaud1998] Turcotte S., Richer J., Michaud G., 1998, ApJ, 504, 559
- [\citefmtVentura et al.1998] Ventura P., Zeppieri A., Mazzitelli I., D’Antona F., 1998, A&A, 331, 1011