THE COSMIC FOAM:
STOCHASTIC GEOMETRY AND SPATIAL CLUSTERING
ACROSS THE UNIVERSE
Galaxy redshift surveys have uncovered the existence of
a salient and pervasive foamlike pattern in the distribution of
galaxies on scales of a few up to more than a hundred Megaparsec. The
significance of this frothy morphology of cosmic structure has been underlined
by the results of computer simulations. These suggest the observed
cellular patterns to be a prominent and natural aspect of cosmic structure
formation for a large variety of scenarios within the context of the
gravitational instability theory of cosmic structure formation.
We stress the importance of stochastic geometry as a branch of mathematical
statistics particularly suited to model and investigate nontrivial
spatial patterns. One of its key concepts, Voronoi tessellations, represents
a versatile and flexible mathematical model for foamlike patterns. Based on a
seemingly simple definition, Voronoi tessellations define a wealthy stochastic
network of interconnected anisotropic components, each of which can be identified
with the various structural elements of the cosmic galaxy distribution. The
usefulness of Voronoi tessellations is underlined by the fact that they appear
to represent a natural asymptotic situation for a range of gravitational instability
scenarios of structure formation in which void-like regions are prominent.
Here we describe results of an ongoing thorough investigation of
a variety of aspects of cosmologically relevant spatial distributions and statistics
within the framework of Voronoi tessellations. Particularly enticing is the recent finding
of a profound scaling of both clustering strength and clustering extent for the
distribution of tessellation nodes, suggestive for the clustering properties
of galaxy clusters. This is strongly suggestive of a hitherto
unexpected fundamental and profound property of foamlike geometries. In a
sense, cellular networks may be the source of an intrinsic
“geometrically biased” clustering.
1 Introduction
Macroscopic patterns in nature are often due the
collective action of basic, often even simple, physical processes.
These may yield a surprising array of complex and genuinely unique physical
manifestations. The macroscopic organization into complex spatial patterns is
one of the most striking. The rich morphology of such systems and patterns
represents a major source of information on the underlying physics. This has
made them the subject of a major and promising area of inquiry. However, most such
studies still reside in a relatively youthful state of development, hampered by
the fact that appropriate mathematical machinery for investigating and solidly
characterizing the geometrical intricacies of the observed morphologies is not
yet firmly in place.
In an astronomical context one of the most salient geometrically complex
patterns is that of the foamlike distribution of galaxies, revealed by
a variety of systematic and extensive galaxy redshift surveys. Over the
two past decades, these galaxy mapping efforts have gradually established the
frothy morphology as a universal aspect of the spatial organization of matter
in the Univers. Comprising features on a typical scale of tens of Megaparsec, it
offers a direct link to the matter distribution in the primordial Universe.
The cosmic web is therefore bound to contain a wealth of information on the cosmic
structure formation process. It will therefore represent a key to unravelling one of
the most pressing enigmas in modern astrophysics, the rise of the wealth and variety of
structure in the present-day Universe from a almost perfectly smooth, virtually
featureless, pristine cosmos.
However, a lack of straightforward quantitative measures of such patterns has yet prevented a proper interpretation, or indeed identification, of all relevant pieces of information. Quantitative analysis of matter distribution has been largely restricted to first order galaxy clustering measures, useful in evaluating gross statistical properties of the matter distribution but inept for characterizing the intricate foamlike morphologies observed on Megaparsec scales.
Here we will address the meaning and interpretation of the cellular morphology
of the cosmic matter distribution. Prominent as it is, its assessment rarely exceeds
mere qualitative terminology, seriously impeding the potential exploitation of
its content of significant information. One of the most serious omissions concerns
a proper appreciation and understanding of the physical and statistical repercussions of
the nontrivial cellular geometry. This propelled us to focus on this important aspect, for
which we were impelled to invoke ideas and concepts from the relevant field of
mathematics, stochastic geometry. Particularly fruitful has been our application and
investigation of Voronoi tessellations, a central concept in this mathematical branch
addressing the systematics of geometrical entities in a stochastic setting. The
phenomological similarity of Voronoi foams to the cellular morphology seen in the
galaxy distribution justifies further exploration of its virtues as a model
for cosmic structure. In the following we will indicate that such similarity
is a consequence of the tendency of gravity to shape and evolve structure emerging
from a random distribution of tiny density deviations into a network of anisotropically
contracting features. Its application gets solidly underpinned by a thorough
assessment of the implications for spatial clustering, vindicating the close
resemblance of Voronoi foams to the frothy patterns in the observed reality.
It is within the context of testing its spatial statistical properties that
unexpected profound ‘scaling’ symmetries were uncovered, shedding new light
on the issue of “biased” spatial clustering.
2 Patterns in the Galaxy Distribution: the Cosmic Foam.
One of the most striking examples of a physical system displaying a salient geometrical morphology, and the largest in terms of sheer size, is the Universe as a whole. The past few decades have revealed that on scales of a few up to more than a hundred Megaparsec, galaxies conglomerate into intriguing cellular or foamlike patterns that pervade throughout the observable cosmos. A dramatic illustration is the map of the 2dF Galaxy Redshift Survey and the newest results of the SDSS survey (see contribution M. Strauss). The recently published map of the distribution of more than 150,000 galaxies in a narrow region on the sky yielded by the 2dF – two-degree field – redshift survey. Instead of a homogenous distribution, we recognize a sponge-like arrangement, with galaxies aggregating in filaments, walls and nodes on the periphery of giant voids.
This frothy geometry of the Megaparsec Universe is evidently one of the most prominent aspects of the cosmic fabric, outlined by galaxies populating huge filamentary and wall-like structures, the sizes of the most conspicuous one frequently exceeding 100h-1 Mpc. The closest and best studied of these massive anisotropic matter concentrations can be identified with known supercluster complexes, enormous structures comprising one or more rich clusters of galaxies and a plethora of more modestly sized clumps of galaxies. A prominent and representative nearby specimen is the Perseus-Pisces supercluster, a 5 wide ridge of at least 50 Mpc length, possibly extending out to a total length of 140 Mpc. In addition to the presence of such huge filaments the galaxy distribution also contains vast planar assemblies. A striking example of is the Great Wall, a huge planar assembly of galaxies with dimensions that are estimated to be of the order of Mpc (Geller & Huchra 1989). Within and around these anisotropic features we find a variety of density condensations, ranging from modest groups of a few galaxies up to massive compact galaxy clusters. The latter stand out as the most massive fully collapsed and virialized objects in the Universe. In nearby representatives like the Virgo and Coma cluster typically more than a thousand galaxies have been identified within a radius of a mere 1.5 Mpc around the core. They may be regarded as a particular population of cosmic structure beacons as they typically concentrate near the interstices of the cosmic web, nodes forming a recognizable tracer of the cosmic matter distribution out to vast distances (e.g. Borgani & Guzzo 2001). Complementing this cosmic inventory leads to the existence of large voids, enormous regions with sizes in the range of Mpc that are practically devoid of any galaxy, usually roundish in shape. The earliest recognized one, the Boötes void (Kirshner et al. 1981, 1987), a conspicuous almost completely empty spherical region with a diameter of around Mpc, is still regarded as the canonic example. The role of voids as key ingredients of the cosmic matter distribution has since been convincingly vindicated in various extensive redshift surveys, up to the recent results produced by 2dF redshift survey and the Sloan redshift surveys.
Of utmost significance for our inquiry into the issue of cosmic structure formation is the fact that the prominent structural components of the galaxy distribution – clusters, filaments, walls and voids – are not merely randomly and independently scattered features. On the contrary, they have arranged themselves in a seemingly highly organized and structured fashion, the cosmic foam. They are woven into an intriguing foamlike tapestry that permeates the whole of the explored Universe. Voids are generically associated with surrounding density enhancements. In the galaxy distribution they represent both contrasting as well as complementary components ingredients, the vast under-populated regions, (the voids), being surrounded by walls and filaments. At the intersections of the latter we often find the most prominent density enhancements in our universe, the clusters of galaxies.
3 Gravitational Foam Formation and Bubble Dynamics.
Foamlike patterns have not only been confined to the real world. Equally important has been the finding that foamlike patterns do occur quite naturally in a vast range of structure formation scenarios within the context of the generic framework of gravitational instability theory. Prodded by the steep increase in computing power and the corresponding proliferation of ever more sophisticated and extensive simulation software, a large range of computer models of the structure formation process have produced telling images of similar foamlike morphologies. They reveal an evolution proceeding through stages characterized by matter accumulation in structures with a pronounced cellular morphology.
The generally accepted theoretical framework for the formation of structure is that of gravitational instability. The formation and moulding of structure is ascribed to the gravitational growth of tiny initial density- and velocity deviations from the global cosmic density and expansion. An important aspect of the gravitational formation process is its inclination to progress via stages in which the cosmic matter distribution settles in striking anisotropic patterns. Aspherical overdensities, on any scale and in any scenario, will contract such that they become increasingly anisotropic, as long as virialization has not yet set in. At first they turn into a flattened ‘pancake’, possibly followed by contraction into an elongated filament. Such evolutionary stages precede the final stage in which a virialized object, e.g. a galaxy or cluster, will emerge. This tendency to collapse anisotropically finds its origin in the intrinsic primordial flattening of the overdensity, augmented by the anisotropy of the gravitational force field induced by the external matter distribution, i.e. by tidal forces. Naturally, the induced anisotropic collapse has been the major agent in shaping the cosmic foamlike geometry.
Inspired by early computer calculations, Icke (1984) pointed out that for the understanding of the formation of the large coherent patterns pervading the Universe it may be more worthwhile to direct attention to the complementary evolution of underdense regions. By contrast to the overdense features, the low-density regions start to take up a larger and larger part of the volume of the Universe. Icke (1984) then made the interesting observation that the arguments for the dynamics and evolution of slightly anisotropic – e.g. ellipsoidal – primordial overdensities are equally valid when considering the evolution of low-density regions. The most important difference is that the sense of the final effect is reversed. The continuously stronger anisotropy of the force field in collapsing ellipsoidal leads to the characteristics tendency for slight initial asphericities to get amplified during the collapse, the major internal mechanism for the formation of the observed filaments in the galaxy distribution. By contrast, a void is effectively a region of negative density in a uniform background. Therefore, they will expand as the overdense regions collapse, while slight asphericities decrease as the voids become larger. This can be readily appreciated from the fact that with respect to an equally deep spherical underdensity, an ellipsoidal void has a decreased rate of expansion along the longest axis of the ellipsoid and an increased rate of expansion along the shortest axis. Together with the implied Hubble-type velocity field, voids will thus behave like low-density ‘super-Hubble’ expanding patches in the Universe. To describe this behaviour we coined the term “Bubble Theorem” (Icke 1984).
Evidently, we have to be aware of the serious limitations of the ellipsoidal model. It grossly oversimplifies in disregarding important aspects like the presence of substructure in and the immediate vicinity of peaks and dips in the primordial density field. Still, it is interesting to realize that in many respects the homogeneous model is a better approximation for underdense regions than it is for overdense ones. Voids expand and get drained, and the interior of a (proto)void rapidly flattens out, which renders the validity of the approximation accordingly better. Such behaviour was clearly demonstrated in circumstances of voids embedded in a full complex general cosmic density field (see e.g. Van de Weygaert & van Kampen 1993, their Fig. 16). Their systematic study also showed how voids in general will evolve towards a state in which they become genuine “Superhubble Bubbles”.
In realistic circumstances, expanding voids will sooner or later encounter their peers or run into dense surroundings. The volume of space available to a void for expansion is therefore restricted. Voids will also be influenced by the external cosmic mass distribution, and substructure may represent an additional non-negligible factor within the void’s history. In general, we deal with a complex situation of a field of expanding voids and collapsing peaks, of voids and peaks over a whole range of sizes and masses, expanding at different rates and at various stages of dynamical development. For the purpose of our geometric viewpoint, the crucial question is whether it is possible to identify some characteristic and simplifying elements within such a complex. Indeed, simulations of void evolution (e.g. Dubinski et al. 1993) represent a suggestive illustration of a hierarchical process akin to the void hierarchy seen in realistic simulations (e.g. Van de Weygaert 1991b). It shows the maturing of small-scale voids until their boundaries would reach a shell-crossing catastrophe, after which they merge and dissolve into a larger embedding void. This process gets continuously repeated as the larger parent voids in turn dissolve into yet larger voids. For a primordial Gaussian density field, corresponding analytical calculations (Sheth & Van de Weygaert 2002) then yield a void size distribution (broadly) peaked around a characteristic void size.
A bold leap then brings us to a geometrically interesting situation. Taking the voids as the dominant dynamical component of the Universe, and following the “Bubble Theorem”, we may think of the large scale structure as a close packing of spherically expanding regions. Then, approximating a peaked void distribution by one of a single scale, we end up with a situation in which the matter distribution in the large scale Universe is set up by matter being swept up in the bisecting interstices between spheres of equal expansion rate. This ASYMPTOTIC description of the cosmic clustering process leads to a geometrical configuration that is one of the main concepts in the field of stochastic geometry: VORONOI TESSELLATIONS.
4 Voronoi Tessellations: the Geometric Concept
A Voronoi tessellation of a set of nuclei is a space-filling network of polyhedral cells, each of which delimits that part of space that is closer to its nucleus than to any of the other nuclei. In three dimensions a Voronoi foam consists of a packing of Voronoi cells, each cell being a convex polyhedron enclosed by the bisecting planes between the nuclei and their neighbours. A Voronoi foam consists of four geometrically distinct elements: the polyhedral cells (voids), their walls (pancakes), edges (filaments) where three walls intersect, and nodes (clusters) where four filaments come together.
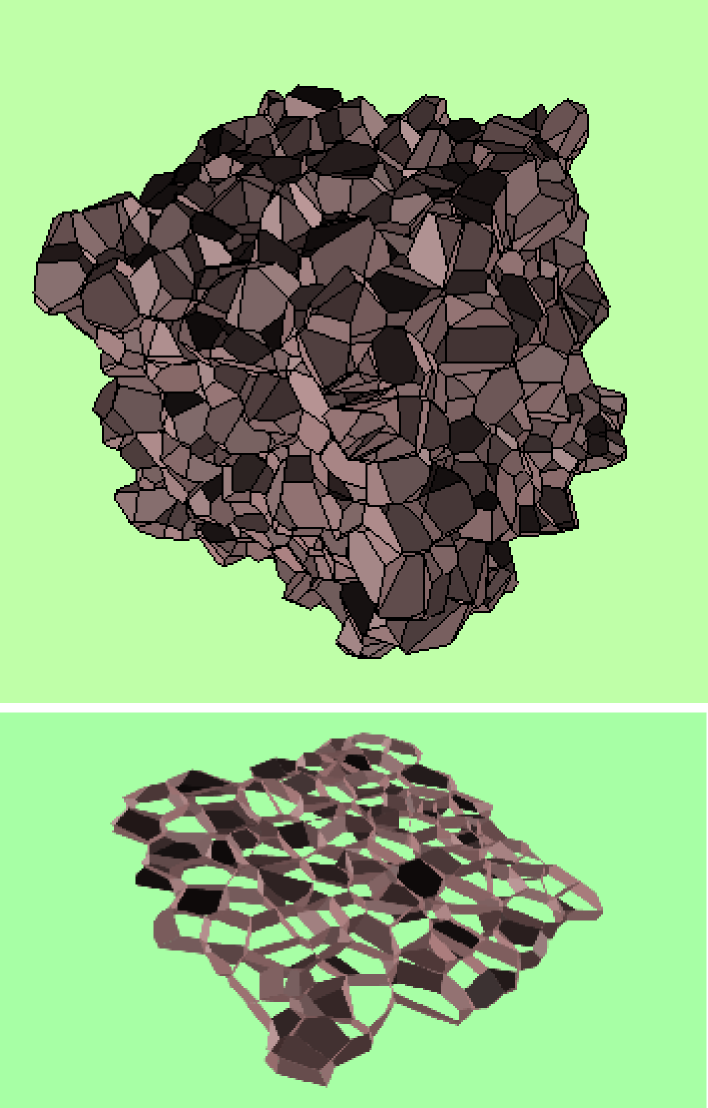
Formally, each Voronoi region is the set of points which is nearer to nucleus than to any of the other nuclei in a set of nuclei in -dimensional space , or a finite region thereof, , where are the position vectors of the nuclei in , and the Euclidian distance between and (evidently, one can extend the concept to any arbitrary distance measure). From this basic definition, we can directly infer that each Voronoi region is the intersection of the open half-spaces bounded by the perpendicular bisectors (bisecting planes in 3-D) of the line segments joining the nucleus and any of the the other nuclei. This implies a Voronoi region to be a convex polyhedron (or polygon when in 2-D), a Voronoi polyhedron. The complete set of constitute a space-filling tessellation ofmutually disjunct cells in d-dimensional space , the Voronoi tessellation relative to . A good impression of the morphology of a complete Voronoi tessellation can be seen in figure 1, a tessellation of 1000 cells generated by a Poisson distribution of 1000 nuclei in a cubic box.
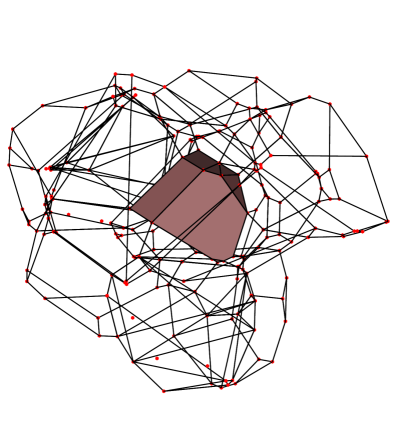
Taking the three-dimensional tessellation as the archetypical representation of structures in the physical world, we can identify four constituent elements in the tessellation, intimately related aspects of the full Voronoi tessellation. In addition to (1) the polyhedral Voronoi cells these are (2) the polygonal Voronoi walls outlining the surface of the Voronoi cells, (3) the one-dimensional Voronoi edges defining the rim of both the Voronoi walls and the Voronoi cells, and finally (4) the Voronoi vertices which mark the limits of edges, walls and cells. While each Voronoi cell is defined by one individual nucleus in the complete set of nuclei , each of the polygonal Voronoi walls is defined by two nuclei and , consisting of points having equal distance to and . The Voronoi wall is the subregion of the full bisecting plane of and which consists of all points closer to both and than other nuclei in . In analogy to the definition of a Voronoi wall, a Voronoi edge is a subregion of the equidistant line defined by three nuclei , and , the subregion consisting of all points closer to , and than to any of the other nuclei in . Evidently, it is part of the perimeter of three walls as well, , and . Pursuing this enumeration, Voronoi vertices are defined by four nuclei, , , and , being the one point equidistant to these four nuclei and closer to them than to any of the other nuclei belonging to . Note that this implies that the circumscribing sphere defined by the four nuclei does not contain any other nuclei. To appreciate the interrelation between these different geometric aspects, figure 2 lifts out one particular Voronoi cell from a clump of a dozen Voronoi cells. The central cell is the one with its polygonal Voronoi walls surface-shaded, while the wire-frame representation of the surrounding Voronoi cells reveals the Voronoi edges defining their outline and the corresponding vertices as red dots. Notice, how the distribution of vertices, generated by the stochastic point process of nuclei, is in turn a new and uniquely defined point process, that of the vertices !!!
5 Voronoi Tessellations: the Cosmological Context
In the cosmological context Voronoi Tessellations represent the Asymptotic Frame for the ultimate matter distribution distribution in any cosmic structure formation scenario, the skeleton delineating the destination of the matter migration streams involved in the gradual buildup of cosmic structures. The premise is that some primordial cosmic process generated a density fluctuation field. In this random density field we can identify a collection of regions where the density is slightly less than average or, rather, the peaks in the primordial gravitational potential perturbation field. As we have seen, these regions are the seeds of the voids. These underdense patches become “expansion centres” from which matter flows away until it runs into its surroundings and encounters similar material flowing out of adjacent voids. Notice that the dependence on the specific structure formation scenario at hand is entering via the spatial distribution of the sites of the density dips in the primordial density field, whose statistical properites are fully determined by the spectrum of primordial density fluctuations.
Matter will collect at the interstices between the expanding voids. In the asymptotic limit of the corresponding excess Hubble parameter being the same in all voids, these interstices are the bisecting planes, perpendiculary bisecting the axes connecting the expansion centres. For any given set of expansion centres, or nuclei, the arrangement of these planes define a unique process for the partitioning of space, a Voronoi tessellation (Voronoi 1908, see Fig. 1 and 2). A particular realisation of this process (i.e. a specific subdivision of -space according to the Voronoi tessellation) may be called a Voronoi foam (Icke & Van de Weygaert 1987). Within such a cellular framework the interior of each “VORONOI CELL” is considered to be a void region. The planes forming the surfaces of the cells are identified with the “WALLS” in the galaxy distribution (see e.g. Geller & Huchra 1989). The “EDGES” delineating the rim of each wall are to be identified with the filaments in the galaxy distribution. In general, what is usually denoted as a flattened “supercluster” or cosmic “wall” will comprise an assembly of various connecting walls in the Voronoi foam. The elongated “superclusters” or “filaments” will usually consist of a few coupled edges (Fig. 3 clearly illustrates this for the Voronoi kinematic model). Finally, the most outstanding structural elements are the “VERTICES”, tracing the surface of each wall, outlining the polygonal structure of each wall and limiting the ends of each edge. They correspond to the very dense compact nodes within the cosmic network, amongst which the rich virialised Abell clusters form the most massive representatives.
Cosmologically, the great virtue of the Voronoi foam is that it provides a conceptually simple model for a cellular or foamlike distribution of galaxies, whose ease and versatility of construction makes it an ideal tool for statistical studies. By using such geometrically constructed models one is not restricted by the resolution or number of particles. A cellular structure can be generated over a part of space beyond the reach of any N-body experiment. Even though the model does not and cannot addres the galaxy distribution on small scales, it is nevertheless a useful prescription for the spatial distribution of the walls and filaments themselves. This makes the Voronoi model particularly suited for studying the properties of galaxy clustering in cellular structures on very large scales, for example in very deep pencil beam surveys, and for studying the clustering of clusters in these models.
6 Voronoi Galaxy Distributions
Having established the cosmological context for Voronoi tessellations in the form of, approximate and asymptotic, skeletal template for the large-scale mass distribution we set about to generate the corresponding matter distributions. Matter is supposed to aggregate in and around the various geometrical elements of the cosmic frame, such as the walls, the filaments and the vertices.
It is the stochastic yet non-Poissonian geometrical distribution of the walls, filaments and clusters embedded in the cosmic framework which generates the large-scale clustering properties of matter and the related galaxy populations. The small-scale distribution of galaxies, i.e. the distribution within the various components of the cosmic skeleton, will involve the complicated details of highly nonlinear small-scale interactions of the gravitating matter. N-body simulations are preferred for treating that problem. For our purposes, we take the route of complementing the large-scale cellular distribution induced by Voronoi patterns by a user-specified small-scale distribution of galaxies. Ideally, well-defined and elaborate physical models would fill in this aspect. A more practical alternative approch involves the generation of either tailor-made purely heuristic “galaxy” distributions in and around the various elements of a Voronoi tessellation (e.g. pure uniform distributions). Alternatively, we can generate distributions that more closely resemble the outcome of dynamical simulations, and represent an idealized and asymptotic description thereof. Such a model is the kinematic model defined by Van de Weygaert & Icke (1989).
Particular emphasis should be put on that fact that this Voronoi strategy has the unique and fundamental feature of studying galaxy distributions around geometrical features that themselves have some distinct and well-defined stochastic spatial distribution. The galaxies are residing in walls, filaments and vertices which are distributed themselves as an integral component of the Voronoi spatial network. Their distribution is not a pure random, but instead one in which these components themselves are spatially strongly correlated, connecting into coherent “super”structures !!! This background frame of spatially clustered geometrical elements not only determines the overall clustering properties of its galaxy population, it also represents and distinguishes it from from less physically motivated stochastic toy models (e.g. the double Poisson process).
6.1 Voronoi galaxy distributions: the Kinematic Model
The kinematic Voronoi model is based on the notion that when matter streams out of the voids towards the Voronoi skeleton, cell walls form when material from one void encounters that from an adjacent one. In the original “pancake picture” of Zel’dovich and collaborators, it was gaseous dissipation fixating the pancakes (walls), automatically leading to a cellular galaxy distribution. But also when the matter is collisionless, the walls may be hold together by their own self-gravity. Accordingly, the structure formation scenario of the kinematic model proceeds as follows. Within a void, the mean distance between galaxies increases uniformly in the course of time. When a galaxy tries to enter an adjacent cell, the gravity of the wall, aided and abetted by dissipational processes, will slow its motion down. On the average, this amounts to the disappearance of its velocity component perpendicular to the cell wall. Thereafter, the galaxy continues to move within the wall, until it tries to enter the next cell; it then loses its velocity component towards that cell, so that the galaxy continues along a filament. Finally, it comes to rest in a node, as soon as it tries to enter a fourth neighbouring void. Of course the full physical picture is expected to differ considerably in the very dense, highly nonlinear regions of the network, around the filaments and clusters. Nonetheless, the Voronoi kinematic model produces a structural morphology containing the revelant characteristics of the cosmic foam, both the one seen in large redshift surveys as the one found in the many computer model N-body simulations.
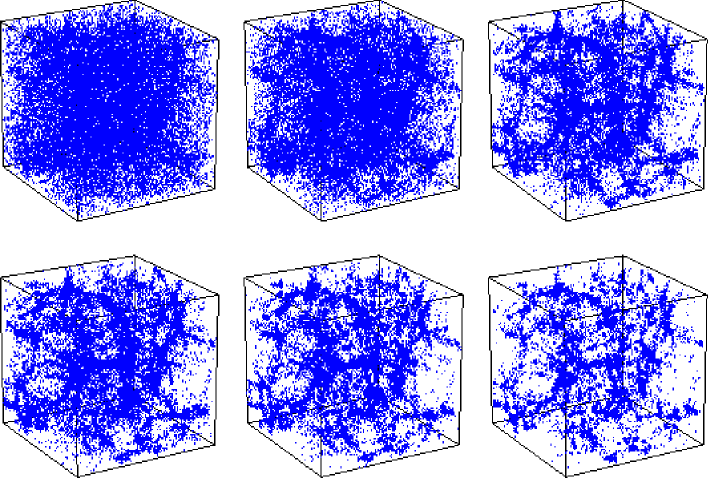
The evolutionary progression within our Voronoi kinematic scheme, from an almost featureless random distribution, via a wall-like and filamentary morphology towards a distribution in which matter ultimately aggregates into conspicuous compact cluster-like clumps can be readily appreciated from the sequence of 6 cubic 3-D particle distributions in Figure 3. The steadily increasing contrast of the various structural features is accompanied by a gradual shift in topological nature of the distribution. The virtually uniform particle distribution at the beginning (upper lefthand frame) ultimately unfolds into the highly clumped distribution in the lower righthand frame. At first only a faint imprint of density enhancements and depressions can be discerned. In the subsequent first stage of nonlinear evolution we see a development of the matter distribution towards a wall-dominated foam. The contrast of the walls with respect to the general field population is rather moderate (see e.g. second frame), and most obviously discernable by tracing the sites where the walls intersect and the galaxy density is slightly enhanced. The ensuing frames depict the gradual progression via a wall-like through a filamentary towards an ultimate cluster-dominated matter distribution. By then nearly all matter has streamed into the nodal sites of the cellular network. The initially almost hesitant rise of the clusters quickly turns into a strong and incessant growth towards their appearance as dense and compact features which ultimately stand out as the sole dominating element in the cosmic matter distribution (bottom righthand frame).
7 Superclustering: the clustering of clusters
Maps of the spatial distribution of clusters of galaxies show that clusters themsvelves are not Poissonian distributed, but turn out to be highly clustered (see e.g. Bahcall 1988). They aggregate to form huge supercluster complexes. For the sake of clarity, it is worthwhile to notice that such superclusters represent moderate density enhancements on a scale of tens of Megaparsec, typically in the order of a few times the average. They are still co-expanding with the Hubble flow, be it at a slightly decelerated rate, and are certainly not to be compared with collapsed, let alone virialized, identifiable physical entities like clusters.
7.1 Measuring Superclustering
For the context of the present work, which is specifically intended to shed light on the relation between clusters and the cosmic network, we stress the common quantification of clustering, in conjunction with three particularly relevant aspects following from these analyses. By folklore, cosmologists tend to concentrate on quantifying the clustering of galaxies merely through the first order deviations from a featureless purely uniform Poisson istribution of points. Figuring prominently as thé “tool of the trade” in these statistical studies is the two-point correlation function (and its sky-projected equivalent, the angular two-point correlation function ),
| (1) |
quantifying the excess probability of finding a pair of points in volume elements and separated by a distance in a point sample of average number density . For the sake of terminology, we wish to point out that in the field of cosmology the amplitude of is traditionally expressed in terms of the scale , , which then is usually indicated by the name “correlation length”. However, in the following we will use the more correct name of “clustering length”. Rather than a characteristic geometric scale, is more a measure for the “compactness” of the spatial clustering, set mainly by the small-scale clustering. A more significant scale within the context of the geometry of the spatial patterns in the density distribution is the scale at which . As a genuine scale of coherence, we reserve the name “correlation length” for this scale. For the morphology of the nontrivial spatial structures, the target of our study, it is a highly meaningful measure.
7.2 Distinctive Superclustering properties
The first characteristic of superclustering is the finding that the clustering of clusters is considerably more pronounced than that of galaxies. According to most studies the two-point correlation function of clusters is consistent with it being a scaled version of the power-law galaxy-galaxy correlation function, . While most agree on the same slope and a correlation amplitude that is significantly higher than that for the galaxy-galaxy correlation function, the estimates for the exact amplitude differ considerably from a factor . The original value found for the “clustering length” for rich Abell clusters was (Bahcall & Soneira 1983), up to a scale of Mpc (Bahcall 1988). Later work favoured more moderate values in the order of (e.g. Sutherland 1988, Dalton et al. 1992, Peacock & West 1992).
![[Uncaptioned image]](/html/astro-ph/0206366/assets/x4.png)
A related second characteristic of superclustering is that the differences in estimates of are at least partly related to the specific selection of clusters, i.e. the applied definition of clusters. Studies dealt with cluster samples of rich Abell clusters, others also included poorer clusters, or employed a physically well-founded criterion on the basis of X-ray emission. On the basis of such analyses we find a trend of an increasing clustering strength as the clusters in the sample become more rich ( massive). On the basis of the first related studies, Szalay & Schramm (1985) even put forward the (daring) suggestion that samples of clusters selected on richness would display a ‘fractal’ clustering behaviour, in which the clustering scale would scale linearly with the typical scale of the cluster catalogue. This typical scale is then the mean separation between the clusters of richness higher than : where . While the exact scaling of with mean number density is questionable, observations follow the qualitative trend of a monotonously increasing . It also seems to adhere to the increasing level of clustering that selections of more massive clusters appear to display in large-scope N-body simulations (e.g. Colberg 1998), given some telling detailed differences.
A third aspect of superclustering, one that often escapes emphasis but which we feel is important to focus attention on, is the issue of the spatial range over which clusters show positive correlations, the “coherence” scale of cluster clustering. Currently there is ample evidence that extends out considerably further than the galaxy-galaxy correlation , possibly out to . This is not in line with conventional presumption that the stronger level of cluster clustering is due to the more clustered locations of the (proto)cluster peaks in the primordial density field with respect to those of (proto)galaxy peaks. According to this conventional “peak bias” scheme we should not find significant non-zero cluster-cluster correlations on scales where the galaxies no longer show any significant clustering. If indeed is negligible on these large scales, explaining the large scale cluster-cluster clustering may be posing more complications than a simple interpretation would suggest.
8 Superclustering: the Voronoi Vertex Distribution
In the Voronoi description vertices are identified with the clusters of galaxies, a straightforward geometric identification without need to invoke additional descriptions. Like genuine clusters, these vertices then act as the condensed and compact complexes located at the interstices in the cosmic framework. The immediate and highly significant consequence is that – for a given Voronoi foam realization – the spatial distribution of clusters is fully and uniquely determined. The study of the clustering of these vertices can therefore be done without any further assumptions, fully set by the geometry of the tessellation. When doing this, we basically use the fact that the Voronoi node distribution is a topological invariant in co-moving coordinates, and does not depend on the way in which the walls, filaments, and nodes are populated with galaxies. The statistics of the nodes should therefore provide a robust measure of the Voronoi properties.
A first inspection of the spatial distribution of Voronoi vertices (Fig. 4, top frame) immediately reveals that it is not a simple random Poisson distribution. The full spatial distribution of Voronoi vertices in the cubic volume involves a substantial degree of clustering, a clustering which is even more strongly borne out by the distribution of vertices in a thin slice through the box (bottom lefthand frame) and equally well reflected in the sky distribution (bottom righthand frame). The impression of strong clustering, on scales smaller than or of the order of the cellsize , is most evidently expressed by the corresponding two-point correlation function (Fig. 4, log-log plot lefthand frame, lin-lin plot in the righthand frame). Not only can we discern a clear positive signal but – surprising at the time of its finding on the basis of similar computer experiments (van de Weygaert & Icke 1989) – out to a distance of at least the correlation function appears to be an almost perfect power-law,
| (2) |
The solid line in the log-log diagram in Fig. 4 represents the power-law with these parameters, the slope and “clustering length” . (the solid line represents the power-law with these parameters). Beyond this range, the power-law behaviour breaks down and following a gradual decline the correlation function rapidly falls off to a zero value once distances are of the order of (half) the cellsize. Assessing the behaviour of in a linear-linear plot, we get a better idea of its behaviour around the zeropoint “correlation length” (bottom righthand frame fig. 4). Beyond the distribution of Voronoi vertices is practically uniform. Its only noteworthy behaviour is the gradually declining and alternating quasi-periodic ringing between positive and negative values similar to that we also recognized in the “galaxy” distribution, a vague echo of the cellular patterns which the vertices trace out. Finally, beyond any noticeable correlation seems to be absent.
The above 2pt correlation function of Voronoi vertices is a surprisingly good and solid match to the observed world. It sheds an alternative view on the power-law clustering with power law found in the cluster distribution. Also, the observed cluster clustering length can be explained within the context of a cellular model, suggesting a cellsize of as the basic scale of the cosmic foam.
On the other hand, the latter also reveals a complication. The suggested cell scale is surely well in excess of the size of the voids in the galaxy distribution. In addition, it appears to point to an internal inconsistency within the Voronoi concept. We saw above that if we tie the observed galaxy-galaxy correlation to the clustering of objects in the walls and filaments of the same tessellation framework, it suggests a cellsize . This would conflict with the cellsize that would correspond to a good fit of the Voronoi vertex clustering to cluster clustering. The solution to this dilemma lead to an intriguing finding (for a complete description of this result see Van de Weygaert 2001).
8.1 Biased Voronoi Vertex Selections
We first observe that the vertex correlation function of eqn. (2) concerns the full sample of vertices, irrespective of any possible selection effects based on one or more relevant physical aspects. In reality, it will be almost inevitable to invoke some sort of biasing through the definition criteria of the involved catalogue of clusters. Interpreting the Voronoi model in its quality of asymptotic approximation to the galaxy distribution, its vertices will automatically comprise a range of “masses”.
Brushing crudely over the details of the temporal evolution, we may assign each Voronoi vertex a “mass” estimate by equating that to the total amount of matter ultimately will flow towards that vertex. When we use the “Voronoi streaming model” as a reasonable description of the clustering process, it is reasonably straightforward if cumbersome to calculate the “mass” or “richness” of each Voronoi vertex by pure geometric means. Evidently, vertices surrounding large cells are expected to be more massive. The details, turn out to be challengingly complex, as it concerns the (purely geometric) calculation of the volume of a non-convex polyhedron centered on the Voronoi vertex. The related nuclei are the ones that supply the Voronoi vertex with inflowing matter.
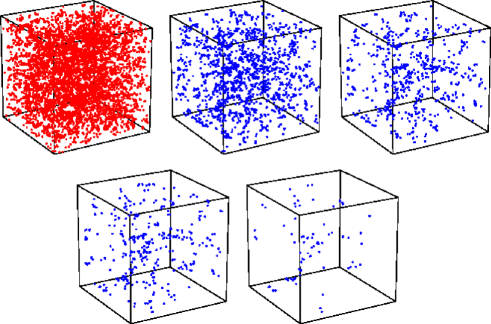
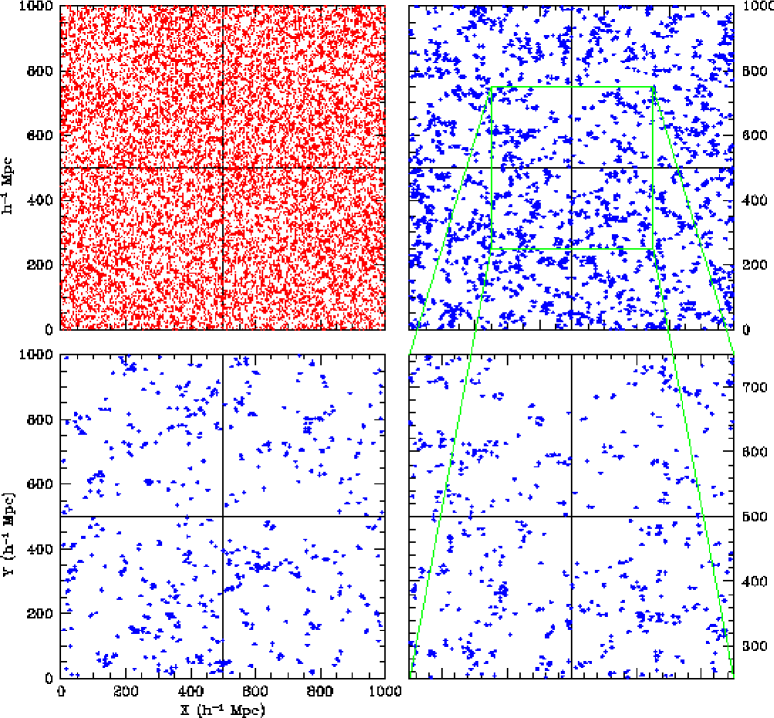
To get an impression of the resulting selected vertex sets, Figure 5 shows 5 times the same box of size, each with a specific subset of the full vertex distribution (top lefthand cube). In the box we set up a realization of a Voronoi foam comprising 1000 cells with an average size of . From the full vertex distribution we selected the ones whose “richness” exceeds some specified lower limit. The depicted vertex subsets correspond to progressively higher lower mass limits, such that 100, 25, 10, 5 and most massive vertices are included (from top lefthand to bottom righthand). The impression is not the one we would get if the subsamples would be mere random diluted subsamples from the full vertex sample. On the contrary, we get the definite impression of a growing coherence scale !!! Correcting for a possibly deceiving influence of the dilute sampling, and sampling an equal number of vertices from each “selected” sample only considerably strengthens this impression. There is an intrinsic effect in changing clustering properties as a function of (mass-defined) cluster sample.
8.2 Vertex clustering: Geometric Biasing ?
All in all, Fig. 5 provides ample testimony of a profound largely hidden large-scale pattern in foamlike networks, a hithero entirely unsuspected large-scale coherence over a range exceeding many cellsizes.
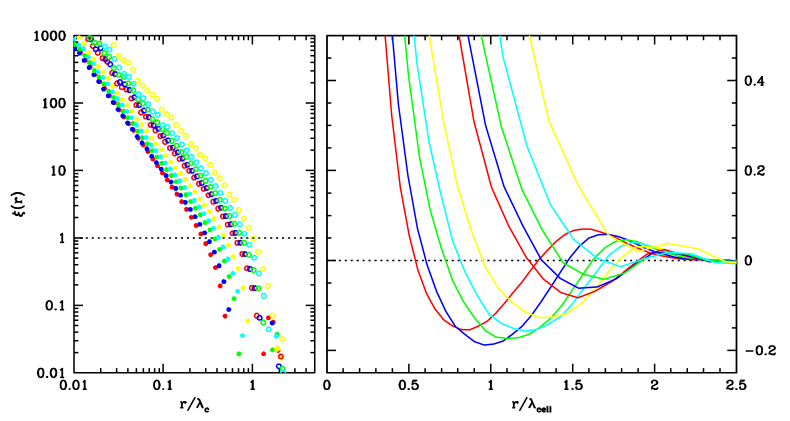
To quantify the impression given by the distribution of the biased vertex selections, we analyzed the two-point correlation function for each vertex sample. We computed for samples ranging from the complete sample down to the ones merely containing the most massive ones. As the average distance between the sample vertices increases monotonously with rising subsample richness, in the following we will frequently use the parameter for characterizing the richness of the sample, ranging from up to for vertex samples comprising all vertices up to samples with the most massive vertices (the basic cellsize functions objective distance unit).
The surprising finding is that all subsamples of Voronoi vertices do retain a two-point correlation function displaying the same qualitative behaviour as the for the full unbiased vertex sample (Fig 6). Out to a certain range it invariably behaves like a power-law (lefthand frame), while beyond that range the correlation functions all show the decaying oscillatory behaviour that already has been encountered in the case of the full sample. While all vertex convincingly confirm the impression of clustered point distributions, merely by the fact that it is rather straightforward to disentangle the various superposed two-point correlation functions we can immediately infer significant systematic differences.
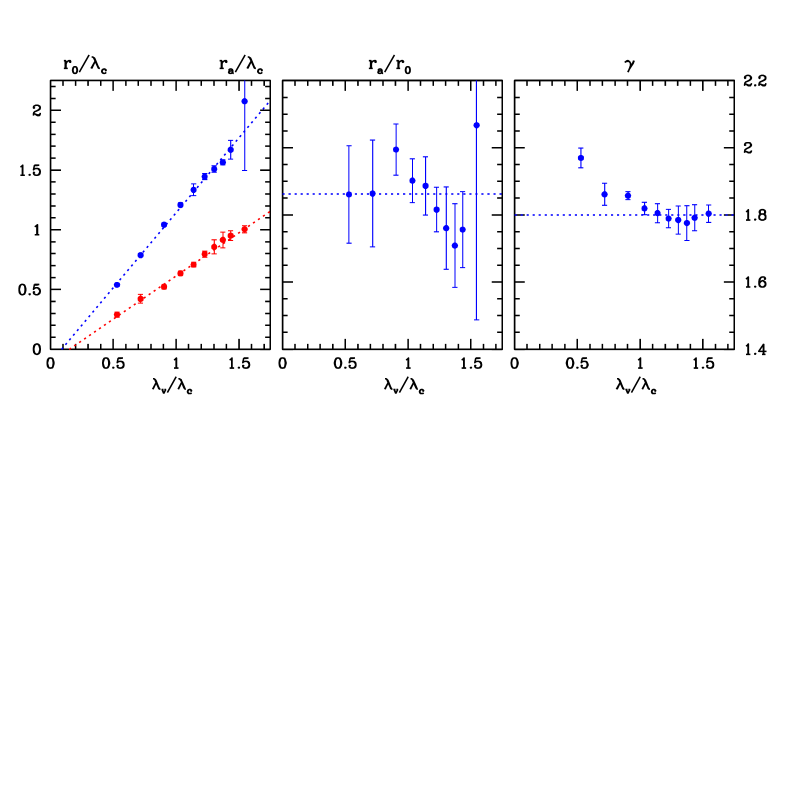
First observation is that the amplitude of the correlation functions increases monotonously with rising vertex sample richness. Expressing the amplitude in terms of the “clustering length” and plotting this against the between the sample vertices (both in units of ), a striking almost perfectly linear relation is resulting (Fig. 7, lefthand frame, lower line). In other words, almost out of the blue, the “fractal” clustering scaling description of Szalay & Schramm (1985) appears to be stealthily hidden within foamy geometries. Although in the asymptotic Voronoi model we may be partially beset by the fact that we use an asymptotic measure for the vertex “mass” – the total amount of mass that ultimately would settle in the nodes of the cosmic foam – it may have disclosed that ultimately it reflects the foamy structured spatial matter distribution. Overall, the scaling of the clustering strength explains the impression of the increasingly compact clumpiness seen in the “biased” vertex distributions in Fig. 5. Summarizing, we can conclude that the foamy geometry is the ultimate ground for the observed amplified levels of cluster clustering.
A second significant observation is that the lin-lin large-scale behaviour of the seems to extend to larger and larger distances as the sample richness is increasing. The oscillatory behaviour is systematically shifting outward for the richer vertex samples, which reflects the fact that clustering patterns extend increasingly outward. Even though the basic cellular pattern had a characteristic scale of only , the sample of the richest nodes apparently seem to set up coherent patterns extending at least 2 to 3 times larger. This is clearly borne out by the earlier shown related point distributions (Fig. 5). Foamlike geometries seemingly induce coherent structures significantly larger than their basic size !!! This may hint at another tantalizing link between the galaxy and the cluster distribution. To elucidate this behaviour further, in Fig. 7 (lefthand frame, higher line) we also plotted the “correlation (coherence) scale” versus the average sample vertex distance . And yet again, as in the case of , we find an almost perfectly linear relation !!!
Combining the behaviour of and we therefore find a remarkable ‘self-similar’ scaling behaviour, in which the ratio of correlation versus clustering length is virtually constant for all vertex samples, (see Fig. 7, central frame). Foamlike networks appear to induce a clustering in which richer objects not only cluster more strongly, but also further out !!!
A final interesting detail on the vertex clustering scaling behaviour is that a slight and interesting trend in the behaviour of power-law slope. The richer samples correspond to a tilting of the slope. Interestingly, borne out by the lower righthand frame in Fig. 7, we see a gradual change from a slope for the full sample, to a robust for the selected samples.
9 Conclusions: Bias, Cosmic Geometry and Self-Similarity
The uncovered systematic trends of vertex clustering have uncovered a hidden ‘self-similar’ clustering of vertices. This may be appreciated best from studying a particular realization of such behaviour (see Fig. 8)
The above results form a tantalizing indication for the existence of self-similar clustering behaviour in spatial patterns with a cellular or foamlike morphology. It might hint at an intriguing and intimate relationship between the cosmic foamlike geometry and a variety of aspects of the spatial distribution of galaxies and clusters. One important implication is that with clusters residing at a subset of nodes in the cosmic cellular framework, a configuration certainly reminiscent of the observed reality, it would explain why the level of clustering of clusters of galaxies becomes stronger as it concerns samples of more massive clusters. In addition, it would succesfully reproduce positive clustering of clusters over scales substantially exceeding the characteristic scale of voids and other elements of the cosmic foam. At these Megaparsec scales there is a close kinship between the measured galaxy-galaxy two-point correlation function and the foamlike morphology of the galaxy distribution. In other words, the cosmic geometry apparently implies a ‘geometrical biasing” effect, qualitatively different from the more conventional “peak biasing” picture (Kaiser 1984).
10 Acknowledgments
I would like to thank J. Dankers for his help in Voronoi plotting with Geomview. Writing this contribution, fond memories emerged of the many years over which the encouragement by Vincent Icke and Bernard Jones paved my way on the path through the world of Voronoi !
11 References
References
- [1] Bahcall, N.A., 1988, ARA&A, 26, 631
- [2] Bahcall, N.A., Soneira, R., 1983, ApJ, 270, 20
- [3] Borgani, S., Guzzo, L., 2001, Nature, 409, 39
- [4] Colberg, J., 1998, Ph.D. thesis, Ludwig-Maximilian Univ. München
- [5] Dalton, G.B., Efstathiou, G., Maddox, S.J., Sutherland, W.J., 1992, ApJ, 390, L1
- [6] De Lapparent, V., Geller, M.J., Huchra, J.P., 1986, ApJ, 302, L1
- [7] Dubinski, J., Da Costa, L.N., Goldwirth, D.S., Lecar, M. Piran, T., 1993, ApJ, 410, 458
- [8] Efstathiou, G., Ellis, R.S., Peterson, B.A., 1988, MNRAS, 232, 431
- [9] Geller, M.J., Huchra, J., 1989, Science, 246, 897
- [10] Icke, V., 1972, Ph.D. Thesis, University Leiden
- [11] Icke, V., 1984, MNRAS, 206, 1P
- [12] Icke, V., van de Weygaert, R., 1987, A&A, 184, 16
- [13] Kaiser, N., 1984, ApJ, 284, L9
- [14] Kirshner, R.P., Oemler, A., Schechter, P.L., Shectman, S.A., 1981, ApJ, 248, L57; 1987, ApJ, 314, 493
- [15] Peacock, J.A., West, M.J., 1992, 259, 494
- [16] Sheth, R.K., van de Weygaert, R., 2002, in prep.
- [17] SubbaRao, M.U., Szalay, A.S., 1992, ApJ, 391, 483
- [18] Sutherland, W., 1988, MNRAS, 234, 159
- [19] Szalay, A.S., Schramm, D.N., 1985, Nature, 314, 718
- [20] Voronoi, G., 1908, J. reine angew. Math., 134, 198
- [21] van de Weygaert, R., 1991a, MNRAS, 249, 159
- [22] van de Weygaert, R., 1991b, Ph.D. Thesis, University Leiden
- [23] van de Weygaert, R., 1994, A&A, 283, 361
- [24] van de Weygaert, R., 2002, A&A, to be submitted
- [25] van de Weygaert, R., Icke, V., 1989, A&A, 213, 1
- [26] van de Weygaert, R., van Kampen, E., 1993, MNRAS, 263, 481