Interstellar Phase Transitions Stimulated by Time-dependent Heating
Abstract
We use three-dimensional hydrodynamic numerical simulations to study phase transformations occurring in a clumpy interstellar gas exposed to time-dependent volumetric heating. To mimic conditions in the Galactic interstellar medium, we take a numerical model of a turbulent multiphase medium from Kritsuk & Norman (2002) computed in a periodic box with mean density cm-3 and mean pressure K cm-3. A second model with cm-3 is also considered. Variations of the heating rate on a timescale of 1–10 Myr applied thereafter cause pressure variations in the gas and shifting of the thermal equilibrium curve in the phase plane. This stimulates mass transfer between the gas phases via thermal instability, converting 5–10 % of the thermal energy into kinetic energy of gas motions. The experiments demonstrate that recurrent substantial heating episodes can maintain turbulence at this level. Possible applications to the interstellar gas heated by variable far-ultraviolet background radiation produced by short-living massive stars are discussed.
The Astrophysical Journal, 580:L000-L000, November 20, 2002
Received 2002 June 14; accepted 2002 October 3
1 Introduction
Thermal instability (TI), controlled by the interplay of volumetric heating and radiative cooling of optically thin gas, is one of the key physical processes operating in the interstellar medium (ISM) (Field, 1965; Meerson, 1996). For a long time it was believed that an important manifestation of TI is the splitting of the ISM into multiple thermal phases that coexist in pressure equilibrium (Pikel’ner, 1968; Field, Goldsmith, & Habing, 1969; McKee & Ostriker, 1977; McKee, 1990; Heiles, 2001). Recent numerical studies extended this classical picture, showing that interstellar turbulence quite naturally appears as a by-product of the same phase transformations that provide the irregular, clumpy and filamentary density substructure in the ISM (Koyama & Inutsuka, 2002; Kritsuk & Norman, 2002, hereafter KN02). In the absence of continuous driving, however, this turbulence decays as , with [KN02; cf. Mac Low, et al. (1998); Stone, Ostriker, & Gammie (1998)], leaving behind a “fossil” isobaric density distribution with no substantial velocity structure remaining at the scales of the density inhomogeneities [cf. McCray, Stein, & Schwarz (1972)].
Since observations indicate the persistence of turbulence and substructure in the ISM on a variety of timescales and length scales, there must be some source of energy for turbulence support. A number of hydrodynamic and MHD mechanisms have been proposed to sustain turbulent motions within molecular clouds and other thermal phases of the ISM. These include winds from young stars (Norman & Silk, 1980; Franco & Shore, 1984), photoionization-regulated star formation (McKee, 1989), supernova explosions (McKee & Ostriker, 1977; Korpi et al., 1999; Kim, Balsara, & Mac Low, 2001), largescale external shocks (Kornreich & Scalo, 2000), and differential rotation (Richard & Zahn, 1999; Sellwood & Balbus, 1999; Wada & Norman, 1999). They rely on a combination of energy deposition from star-forming activity, self-gravity, magnetic effects, or galactic rotation to feed the turbulence. These options do not exhaust all possible driving mechanisms, cf. Norman & Ferrara (1996). Motivated by the results of KN02 on TI-induced ISM turbulence, we study here the possibility of purely “thermal” support for interstellar turbulence. This mechanism, which is physically distinct from the local mechanisms listed above, can operate in addition to them.
Most previous works focused specifically on TI implicitly assume the existence of stationary thermodynamic equilibrium. The ISM, however, is highly time-dependent (Gerola, Kafatos, & McCray, 1974; Bania & Lyon, 1980). In particular, time variations can be caused by changes in the level of ISM heating. The main source of energy input for the neutral gas is background radiation in the far-ultraviolet (FUV) part of the spectrum (Wolfire et al., 1995). The FUV field is generally due to OB associations of quickly evolving massive stars that form in giant molecular clouds. For example, in the local ISM the expected FUV energy density undergoes substantial fluctuations on a wide range of timescales from to Myr (Parravano, Hollenbach, & McKee, 2002). The focus of the numerical simulations presented in this Letter is on the hydrodynamic effects of the time-dependent heating of the ISM.
2 Thermal forcing for interstellar turbulence
2.1 Numerical Experiments
We solve the equations of ideal gasdynamics (eqs. [6]-[9] in Field 1965) in a cubic domain with periodic boundary conditions, assuming zero conductivity and no gravity. More detailed information regarding the simulations’ setup and numerical techniques used can be found in KN02. Each of our numerical solutions represents a one-parameter family of models in physical space with a box size , a mean gas density in the box , and a heating rate . Other variables should be scaled accordingly, e.g., time scales as . The dimensionless factor resembles scaling properties of the governing equations.
2.2 Thermal Phase Fractions Versus Mean Gas Density
In order to study the sensitivity of emerging thermal phases to our model parameters, we performed a series of low-resolution () simulations with a fixed value of the heating rate , varying the initial gas temperature, mean gas density , and box size . As in KN02, we conventionally define the thermal phases in terms of the equilibrium gas temperature based on the Field (1965) TI criterion applied to . The cold stable phase has K (phase H), the unstable regime falls into the range K (phase G), and the warm stable phase has K (phase F). We refer to the transient regime with K (dependent on initial conditions) as the “hot ionized medium” (hereafter HIM).
The mass fractions of the thermal phases (, , and ) in a relaxed state mostly depend on the mean gas density in the box . If is low enough, both the unstable and cold phases are transient, and evolution ends up with a single warm gas phase once the turbulence generated during the violent relaxation to thermal equilibrium decays. If is higher than , corresponding to the local pressure minimum on the bistable thermal equilibrium curve, the evolution ends up with a single cold phase. For intermediate mean gas densities, the system evolves to a multiphase state with an asymptotic ratio dependent solely on the value of .111Neither the initial temperature nor the box size will modify , provided that isobaric modes of TI are resolved in the unstable density regime in the vicinity of thermal equilibrium. Unresolved TI results tend to underestimate the cold gas fraction, overestimate the unstable gas fraction, and underestimate the turbulence decay rate [returning rather than , see A. G. Kritsuk & M. L. Norman (2002, in preparation)]. The mass fraction of thermally unstable gas can be % during the violent relaxation stage (including the cases with transient cold phase), but decreases to 5% later, when it also strongly correlates with the rms Mach number (, where ).
2.3 Variable Heating Rate and Thermal Forcing
Time variations in the heating rate translate the location of the thermal equilibrium curve in the phase plane along an isotherm (leaving the shape of the curve unchanged if ). For a given radiative cooling efficiency, the higher the heating rate, the higher the equilibrium pressure and density, in particular, . Thus, global variations in a medium with constant mean density on a sufficiently short timescale will necessarily entail some phase adjustment. Oscillations of the gas pressure and redistribution of mass between the thermal phases generate gas flows that gain their kinetic energy at the expense of the thermal energy supplied by the heating source. Phase restructuring in response to variations of involves a broad range of length scales and produces highly irregular flows since the density distribution in a multiphase medium itself is irregular. Therefore, to a certain extent, turbulence can be sustained by time-dependent heating if substantial variations occur on a timescale that is not too long compared with the turbulence decay timescale. Otherwise, during long periods of quiescence, the turbulence would get fossilized.
In the following, we present results for two models: (1) a low- case in which the cold phase gets fully dissolved into the warm phase during the high heating state and in which the medium hovers between single- and two-phase states as varies, and (2) an intermediate- case with varying phase content in a two-phase medium.
2.4 Low-density Medium
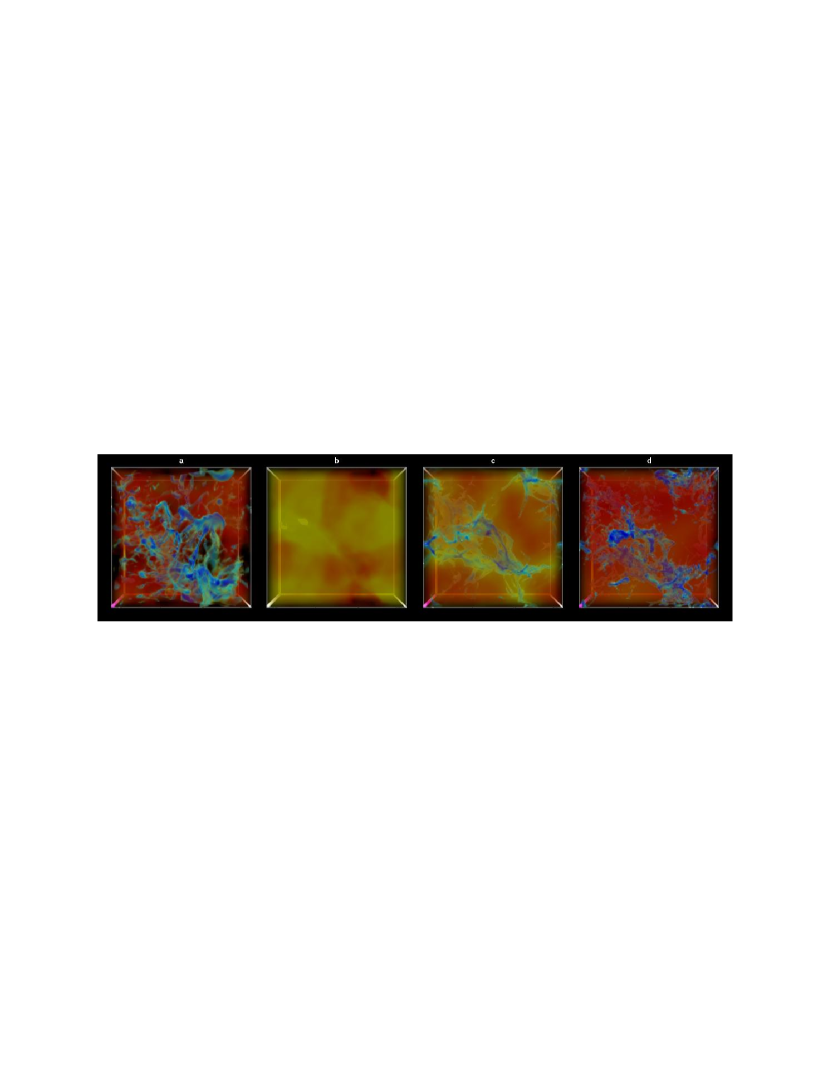
For our low-density run, we take initial conditions from the fiducial model of KN02,222We rescale physical units of the KN02 low-resolution ( grid zones) fiducial model to better fit local interstellar conditions (, time: , box size: pc, mean gas density: g cm-3, pressure: , and heating rate: ). at Myr (Fig. 1a). By this time, the gas has partially relaxed to a bistable thermal equilibrium after violent radiative cooling from a temperature of K. However, the gas pressure variations still remain substantial (, see Fig. 2e in KN02 for a phase diagram) and is slightly above one. For average conditions at Myr in the thermally unstable regime, the cooling scale is pc and the conductive (Field) scale is pc (see KN02 for definitions). Thus, on our low resolution grid, the cooling scale is marginally resolved, and the conductive scale falls below the resolution limit.
The higher resolution model () of KN02 at Myr returns a slightly higher value for and slightly lower value for , while is roughly the same as in the low-resolution model (the relative differences are 0.16, 0.16, and 0.005, respectively). The relative difference in generated kinetic energy for the high- and low-resolution models at Myr is 0.013. At later times, as relaxation becomes less violent, the deviations get smaller. We consider the above values to be good upper estimates for the effects of numerical diffusion. Therefore, the conclusions that we make below regarding the phase fractions and energy conversion efficiency are robust within the specified limits.
At Myr, we apply enhanced heating rate for a span of 1 Myr and then switch back to and keep it low for the next 2 Myr. We follow the evolution for a few cycles up to Myr using a piecewise-constant representation for with a period of 3 Myr. The mean gas density is below the minimum required for coexistence of two stable phases in pressure equilibrium during the high state, and it is slightly below the density value that corresponds to the local pressure maximum on the thermal equilibrium curve for the low state. The results are shown in Figures 1, 2, and 3.
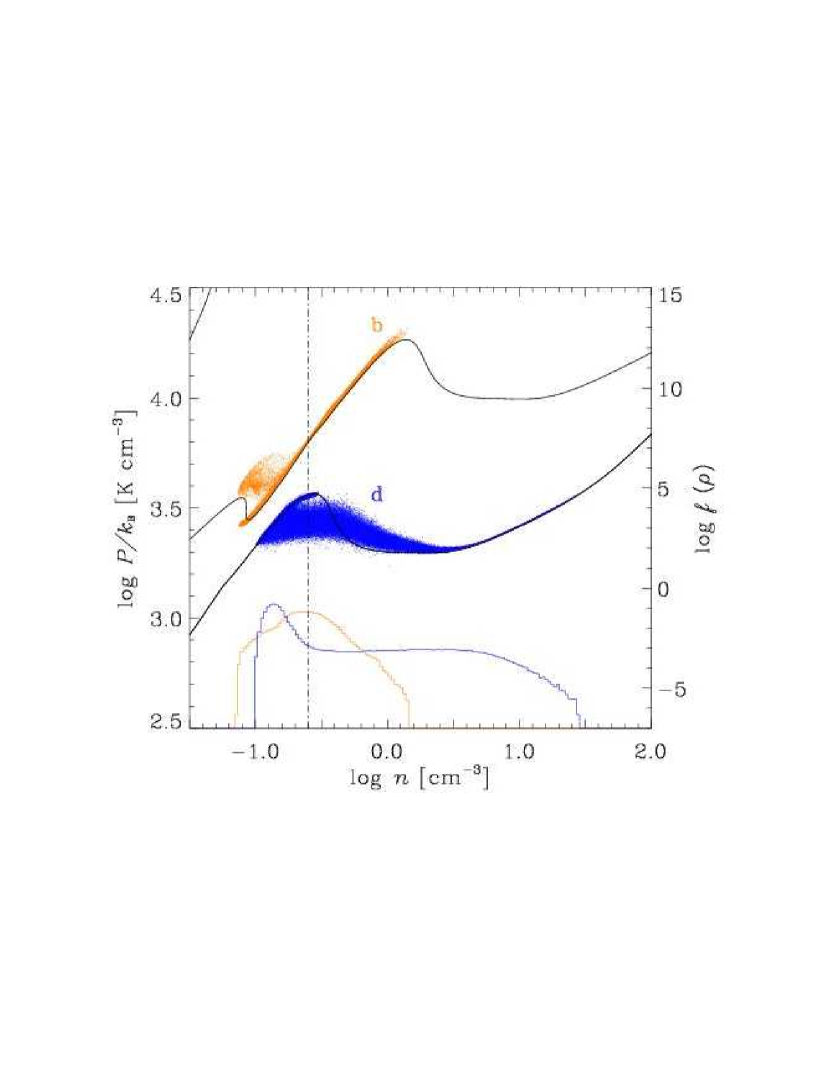
Overall, the evolution consists of a series of phase transitions, which follow the abrupt changes in the heating rate. Figure 2 displays the thermal equilibria for (upper curve) and (lower curve) and scatter plots of gas pressure versus density for partially relaxed states corresponding to the density fields shown in Figure 1b (high state) and Figure 1d (low state). After the change in heating rate at Myr, gas quickly ( Myr) switches to the high-state thermal equilibrium, but it then takes up to 0.7 Myr to completely dissolve the preexisting cold phase into the warm phase. A transition to the high state is accompanied by the growth of thermal and kinetic energy and by the decrease in the rms Mach number and density variance (Fig. 3, left panels). Also, the gas density range shifts to somewhat lower values, and warm phase gas enters a transonic regime as a result of the large pressure variations () accompanying the relaxation process. The enhanced heating episodes are also efficient in generating vorticity, as can be seen from the enstrophy plot in Figure 3. The transition back to the low state at Myr is also abrupt. It entails the formation of a new population of cold “clouds” along caustics in the warm-phase velocity field. This mechanism naturally produces dense structures that morphologically can be described as “blobby sheets,” introduced by Heiles & Troland (2002). The seeds of newly forming clouds can be seen in Figure 1c and the clouds’ morphology can be traced in the accompanying mpeg animation. The density probability distribution function (PDF) undergoes substantial changes during each period of evolution, loosing and regenerating its high-density shoulder in the high and low heating states, respectively (see Fig. 2). If a longer relaxation period were allowed in between the sequential high states, a bimodal density PDF would have developed.
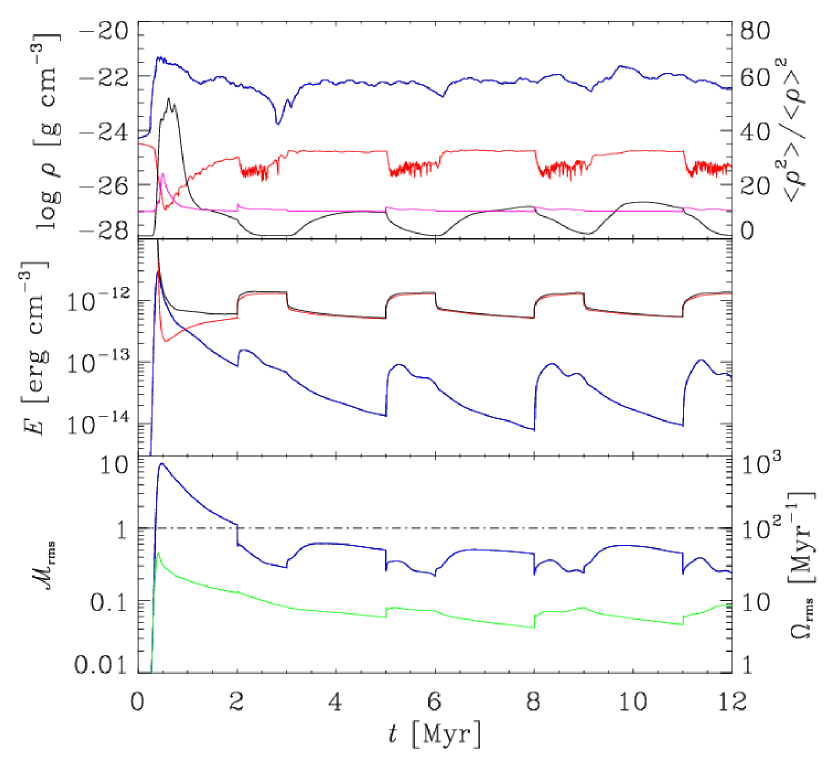
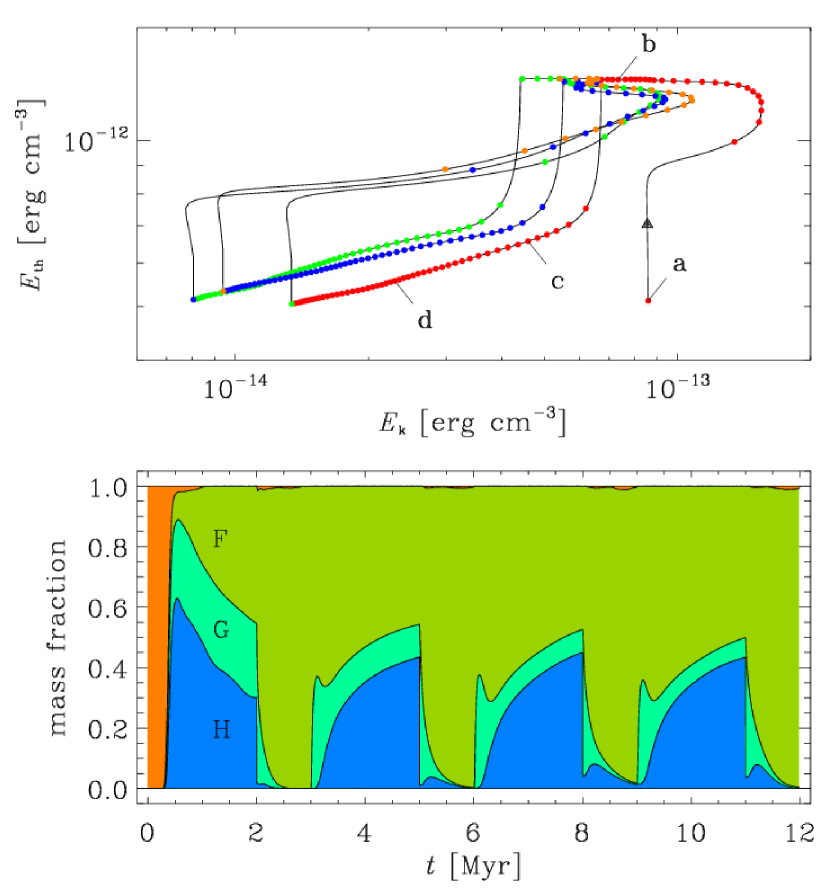
We ran the simulation for more than three periods to see how the medium adjusts to periodic variations of the heating rate. We found that kinetic energy peaks at % of the maximum thermal energy in about 0.4 Myr after the enhanced heating is switched on (Fig. 3). This result is insensitive to the initial conditions and to the particular choice of the low state duration. The system settles onto an “attractor” in the –plane. The maximum Mach number in the box oscillates in the range between 1.2 and 5 and roughly follows the evolutionary pattern of . Thus, thermally driven turbulence in a low-density medium is transonic.
There is a tendency for the unstable gas mass fraction, accompanying the production of the cold phase in the low state, to decrease slowly from cycle to cycle. The average value of is 9.5% or 11% for averaging over time intervals Myr or Myr, respectively. The mean mass fraction of the cold phase in the high states displays some secular oscillations, so that the cold phase does not always get completely dissolved during the high state. This means that the value of , chosen for this model, is close to a critical value that separates single- and two-phase media heated at . The -values grow up to % while the system remains in the low state. Were the low state to last longer, would approach the asymptotic value of %, recorded for the low-resolution fiducial run of KN02. The unstable mass fraction in turn would continue to drop to a level of a few percent.
2.5 Intermediate Density Case
For the intermediate-density model, we take a box size pc, a mean gas density g cm-3, and . With this setup, the mean gas density falls onto a stable branch of the thermal equilibrium curve (within the bistable pressure regime) during the high heating state, and it stays within the unstable density range during the low state. As in the low-density case, we take initial conditions at Myr from a low-resolution run, which follows gas cooling in a thermally unstable regime from an initial temperature of K. We checked a variety of periods for the time-dependent heating rate: 10 Myr (5 Myr high state and 5 Myr low state), 2.5 Myr (0.2 + 2.3), 2 Myr (1 + 1), 1 Myr (0.2 + 0.8), and 1 Myr (0.5 + 0.5). In all the cases, we find results similar to the low-density case in terms of kinetic energy support, with . The conclusions concerning Mach number, vorticity, and density variance evolution are essentially the same as in the low-density case.
As far as the mass fractions are concerned, we find essentially more unstable gas on the average (e.g., % in our experiment with a period of 1 Myr (0.5+0.5), averaged over five periods). The reason for this is twofold: first, the cold phase is always present and therefore so is the unstable interphase interface ( saturates at % in high state and at % in low state); second, the abrupt transition to the low state effectively populates the unstable regime at the expense of the warm stable phase, completely consuming it until this gas reexpands to join the warm stable phase of the low state that has a lower density than in the high state. The bulk of this thermally unstable gas is then slowly ( Myr) redistributed between the cold (68%) and warm (18%) stable phases as the turbulent relaxation proceeds. In contrast to the low-density case, cores of some of the individual cold “clouds” can survive several heating events without being dissolved. In addition, new cold clouds are forming by dynamic compressions in the disturbed warm phase () following transitions to the high state. This mechanism, described by Hennebelle & Pérault (1999), is inefficient in our low-density simulations.
3 Discussion
Our model is limited in many respects. First, it does not include effects of other driving mechanisms that can operate in parallel to thermal forcing. Second, by not including magnetic fields in the simulations, our description of ISM dynamics is incomplete. Third, the model does not have self-regulation, linking production of the cold phase to the heating rate via star formation efficiency (Parravano, 1988). Feedback could probably damp the oscillations occurring in response to the time variations of the heating rate introduced “by hand,” but this should be demonstrated by an explicit calculation. Fourth, the grain photoelectric heating rate is not simply proportional to gas density. This would slightly modify the shape of the thermal equilibrium curve as it shifts from a low to a high state. Finally, the equation of state and the cooling function that we use do not take into account dynamics of ionization, recombination, formation of molecules, etc., which are decoupled from hydrodynamics in our treatment. This could overestimate the minimum temperature of the cold phase and thus underestimate its density and the rms Mach number.
Nonetheless, our main conclusion that time-dependent heating supports turbulence in thermally unstable multiphase ISM remains valid in spite of the above-mentioned model simplifications. Thermal forcing can potentially excite turbulent oscillations on a wide range of length scales because of the penetrative nature of FUV radiation. The level of thermally sustained turbulence as a function of length scale at a given point within the Galactic disk is controlled by the local mean gas density and by the power spectrum of incident FUV flux time variations. It will share the pattern of spatial inhomogeneity of FUV energy density within the disk.
The thermally unstable gas mass fractions in our low- and intermediate-density models (%) are in reasonable agreement with measurements by Heiles & Troland (2002) as well as the fraction and morphology of the density distribution of the cold neutral phase (see Vázquez-Semadeni et al. (2002) for a review). Both these results imply a substantial level of turbulence in the ISM. We suggest time-dependent heating as one possible mechanism for driving this turbulence.
References
- Bania & Lyon (1980) Bania, T. M. & Lyon, J. G. 1980, ApJ, 239, 173
- Field (1965) Field, G. B. 1965, ApJ, 142, 531
- Field, Goldsmith, & Habing (1969) Field, G. B., Goldsmith, D. W., & Habing, H. J. 1969, ApJ, 155, L149
- Franco & Shore (1984) Franco, J. & Shore, S. N. 1984, ApJ, 285, 813
- Gerola, Kafatos, & McCray (1974) Gerola, H., Kafatos, M., & McCray, R. 1974, ApJ, 189, 55
- Heiles (2001) Heiles, C. 2001, in ASP Conf. Ser. 231, Tetons 4: Galactic Structure, Stars and the Interstellar Medium, ed. C.E. Woodward, M. D. Bicay, & J. M. Shull (San Francisco: ASP), 294
- Heiles & Troland (2002) Heiles, C. & Troland, T. H. 2002, preprint (astro-ph/0207105)
- Hennebelle & Pérault (1999) Hennebelle, P., & Pérault, M. 1999, A&A, 351, 309
- Kim, Balsara, & Mac Low (2001) Kim, J., Balsara, D., & Mac Low, M.-M. 2001, J. Korean Astron. Soc., 34, 333
- Kornreich & Scalo (2000) Kornreich, P. & Scalo, J. 2000, ApJ, 531, 366
- Korpi et al. (1999) Korpi, M. J., Brandenburg, A., Shukurov, A., Tuominen, I., & Nordlund, Å. 1999, ApJ, 514, L99
- Koyama & Inutsuka (2002) Koyama, H. & Inutsuka, S. 2002, ApJ, 564, L97
- Kritsuk & Norman (2002) Kritsuk, A. G., & Norman, M. L. 2002, ApJ, 569, L127 (KN02)
- Mac Low, et al. (1998) Mac Low, M.-M., Klessen, R. S., Burkert, A., & Smith, M. D. 1998, Phys. Rev. Lett., 80, 2754
- McCray, Stein, & Schwarz (1972) McCray, R., Stein, R. F., & Schwarz, J. 1972, ApJ, 177, L75.
- McKee (1990) McKee, C. F. 1990, in ASP Conf. Ser. 12, The Evolution of the Interstellar Medium, ed. L. Blitz (San Francisco: ASP), 3
- McKee (1989) McKee, C. F. 1989, ApJ, 345, 782
- McKee & Ostriker (1977) McKee, C. F., & Ostriker, J. P. 1977, ApJ, 218, 148
- Meerson (1996) Meerson, V. I. 1996, Rev. Mod. Phys., 68, 215
- Norman & Ferrara (1996) Norman, C. A. & Ferrara, A. 1996, ApJ, 467, 280
- Norman & Silk (1980) Norman, C. & Silk, J. 1980, ApJ, 238, 158
- Parravano (1988) Parravano, A. 1988, A&A, 205, 71.
- Parravano, Hollenbach, & McKee (2002) Parravano, A., Hollenbach, D. J., & McKee, C. F. 2002, preprint (astro-ph/0202196)
- Pikel’ner (1968) Pikel’ner, S. B. 1968, Sov. Astron., 11, 737
- Richard & Zahn (1999) Richard, D. & Zahn, J. 1999, A&A, 347, 734
- Sellwood & Balbus (1999) Sellwood, J. A. & Balbus, S. A. 1999, ApJ, 511, 660
- Stone, Ostriker, & Gammie (1998) Stone, J. M., Ostriker, E. C., & Gammie, C. F. 1998, ApJ, 508, L99
- Vázquez-Semadeni et al. (2002) Vázquez-Semadeni, E., Gazol, A., Passot, T., Sánchez-Salcedo, F. J. 2002, preprint (astro-ph/0201521)
- Wada & Norman (1999) Wada, K., & Norman, C. A. 1999, ApJ, 516, L13
- Wolfire et al. (1995) Wolfire, M. G., Hollenbach, D., McKee, C. F., Tielens, A. G. G. M., & Bakes, E. L. O. 1995, ApJ, 443, 152