FUSE Observations of the Magellanic Bridge Gas toward Two Early-Type Stars: Molecules, Physical Conditions, and Relative Abundances
Abstract
We discuss Far Ultraviolet Spectroscopic Explorer (FUSE) observations of two early-type stars, DI 1388 (, ) and DGIK 975 (, ), in the low density and low metallicity () gas of Magellanic Bridge (MB). The data have a spectral resolution of about 15,000 and signal-to-noise ratios range between 10 and 30 per resolution element in the spectra of DI 1388 and between 7 and 11 in the spectra of DGIK 975. DI 1388 is situated near the SMC, while DGIK 975 is closer to the LMC, allowing us to probe the MB gas in a widely different locations. Toward DI 1388, the FUSE observations show molecular hydrogen, O VI, and numerous other atomic or ionic transitions in absorption, implying the presence of multiple gas phases in a complex arrangement. The relative abundance (with respect to S II) pattern in the MB along the DI 1388 sight line is attributed to varying degrees of depletion onto dust similar to that of halo clouds. The N/O ratio is near solar, much higher than N/O in damped Ly systems, implying subsequent stellar processing to explain the origin of nitrogen in the MB. The diffuse molecular cloud in this direction has a low column density and low molecular fraction ( dex; ), yet two excitation temperatures ( K and K) are needed to fit the distribution of the different rotational levels. Though this is not typically seen in the Galaxy, we show that this is not uncommon in the Magellanic Clouds. H2 is observed in both the Magellanic Stream and the MB, yet massive stars form only in the MB, implying significantly different physical processes between them. In the MB some of the H2 could have been pulled out from the SMC via tidal interaction, but some also could have formed in situ in dense clouds where star formation might have taken place. Toward DGIK 975, the presence of neutral, weakly and highly ionized species suggest that this sight line has also several complex gas phases. The highly ionized species of O VI, C IV, and Si IV toward both stars have very broad features, indicating that multiple components of hot gas at different velocities are present. C IV/O VI varies within the MB but C IV/Si IV is relatively constant for both sight lines. Several sources (a combination of turbulent mixing layer, conductive heating, and cooling flows) may be contributing to the production of the highly ionized gas in the MB. Finally, this study has confirmed previous results that the high-velocity cloud HVC is mainly ionized composed of weakly and highly ions. The high ion ratios are consistent with a radiatively cooling gas in a fountain flow model.
1 Introduction
The Magellanic system is composed of two small irregular galaxies, the Large (LMC) and Small (SMC) Magellanic Clouds, in orbit around the Galaxy. Tidal interactions between these galaxies have produced several high velocity gas complexes connected to the Clouds (for a recent study, see Putman, 2000); namely the Magellanic Bridge (MB), the Magellanic Stream, and the leading Arm. In particular for this study, the Magellanic Bridge is a region of tenuous gas linking the body of the SMC to an extended arm of the LMC. The formation mechanism responsible for this feature remains unclear, but it is generally agreed that the MB was formed via a tidal encounter between the SMC and LMC. Gardiner & Noguchi (1996) have produced models that can reproduce simultaneously both the MB and the Magellanic Stream, and find that the MB was most likely pulled from the wing of the SMC 200 Myr ago during a close encounter between the two Clouds. However, its low metallicity ( based on C, N, O, Mg, and Si Rolleston et al., 1999) does not reflect the current SMC metallicity (, e.g., Russell and Dopita, 1992), suggesting that the MB gas could be formed from a mixture of SMC gas and an unenriched component or could be much older than the age predicted from theoretical models.
The MB contains early-type stars (Hambly et al., 1994; Demers & Battinelli, 1998; Rolleston et al., 1999). During their main-sequence lifetimes (as short as 20 Myr), these stars could not possibly migrate from the SMC since they do not exhibit peculiar velocities sufficient to explain their motion over the large distances they would need to cover. Therefore the MB provides the most metal poor gas in our neighborhood to investigate not only the gas, but also to observationally constrain star-formation in low metal and tenuous gas environment. Furthermore, it provides an unique opportunity to study in detail the gas resulting from tidal interactions. In the Galaxy, star formation generally occurs in dense molecular clouds (e.g., Evans, 1999). No direct evidence of molecular clouds have been discovered yet (Smoker et al., 2000), although Kobulnicky & Dickey (1999) found cold atomic clouds, suggesting molecular condensations.
Lehner et al. (2001) recently reported the results of a program to investigate the chemical composition and abundance pattern of the MB gas toward an early-type star, DI 1388, with the Hubble Space Telescope (HST) and the Space Telescope Imaging Spectrograph (STIS). The combination of high spectral resolution and high sensitivity in the ultraviolet bandpass ( Å) made it feasible to investigate the chemical composition and the physical conditions within the MB and revealed complex gas phases with neutral gas, weakly and highly ionized gas along the sight line studied. Yet only at lower wavelengths than the STIS bandpass, in the 905–1187 Å wavelength range, are the strong hydrogen molecular lines accessible. Other strong atomic and ionic resonance lines are as well only limited in this bandpass, such as the O VI doublet, a powerful diagnostic of collisionally ionized gas. O VI is unlikely to be produced by photoionization alone from starlight given that photons with eV are needed to convert O V to O VI. Such a bandpass is accessible now with the Far Ultraviolet Spectroscopic Explorer (FUSE) and therefore follow-up observations of the low metallicity, tenuous gas of the MB were obtained with this observatory.
In this article, we report on FUSE observations of two early-type stars in the MB, DI 1388 which is situated approximately mid-way between the SMC and LMC and DGIK 975, which lies at the western end of the Bridge near to the LMC halo. The FUSE spectra allow us for the first time to make a sensitive and direct search for molecules in the MB. They provide a means to study the collisional gas seen in O VI absorption and to compare with recent O VI surveys in the SMC and LMC (Hoopes et al., 2002; Howk et al., 2002a) and in the Galactic halo (Savage et al., 2000). They also provide a quantitative estimate of the quantities of neutral and weakly ionized gas in the MB and in the ionized high-velocity cloud HVC (Lehner, Keenan, & Sembach, 2001).
2 Observations and Data Processing
We obtained FUSE spectra of two early-type stars, DI 1388 (, ) and DGIK 975 (, ), in the MB on 2001 August 15 and August 24, respectively. A summary of their stellar properties and location is given in Table 1. The data are cataloged in the MAST archive under the identifications P2410101 and P2410201. Total exposure times of 17,460 seconds for DI 1388 and 23,520 seconds for DGIK 975 were obtained. All the data were obtained in time-tag mode through the aperture.
The FUSE instrument consists of four channels: two optimized for the short wavelengths (SiC 1 and SiC 2; 905–1100 Å) and two optimized for longer wavelengths (LiF 1 and LiF 2; 1000–1187 Å). There is, however, overlap between the different channels, and, generally, an atomic or a molecular transition appears in at least two different channels. More complete descriptions of the design and performance of the FUSE spectrograph are given by Moos et al. (2000) and Sahnow et al. (2000), respectively. To maintain optimal spectral resolution and information on the fixed-pattern noise, the individual segments were not co-added together. For both sight lines, all the four channels were reasonably co-aligned throughout the observation, but for DGIK 975, detector 2 was shutdown for most of the observation resulting in the loss of SiC 2 and LiF 2 data (note as well that 3/14 exposures in SiC 1 were lost). Therefore only the LiF 1 channel is used in this work for the DGIK 975 sight line.
Standard processing with the current version of the calibration pipeline software (calfuse v2.0.5) was used to extract and calibrate the spectra. The software screened the data for valid photon events, removed burst events, corrected for geometrical distortions, spectral motions, satellite orbital motions, and detector background noise, and finally applied flux and wavelength calibrations. The extracted spectra associated with the separate exposures were aligned by cross-correlating the positions of strong interstellar lines, and then co-added. The co-added spectra were rebinned by 4 pixels ( mÅ) since the extracted data are oversampled. Scattered light and detector backgrounds are negligible at the flux levels of the absorption lines considered in this work. The spectra have a nominal spectral resolution of ( ; 2 pixels FWHM). For DI 1388, the spectra have a signal-to-noise (S/N) ratio in the continuum between 10 and 30 per resolution element; and for DGIK 975 between 7 and 12 per resolution element. In Tables 2 and 3, the S/N levels are given for each studied transitions and were determined by examining the dispersion about low-order polynomial fit to the continuum in the vicinity of the specified absorption lines. The relative wavelength calibration is accurate to about but can vary by 10–15 over small wavelength intervals. The zero point of the wavelength scale was set by comparing absorption at FUSE wavelengths to longer UV or optical wavelengths. The MB component is present at toward DI 1388, and at toward DGIK 975.
We illustrate in Figure 1 the reduced FUSE spectra of DI 1388 for different detector segments. The data reveal numerous stellar and interstellar atomic and molecular absorption lines. Interstellar lines are identified when both the Galactic and MB components are present. The H I Lyman-series can be easily identified. Broader features are stellar lines. Because the FUSE bandpass is very rich in interstellar lines, a careful check was made to ensure that no other line was blended with the MB component. We note that while the airglow lines are relatively strong (see Figure 1, especially H I and O I), they do not affect the MB measurements as those lines are shifted by .
3 Analysis
The stellar continua were simple enough near the intersellar lines in the FUSE bandpass to be fitted with low-order () Legendre polynomials. A selection of normalized profiles is shown in Figures 2 and 3 for the DI 1388 and DGIK 975 sight lines, respectively. Species detected in the FUSE spectra in absorption are: (1) For DI 1388, C II, C III, N I, N II, N III, O I, O VI, P II, S III, Ar I, Fe II, Fe III, and H2. ; (2) For DGIK 975, C II, N I, N II, O I, O VI, Si II, Fe II, and Fe III. The absorption lines are stronger toward DGIK 975, and therefore more likely to be saturated. Moreover, the lower S/N of the DGIK 975 spectra hinders precise measurements toward this sight line and also limits the possibility of detecting weak features.
The equivalent widths were measured by directly integrating the intensity and are listed in Table 2 and 3. The equivalent width measurements and errors were derived following the method described by Sembach & Savage (1992).
To obtain the column density, two methods were used:
(1) The apparent optical depth (AOD) method (Savage & Sembach, 1991) was used when only one or two lines of the same atomic species were available. The absorption profiles were converted into apparent optical depths per unit velocity, , where , are the intensity without and with the absorption, respectively. is related to the apparent column densities per unit velocity, (cm-2 ()-1) through the relation . The integrated apparent column density is equivalent to the true integrated column density if no unresolved saturated structure is present. The results are summarized in Tables 2 (DI 1388) and 3 (DGIK 975). The results for the O VI absorption profile and other highly ionized species are discussed in § 4.3 (DI 1388) and § 5 (DGIK 975).
(2) A curve-of-growth (COG) analysis was undertaken when several lines were present (N I, O I, Fe II and H2 toward DI 1388) by using measured equivalent widths. Additional lines for the atomic species were used from the measurements in the HST/STIS spectra (see, Lehner et al., 2001). A single component Gaussian (Maxwellian) curve of growth was constructed in which the Doppler parameter and the column density were varied to minimize the between the observed equivalent widths and a model curve of growth. For DI 1388, the results are summarized in Figures 4 (atomic species) and 5 (H2). For H2, a COG was constructed for the lines within each rotational level (; no detectable absorption is present in levels ), and this resulted in the COG presented in Figure 5, describing simultaneously all the rotational levels with a Doppler parameter of . The level is poorly constrained as only two transitions were available.
Good agreement is found between the AOD and COG methods for Fe II, principally because the transitions for this ion are not saturated. The transitions of the neutral species lie near or on the knee of the COG where saturation effects arise. The -values are comparable to the total -values obtained by Lehner et al. (2001) with the higher spectral resolution of the HST/STIS data using a profile fitting method; in particular, the same pattern is observed, i.e. a smaller -value for N I compared to O I and Fe II, but a similar -value for O I and Fe II. For DGIK 975, the Fe II column density derived with the COG method is in the range given by the AOD method, but because the lines are much stronger, the S/N is low, and only four transitions are available, the -value is not constrained. Optical Ca II K spectra of DGIK 975 with similar quality to those described in Lehner et al. (2001) toward DI 1388 (spectral resolution of about 7.1 ) do not show any evidence of multiple component structure. However, Ca II K cannot a priori be used to model Fe II component structure in diffuse clouds, as it traces mainly cold neutral clouds, while Fe II can be found in both neutral and ionized clouds.111D.E. Welty (private communication, 2002) has noted, however, that comparisons of high spectral resolution profiles for Ca II and Fe II can show surprising similarity in many cases. Note as well that finer structure seen in higher resolution spectra of Galactic HVCs (e.g., Lehner et al., 1999) suggests that the true component structure in the MB gas toward both sight lines may be more complex than is revealed by 6.5 or lower spectral resolution.
Since we have information on N I and N II toward DI 1388, it is interesting to estimate the amount of interstellar N III. N III 989.799 is severely blended with Si II 989.873. Using the equivalent measurements available in the STIS bandpass for Si II (Lehner et al., 2001), we constructed a COG and estimated the equivalent width for Si II 989.873 as being 105 mÅ. Knowing the total equivalent width of this feature and assuming that neither lines suffer from saturation effect, we infer that the N III absorption feature has an equivalent width of 31 mÅ, and with the assumption that it lies on the linear part of the COG, its column density is 13.5 dex.
The upper limits for the equivalent widths in Table 2 are defined as , where is the inverse of continuum S/N ratio and Å, which is approximately the average FWHM obtained from the resolved features. The corresponding upper limits on the column density are obtained from the corresponding equivalent width limits and the assumption of a linear curve of growth.
We adopted wavelengths and oscillator strengths from the Morton (2000, private communication) atomic data compilation. This compilation is similar to the Morton (1991) compilation with a few minor updates to the atomic parameters for lines of interest in this study. For the Fe II lines, the new oscillator strengths derived by Howk et al. (2000) were adopted. We note that there is a new laboratory measurement of the -value for Fe II 1144.9 (, Wiese, Bonvallet, & Lawler, 2002), about 30% lower than the experimental value of Howk et al. (2000). We note, however, that the value of Howk et al. gives a column density in good agreement with the measurement from the Fe II 1608.4 line. Moreover, Wiese, Bonvallet, & Lawler (2002) note that additional study is necessary for the other transitions available in the FUSE bandpass, rather than a simple rescaling, as they are further down on the COG than the Fe II 1144.9 line. As we use all the transitions available in FUSE spectrum, we employ the -value of Howk et al. (2000) and we note that even if -values are lower, the column density would only change by about dex, and our conclusions would remain the same. The H2 wavelengths are from Abgrall et al. (1993a, b), while the H2 -values were calculated from the emission probabilities given by those authors.
4 Magellanic Bridge gas toward DI 1388
4.1 Molecular hydrogen
Until recently, searches for molecular gas in the MB were restricted to observations of CO (Smoker et al., 2000), but none was found, mainly due to a lack of sensitivity. The most abundant molecule in the Universe, molecular hydrogen (H2) has only been recently accessible with the launch of FUSE for faint targets observed in the MB. FUSE observations reveal that 92% and 52% of the SMC and LMC sources, respectively, exhibit H2 absorption lines (Tumlinson et al., 2002). Two observations toward the Magellanic Stream also reveal H2 (Sembach et al., 2001; Richter et al., 2001). While the S/N is too low in the spectrum of DGIK 975 to allow any conclusions, the spectrum of DI 1388 exhibits about 30 absorption lines from the Lyman and Werner bands of H2 (see Table 2). In all known environments in our Galaxy, star formation occurs within molecular clouds. The detection of H2 toward DI 1388 is therefore the first direct evidence of a possible star formation signature in the very poor metal environment of the MB.
From Table 2 and Figure 5, the total column density of H2 is dex. For , dex. The H I column density is not well known (Lehner et al., 2001): the H I emission column density is 20.50 dex (Putman 2000, private communication; see Lehner et al. 2001a). In theory, the FUSE observations could help to constrain the H I absorption column density because numerous H I lines of the Lyman series with different oscillator strengths are accessible. Moreover, at Å, the MB component can be separated from the lower velocity components. But as displayed in Figure 1, the continuum position is uncertain at these wavelengths. The stellar contribution is also not known due to the difficulty to model this star because its large . Therefore, the H I absorption column density cannot be directly derived. An alternative is to use the O I column density. O I is an excellent tracer of neutral gas as its ionization potential and charge exchange reactions with hydrogen ensure that the ionization of H I and O I are strongly coupled. Using the O I column density, and assuming the interstellar O abundance222Meyer et al.’s value () was corrected for the recommended oscillator strength of O I 1356 ( instead of ) by Welty et al. (1999b). found by Meyer et al. (1998) , and a general deficiency in metal of the MB gas of dex from the stellar study (Rolleston et al., 1999), we obtain (H I dex. The difference could be due to the large beam of the H I emission data and to the position (in depth along the sight line) of DI 1388 in the MB.
Using the H I value derived from O I, the fractional abundance of H2 is (H I, while the H I emission column density suggests . This value is comparable to those seen along Galactic sight lines (Savage et al., 1977) and Magellanic Clouds sight lines (Tumlinson et al., 2002) when E and (H I dex. However, Tumlinson et al. (2002) noted that a major difference between the Galactic and Magellanic Clouds samples is the presence of several sight lines with when E. We also note that for similar H2 column densities in the SMC and LMC, molecular fractions similar to that derived here are observed. For the MB, and in some cases for the SMC and LMC (see Figure 12 in the Appendix), remains uncertain due to H I column density uncertainties.
The population of the lower rotational states of molecular hydrogen is determined by collisional excitation with a Boltzmann distribution, so that the excitation temperature is given by (e.g., Spitzer, Cochran, & Hirshfeld, 1974)
| (1) |
We find that K and K. In Figure 6, the excitation temperature diagram is presented for H2 arising in ground-state rotational levels . The interpretation of this diagram is complicated by the large uncertainty in the column density of the level. In their survey in the Galaxy, Spitzer, Cochran, & Hirshfeld (1974) found that when cm-2, a single excitation temperature generally fits all the observed within their estimated errors. Toward DI 1388 cm-2, but we believe that the estimated error of this level is conservative and therefore a single temperature does not describe the distribution of the data points within the error bars. In the Appendix, we show by using the LMC and SMC sample that for low H2 column density, a single excitation temperature does not generally fit the distribution of the data points, as observed in the MB, when cm-2.
The temperature, though uncertain, is in general agreement with what is derived in diffuse molecular clouds in the Magellanic Clouds ( K for all their sight lines; Tumlinson et al., 2002), the Galactic halo ( K; Shull et al., 2000), and in the Galactic disk ( K; Savage et al., 1977). The absolute value of suggests a closer similarity to the Clouds and the Galactic halo than the Galactic disk, yet the large error on prevents us from drawing definitive conclusion. While may trace directly the kinetic temperature in dense molecular clouds, in low column diffuse clouds the relationship between the excitation temperature of the first two levels and the kinetic temperature is not well understood (e.g.; Tumlinson et al., 2002).
4.2 Neutral and partially ionized gas
Lehner et al. (2001) found two MB interstellar clouds toward DI 1388 at 179 and 198 with the 6.5 spectral resolution of the HST/STIS. The 198 cloud is mainly neutral with a hot component (see § 4.3); while the 179 cloud is warmer, low density gas, and partially ionized. The FUSE bandpass gives access to a large number of ions not accessible with STIS, though at lower resolution, which complicates the interpretation of the data. In particular the separation between the two clouds is about the resolution of FUSE and therefore theses clouds cannot be resolved with FUSE. However, some properties of this sight line can still be derived, since for the neutral and singly ionized species we know from Lehner et al. (2001) that the mainly neutral gas at 198 is about 2–3 times stronger in column density than the ionized cloud at 179 .
The detection of H2 at 200 suggests that it is associated with the neutral cloud observed in the atomic and ionic species. While the excitation temperature is relatively low, it is not known how it is related to the kinetic temperature in diffuse clouds. However, the -value obtained from the COG analysis for H2 gives an upper limit to the kinetic temperature of K. We note that both the COG and profile fitting analysis give a lower -value for N I compared to O I, suggesting that the mostly neutral cloud is probably composed of more than one cloud. This is also supported by the fact that the profile fitting to O I 1302 indicates that some unresolved structures remain (see Figure 2 in Lehner et al., 2001).
For the MB gas we find, when considering the total column density, Fe IIFe III, S IIS III. Sembach et al. (2000) have produced models of low density photoionized gas, and these ratios compare with a combination of their composite and “” models. Such models typically simulate regions with significant fraction of neutral hydrogen or ionized interfaces of neutral clouds. Considering only the ionized component for S II and Fe II (see, Lehner et al., 2001) and assuming that S III and Fe III is mostly present in the ionized gas, the ratios are Fe IIFe III, S IIS III. In this situation, the S II/S III ratio is comparable to a low density H II region with a ionization parameter ( for typical bright high density H II regions, Sembach et al., 2000) and “” (i.e. fully ionized material); while Fe II/Fe III is, for a low density H II region, a combination of “” and “” with . Because the ionization potential of Fe III is 16.18 eV smaller than the ionization potential of S III, 23.33 eV, this suggests that a fraction of Fe III could remain in the neutral gas, while S III is mostly in the ionized cloud. We note that the Sembach et al.’s models were simulated with Galactic abundances. Metallicity effects should be negligible on ionization fractions, as long as the relative abundances are similar (see § 4.4).
The determination that N IN II shows that N has a deficiency of its neutral form. Because Ar (and N) is not significantly depleted onto dust grain (Sofia & Jenkins, 1998), the large deficiency of Ar I in the MB (see Table 7) is certainly due to photoionization. Ar is more easily photoionized than H because its photoionization cross section is about 10 times that of H. N I has a photoionization cross section larger than that of H I and a charge-exchange rate coefficient for N II with H I only twice the recombination coefficient, so that N may show a deficiency of its neutral form, similar to what is observed for Ar (Jenkins et al., 2000a). We note also that N II is the dominant ion along this sight line as N IIIN II. Because the -values for N I and H2 are similar, it could be that N I, H2, and the remaining Ar I are in the colder part of the cloud, while some of O I is partly in the cold part but as well in another mostly neutral layer of gas, where sufficiently energetic photons have ionized N and Ar (assuming the different layers/clouds are spatially related).
4.3 Highly ionized species
Lehner et al. (2001) found Si IV and C IV interstellar absorptions in the spectrum of DI 1388. O VI is the most important ion for the study of hot gas and in particular the ratio of C IV/O VI is an important key to differentiate between different theoretical models. O VI is difficult to produce through photoionization, since it requires photons with energy greater than 114 eV, and is therefore most likely collisionally ionized. It peaks in abundance at K, compared to K, K, and K for N V, C IV, and Si IV, respectively. O VI is either produced via cooling from higher temperatures or from heating. Several models have been proposed to account for O VI in the ISM, including shock heating, conductive heating, radiative cooling, and turbulent mixing layers (TMLs) (Shull & McKee, 1979; Borkowski, Balbus, & Fristrom, 1990; Slavin, Shull, & Begelman, 1993; Spitzer, 1996, and references therein for a summary). These models make different predictions for the various ratios of the highly ionized species, in particular, for convective heating C IVO VI, for radiative cooling, C IVO VI, and for TMLs, C IVO VI (Spitzer, 1996; Sembach et al., 2001, and references therein).
As seen in Figure 10, the O VI absorption profile toward the DI 1388 sight line is strong for the Galactic gas between and 50 and becomes weaker at positive velocity up to 250 . There is therefore no clear separation between the Galactic disk/halo and MB components. We note also that some of the observed O VI absorption could have a stellar-wind origin (Lehner et al., 2001c), yet the interstellar O VI origin seems more plausible as wind features typically have full-width larger than few hundreds . Moreover, O VI absorption profiles toward the Magellanic Clouds are generally very broad with the Galactic and LMC/SMC components being blended (Howk et al., 2002a; Hoopes et al., 2002). In Figure 7, we compare the absorption profiles of the highly ionized species observed in the FUSE (O VI) and STIS (C IV and Si IV, see also Lehner et al., 2001) bandpass. The local component ( ) is strong and well defined for all the highly ionized species. But at higher positive velocities, C IV and Si IV have a strong absorption MB component ( ) while O VI is relatively weak, whereas at velocities , the O VI profile becomes deeper. The difference in the profiles of C IV and Si IV with respect to O VI at 200 could be due to that some of the C IV and Si IV originated from photoionization.
As O VI, C IV, and Si IV are usually related, in view of the broad extent of the O VI profile, we decided to redo the analysis of C IV and Si IV by considering different possible continua. This is shown in Figure 7, where the deep Gaussian and polynomial continua fit a stellar line that goes to the bottom of the absorption profiles. Shallower stellar profiles also seem possible to allow the interstellar C IV and Si IV to be present at all velocities as observed for O VI. The resulting column density measurements are summarized in Table 4 for different velocity intervals.333Lehner et al. (2001) used only a Gaussian fitting method but they also allow possible renormalization of the profiles. For Si IV we find similar results, while C IV is slightly lower, though in agreement within the uncertainties. However, their main result was from the direct comparison of apparent column density profiles of C IV and Si IV. Their derived C IVSi IV) ratio gives a similar C IV column density, assuming their Si IV column density. The errors presented in this Table were obtained following the method outlined by Sembach & Savage (1992). The differences between the various measurements reflect systematic differences that result from various choices for the wavelength intervals or methods defining the (unknown) location of the true continuum. Note that the C IV 1548 is at the edge of the échelle order and only the MB component could be (partially) retrieved; column densities for the C IV doublet are in good agreement. The Si IV doublet gives very similar results. However, saturation effects are difficult to estimate due the uncertainty in the continuum placements.
In Table 5, we present the adopted column densities and column density ratios of the highly ionized species. For C IV and Si IV and for all the column density ratios, the error bars indicate the range of possible values rather than a 1 uncertainty, yet the upper error could be larger if the stellar line is even shallower. We did not take into account the high continuum for C IV 1550 in these adopted results, but this does not change the main conclusions (see below).
The TML model best reproduces the observed ratios of C IV to O VI and Si IV for the main MB component between 155 and 245 . If C IV and Si IV column densities are underestimated, the agreement with the TML model would be strengthened, since it requires C IVO VI. The different gas phases observed at close or indistinguishable velocities also give some evidence for such a model because cold gas, partially ionized gas and hot gas phases are encountered along this sight line (see Figure 1 in Slavin, Shull, & Begelman, 1993). These models usually assume solar abundances or Galactic depletion and it would be interesting to investigate in more details the effect of low metallicity as observed in the MB. We note, however, that neither the stellar abundances from a few early-type stars (Rolleston et al., 1999) nor the relative ISM abundances along this sight line show any anomalies in the relative abundance of the metals. For lower MB velocities (100–155 ), the ratios are very uncertain due to the continuum placement, but suggest a combination of TML and conductive interfaces. The HVC component is very uncertain (see § 6). The ratios of highly ionized species for the strong local component is in agreement to what is found in the Galactic disk and halo; and the radiatively cooling fountain provides a reasonable description of the observed ratios toward DI 1388 (see, Sembach, Savage, & Hurwitz, 1999; Spitzer, 1996, and references therein).
The amount of H II can be roughly estimated along this sight line from the O VI measurement via H IIO VI. Assuming an O VI ionization fraction (Tripp & Savage, 2000), a present-day metallicity (Rolleston et al., 1999), and a Galactic interstellar abundance (see § 4.1), H II dex in the range and H II dex in the range , implying that neutral gas dominates along this sight line.
4.4 Depletion of the gas
In the Galactic interstellar gas, the underabundances of elements along various sight lines are usually attributed to the depletion of these elements into dust. The nucleosynthetic history of the gas can also play a role, especially in a low metallicity and tidally disrupted gas. Yet, toward DI 1388, Lehner et al. (2001) showed that the principal factor for deficiency of heavy elements is certainly depletion onto dust grains. Here, we combine FUSE and STIS results to develop more insight into the depletion and possible ionization correction. Since S II is only modestly depleted in the Galactic ISM, we used it as the reference ion. We compared the elements using the logarithmic normalized gas-phase abundance,
| (2) |
where is the ion under consideration, and is the ratio for cosmic abundances and is used for . Equation 2 assumes that the ion is the dominant form of element . Since S IIS III, S II is the dominant form of S. Figure 8 (see also Table 7) shows the comparison in abundance pattern between the different Galactic environments and the results for the MB toward DI 1388, with both the FUSE and STIS data. The O I column density is now better constrained compared to the study of Lehner et al. (2001), and the differences observed with the Galactic environment could be mainly due to some ionization effect. Similarly, N I is still very deficient; yet taking into account the ionized component (N II and N III), the depletion of N ( dex) is roughly similar to the Galactic environment. The tentative measurement of P II (at worst it should be an upper limit) also suggests a halo-like depletion for the MB. Therefore, it seems that the dominant factor describing the MB gas-phase abundance pattern toward DI 1388 appears to be primary depletion of the elements into dust and secondary ionization for neutral species (O I, N I, and Ar I) rather than nucleosynthetic history, and the depletion pattern follows the pattern seen in the Galactic halo.
5 DGIK 975 sight line and comparison with DI 1388 sight line
5.1 Weakly ionized species
The data toward DGIK 975 are much less reliable, yet several species were detected: C II, N I, N II, O I, O VI, Si II, Fe II, and Fe III. This list hints that as for the DI 1388 sight line, this sight line has different gas phases, with species dominant in neutral gas (N I, O I), some signatures of weakly ionized gas (N II, Fe III) or highly ionized gas (O VI). Comparisons of the profile in Figure 3 suggest that, as toward DI 1388, several clouds are present along the sight line because N I is mainly observed at 170 , while for the other species, at lower velocities, one or several clouds are suggested.
The Fe II column densities are consistent with each other within the errors. However, the data have low S/N levels, a resolution of 20 and the lines are very strong, which might suggest some saturation effect.
5.2 Highly ionized species
HST/STIS observations were obtained toward DGIK 975 (in the same program as the observations of DI 1388) but the data were of too low S/N ratio ( for most of the échelle orders) for a detailed analysis (Lehner, 2000). However, since strong O VI absorption is observed, it is interesting to try to estimate the amount of C IV and Si IV along this sight line. C IV and Si IV are much broader than the neutral or weakly ionized species, and we can therefore rebin the STIS E140M data by 3 to about the FUSE spectral resolution in order to improve the S/N without losing too much information. Once rebinned, the HST data typically have a S/N of about 10–12. In Figure 9, we present the different absorption profiles for O VI, C IV, and Si IV with the chosen continua. Result of measurements is presented in Table 6. We assumed that there is no contribution from the stellar photosphere. However, the projected rotational velocity ( ) is relatively low and the radial velocity is so that some of the stellar and interstellar lines could be blended. In this case, the C IVO VI) and Si IVO VI) ratio presented in Table 6 should be considered as an upper limit.
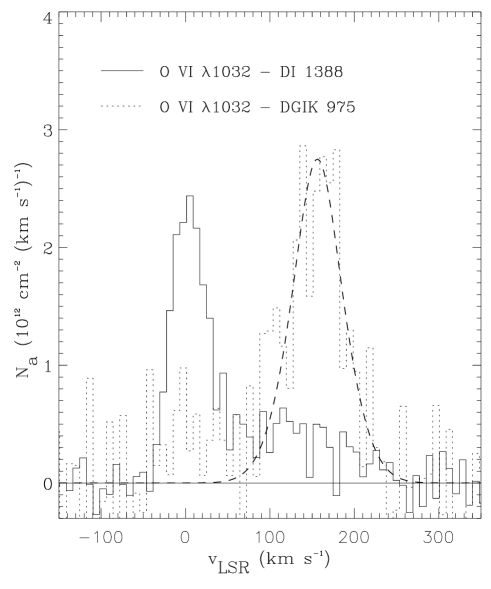
In Figure 11, the O VI apparent column density profiles for DI 1388 and DGIK 975 are compared. Toward DI 1388 there is no clear separation between MB and Galactic disk-halo gas. The dashed line in Figure 11 shows a Gaussian fit to the profile of O VI toward DGIK 975 with FWHM of , implying a temperature of about K if the width of the line is due to thermal broadening alone. For C IV and Si IV, the Gaussian FWHMs are and , respectively, corresponding to a temperature of K. In collisional ionization equilibrium the O VI, C IV, and Si IV peak in abundance at lower temperatures (see § 4.3), so if most of the gas is at this temperature, either large turbulent (non-thermal) motions or multiple components are required to explain these line broadenings. Because the column density is weaker toward DI 1388, we can not fit reliably the O VI line, but its large extent also suggests a large temperature. For C IV and Si IV, the continuum placement is uncertain but suggest a temperature K. Both the LMC and SMC surveys of O VI absorption showed similar broad lines (Howk et al., 2002a; Hoopes et al., 2002).
While the amount O VI can not be directly compared in the MB because the location in depth of the stars is unknown, C IVSi IV) is similar for both sight lines, but C IVO VI) (and Si IVO VI)) is disparate. This holds even if there is stellar contamination, since toward DI 1388 the C IVO VI) and Si IVO VI) ratios would be lower limits, while toward DGIK 975, they would be upper limits. This suggests variation of the O VI column density across the MB. In contrast, even if the Galactic component of hot gas varies by a factor 2.4 between these sightlines (confirming the recent results of Howk et al., 2002b), the ratio of the highly ionized species agrees roughly within the uncertainties, suggesting that similar mechanisms for the production of highly ionized ions occur toward both sight lines in the Galactic gas.
Comparing with the theoretical models (see § 4.3) toward DGIK 975, a radiatively cooling flow or a combination in the right proportion of TMLs and conductive interface describes the derived ratios reasonably well for the MB component.
6 The High-Velocity Cloud HVC
Using the ultraviolet STIS spectrum of DI 1388, Lehner, Keenan, & Sembach (2001) detected an HVC at , as well as two very low-column HVCs at and +130 . The O I and N I deficiencies with respect to C II and the presence of ionized elements (S III and Si III) indicated that HVC consists of a warm, mainly ionized medium at high Galactic latitude.
In the FUSE bandpass, this HVC is detected in absorption via N II and O VI, and their normalized profiles are shown in Figure 10. No Fe III is detected but this is not surprising as the Fe III stellar line is strong and the interstellar HVC component is lost in it. The apparent column density of N II is dex, confirming that this HVC is largely ionized (N I dex, Lehner, Keenan, & Sembach, 2001). No N III is detected, and we estimated a 3 upper limit of dex.
As discussed in § 4.3, there is no clear separation between the different components in the O VI absorption profile (see Figures 10 and 11). We used N II to determine the velocity range (70–100 ) over which the O VI intensity profile is integrated. In Table 5, we summarize this measurement along with the results on C IV and Si IV. The latter remains uncertain due to continuum placement (see § 4.3). The C IV/O VI ratio is in agreement with values found in the Galactic disk and near the low end value for the Galactic halo (Spitzer, 1996). Zsargó et al. (2002) presented a more recent survey in the low Galactic halo, where they found C IVO VI) for most sight lines with Galactic height kpc.
The high ion ratios are consistent with the expectations of a radiatively cooling gas in a fountain flow (Spitzer, 1996; Sembach, Savage, & Hurwitz, 1999). In a such model hot gas is produced by the cumulative effects of supernovae in the Galactic disk. It provides an explanation for the origin of HVCs in the low Galactic halo with positive velocity (Wakker & van Woerden, 1997, and references therein), such as HVC . The location of the HVC in the lower part of the halo also provides an explanation of why the gas is mainly ionized, since a sufficient number of photons could leak out of the Galactic disk to cause its ionization. Alternative scenarios are possible but would require the combination of conductive interfaces and turbulent mixing layers.
We note also a tentative detection of an HVC at toward DGIK 975 in the high ions (see Fig. 9). The S/N levels are too low to make any measurements but would confirm that such highly ionized clouds are common.
7 Discussion
7.1 Molecules and star formation in the Magellanic Bridge
Demers & Battinelli (1998) found using deep CCD photometry that the stars in form of stellar clusters in the MB were formed some 10 to 25 Myr ago. Spectroscopic studies of some of these stars confirm that they are massive young stars but with a metallicity (Rolleston et al., 1999), a factor 3 lower than the present day metallicity of the SMC. Their location in the MB also rejects the idea that these stars could be runaway stars from the SMC since they could not travel such large distances over their short life-times. It is generally accepted that the MB was most likely pulled from the wing of the SMC some 200 Myr ago, during a close encounter between the two Clouds, whereas the Magellanic Stream was created by a SMC-LMC-Galaxy close encounter Gyr ago (Gardiner & Noguchi, 1996). Searches for stars in the Stream have, however, produced largely negative results (see Irwin, Demers, & Kunkel, 1990, and references therein). Interstellar study toward two sight lines in the Stream indicates an abundance similar to the abundance in the SMC, (Lu et al., 1998; Sembach et al., 2001; Gibson et al., 2000). Yet, because the present-day MB abundance is a factor 3 lower than the present day metallicity of the SMC, Rolleston et al. (1999) postulated that the MB was formed either much earlier (8.5 Gyr ago) from more primordial gas, or some 0.2 Gyr ago from a mixture of SMC gas and an unenriched (primordial) component. Toward both the Magellanic Stream and Bridge, molecules were found, yet because star formation occurs in the MB and not in the Stream, the physical conditions must be different. Even though young stellar clusters exist in the MB (Demers & Battinelli, 1998), their formation is not very efficient and only happens in recent times, since the MB gas is poor in metals. Christodoulou, Tohline, & Keenan (1997) suggested that the MB was formed earlier than the Stream, in order to explain why star formation occurs only in the MB. In such a scenario, the low metallicity is explained by the tidal stripping of gas from SMC in its earlier chemical evolution, and stars form late, only after tidally induced cloud mergers have had a chance to occur in substantial numbers, and to produce some massive clouds. Such scenario is supported by some recent H I Parkes All Sky Survey (HIPASS) data of the entire Magellanic Stream which indicate dual filaments that are likely to be relics from gas stripped from the SMC and the MB (Putman et al., 2002). These observations imply that at least some part of the Stream could be younger than the MB, and that the MB could be older than usually assumed (see, Putman et al., 2002). Pairing of galaxies are very common (Barnes & Hernquist, 1992), and the SMC and LMC could have been paired since the beginning of their existence, and therefore some part of the MB, if not all, could be much older than previously thought.
The discovery of molecular hydrogen in the MB implies that it is formed in situ and/or was tidally stripped from the SMC. Formation of H2 is thought to occur on interstellar dust grains when hydrogen atoms are adsorbed onto the grain surface and react. An hydrogen molecule is then ejected in the gas phase (e.g., Hollenbach, Werner, & Salpeter, 1971). Therefore the formation mechanism is related to the quantity, type of grains, gas density, and metallicity. Dissocation of H2 depends on the intensity of the ultraviolet radiation field, the presence of hot gas, and the possible effect of shocks. Grains serve as catalysts for the formation of H2 but also as shields against the ultraviolet radiation. Tumlinson et al. (2002) found that for the LMC and SMC low metallicity gas differences in the formation and destruction balance of H2: grain formation rates about 1/3 to 1/10 of the Galactic value and ultraviolet radiation field 10 to 100 times the Galactic mean value. The H2 formation can be written as (e.g., Shull & Beckwith, 1982), where is the formation rate coefficient, ( cm3 s-1 for Galactic conditions, cm3 s-1 for LMC, SMC conditions) and the hydrogen column density. Assuming LMC, SMC conditions for the MB, Gyr. Along the DI 1388 sight line, cannot be high enough to lower to the believed 200 Myr year old of the MB, and therefore from those assumptions most of the observed H2 has survived the tidal stripping; unless if the MB is much older.
Alternatively, H2 could have (partially) formed in small compact and dense cloudlets within the MB. Formation of clusters of massive stars occurs in the MB (Rolleston et al., 1999; Demers & Battinelli, 1998, and references therein), and if the formation processes are similar to that observed in the Galaxy, this requires very high density clouds and cloud-cloud collisions (Scoville, Sanders, & Clemens, 1986; Evans, 1999). In this picture H2 can form rapidly in dense regions and disperse in more diffuse clouds. Therefore the observed diffuse molecular clouds along the DI 1388 sight line could trace or be the remnant of denser molecular clouds, the latter being the place where star formation occurred. The detection of cold H I cloud with spin temperatures between 20 and 50 K in the MB by Kobulnicky & Dickey (1999) also supports the idea that some regions must be at high densities ( cm-3). The pressure in the MB must be low on average, yet tidal interactions between the SMC and LMC could have created strong enough perturbations in the overall low density MB gas to produce high density peaks, conditions not existing in the Stream because possibly the interaction in the MB involves closer galaxies and/or is over a longer time.
7.2 N/O ratio in the Magellanic Bridge
The nucleosynthetic origin of N has been subject of large debate, but its understanding is fundamental for comprehending the chemical evolution of galaxies (Vila-Costa & Edmunds, 1993; Henry & Worthey, 1999). Nitrogen is mainly produced in the six steps of the CN branch of the CNO bi-cycle within H burning stellar zones, where 12C serves as a catalyst. First generation stars produce their own C during the He burning phase, and N production must be fairly independent of the initial composition of the star of which it is synthesized, and the synthesis is said primary. Beyond the first generation of stars, the gas from which these stars formed is already polluted with C and O. The amount of N in this material will be proportional of its C abundance, and the N synthesis is said to be secondary in this case. Thus, primary nitrogen is independent of the metalliticity, and secondary nitrogen increases with increasing metallicity. Most measurements of N/O in our Galaxy and nearby Galaxies are made in stars and H II regions and only few direct measurements in the gas are available in absorption, and therefore our measurement in the MB is particularly notable.
Toward DI 1388, the MB N/O ratio is (from N I and O I column densities), i.e. near a solar value. Lehner et al. (2001) suggested that N might be deficient in the MB, however, they also noted that this could be mainly due to photoionization effect. The FUSE data allow us to have precise measurements of N I and O I but also give access to ionized N via N II and N III. If N I is preferentially ionized with respect to O I, would be solar or even above solar. The N/O ratio in the gas is in agreement with the results on the photospheric abundances of the B-type stars analysis where (from a differential abundance analysis, Rolleston et al., 1999). In contrast, in both the LMC and SMC, N in the H II regions is systematically underabundant by a factor 4–6 compared to the main sequence B-type stars (see, Garnett, 1999). An analysis of the FUSE data using absorption lines could help to constrain N/O in the ISM of the LMC and SMC, and therefore help to comprehend these differences.
Henry, Edmunds, & Köppen (2000) compiled a survey of Galactic and extragalactic H II regions and stars to analyse the behavior of N/O as a function of O/H. They observe a plateau (though with some scatter) of N/O measurements when suggesting independence of N/O with metallicity, consistent with primary nitrogen formation; and when , a rise with a large scatter of N/O with metallicity is observed, more suggestive of secondary nitrogen formation. The MB metallicity ( dex for C, N, O, Mg, and Si in the photosphere of main sequence B-type stars, Rolleston et al., 1999) is at this apparent boundary. Henry, Edmunds, & Köppen (2000) found, at the MB metallicity, N/O lower by a factor 3 to 10 compared to the MB. Yet, the typical error bars for these measurements are large, typically dex for and dex for , and within the error bars few measurements of N/O in H II regions could have a solar value for a MB metallicity. In the damped Ly systems, at MB metallicity (or slighly higher or much lower than the MB metallicity), N/O is always at least a factor 3 lower than solar (Prochaska et al., 2002; Lu, Sargent, & Barlow, 1998).
From both the studies of the gas and the massive stars, N/O is much higher in the MB than N/O values in the damped Ly systems, implying that N in the MB is more secondary than primary. Most of nitrogen is formed in intermediate mass-stars (1–8 M⊙) with roughly a charateristic lag time of 250 Myr (Henry, Edmunds, & Köppen, 2000). If the MB is 200 Myr old (see § 7.1), most of the nitrogen must have come from an N-enriched region of the SMC. Henry, Edmunds, & Köppen (2000) argue that since the distribution of N/O at a single O/H value appears to be clustered toward low N/O values, the high values of N/O might be due to nitrogen enrichment by Wolf-Rayet stars or luminous blue variables.
8 Summary
We have presented FUSE observations of two early-type stars (DI 1388 and DGIK 975) in the low density and low metallicity gas of the MB. DI 1388 is situated near the SMC, while DGIK 975 lies near the LMC. Galactic ( ), HVC ( ), and MB (–200 ) components are observed in absorption. The FUSE spectra reveal that the MB gas shows a complex arrangement of gas in different phases, including the detection of molecules, neutral, weakly and highly ionized species as observed in the interstellar medium of the Galaxy.
Toward DI 1388, the FUSE observations provide detections of molecular hydrogen and O VI. Numerous transitions of the same species available in the FUSE bandpass allow us to derive precise column density for O I, N I, and Fe II. It gives also useful information on the amount of N II, N III, Ar I, P II, S III, and Fe III. Combining the previous STIS results (Lehner et al., 2001) with the present results show that the relative abundance pattern with respect to S in the MB along the DI 1388 sight line can be attributed to varying degrees of depletion onto dust similar to that in halo clouds, despite an overall metallicity much lower, and the depletion pattern follows the pattern observed in the Galactic halo. For N I (and Ar I) the deficiency can be explained by ionization effects, and the amount of N II is at least as large as the amount of N I.
The N/O ratio in the MB toward DI 1388 is near solar, in agreement with the abundance exhibited by early-type stars (see, Rolleston et al., 1999). This is a factor 3 or higher than the values of N/O in the damped Ly systems, implying subsequent stellar processing (possibly from Wolf-Rayet stars or luminous blue variables) to explain this high N/O ratio for an overall low metallicity.
The diffuse molecular cloud has a low column density ( dex), yet two excitation temperatures are needed to fit the distribution of the different rotational levels. We show that this is not uncommon in the Clouds (see Appendix). The low -value for H2 is similar to the value for N I, whereas O I and other species have larger -values, implying that several clouds are present along the DI 1388 sight line, including, cold and warm neutral clouds, a partially weakly ionized cloud, and highly ionized cloud.
Toward DGIK 975, the situation is less clear due to lower quality data and stronger lines (more subject to saturation effect). Yet the presence of neutral, weakly and highly ionized species suggest that this sight line has also several gas phases as observed toward DI 1388 or the interstellar gas in the Galaxy.
For the highly ionized species along the sight line to DGIK 975, for the MB component, very broad features of O VI, C IV, and Si IV are observed, indicating that either non-thermal motions are prevalent, or that multiple components of hot gas at different velocities are present. Toward DI 1388, the profile in O VI is extended, but where the O VI absorption is the weakest (main component of the neutral gas at 198 ) C IV and Si IV are the strongest (though some uncertainties remain due to continuum placement), which indicates that C IV and Si IV could have partially originated from photoionization. Similar large broadening were found in LMC and SMC (Howk et al., 2002a; Hoopes et al., 2002). Toward DI 1388, a high ratio of C IV/O VI () is found for the main component at 198 that could have originated in a turbulent mixing layer. Toward the SMC star Sk 108, a similar high ratio was found (Mallouris et al., 2001). When considering the more extended absorption profiles toward DI 1388 (in the range ) the C IV/O VI ratio is lower and more similar to the ratio toward DGIK 975. C IV/O VI varies within the MB but the C IV/Si IV is relatively constant (in comparison) for both sight lines. Several sources (a combination of turbulent mixing layer, conductive heating, and cooling flow) may cause the hot ionized gas in the MB.
H2 is observed in both the Magellanic Stream and the MB, yet the formation of massive stars occurs only in the MB, implying significantly different physical conditions between them. In the MB, some of the H2 could have been pulled out from the SMC via tidal interactions, but some also could have formed in situ in dense clouds where formation of molecules occurs faster. These dense clouds are possible sites of star formation.
Finally, this study has confirmed the results of Lehner, Keenan, & Sembach (2001) that the HVC at is mainly ionized, but high ions are also associated with it. The high ion ratios are consistent with a radiatively cooling gas in a fountain flow model. Such a model provides an explanation for the origin of HVCs in the low Galactic halo with positive velocity. Alternative scenarios would require a combination of conductive interfaces and turbulent mixing layers.
References
- Abgrall et al. (1993a) Abgrall, H., Roueff, E., Launay, F., Roncin, J. Y., & Subtil, J. L. 1993a, A&AS, 101, 273
- Abgrall et al. (1993b) Abgrall, H., Roueff, E., Launay, F., Roncin, J. Y., & Subtil, J. L. 1993b, A&AS, 101, 323
- Anders & Grevesse (1989) Anders, E., & Grevesse, N., 1989, Geochim. Cosmochim. Acta, 53, 197
- Barnes & Hernquist (1992) Barnes, J. E., & Hernquist, L. 1992, ARA&A, 30, 705
- Borkowski, Balbus, & Fristrom (1990) Borkowski, K. J., Balbus, S. A., & Fristrom, C. C. 1990, ApJ, 355, 501
- Christodoulou, Tohline, & Keenan (1997) Christodoulou, D. M., Tohline, J. E., & Keenan, F. P. 1997, ApJ, 468, 810
- Demers & Battinelli (1998) Demers, S., & Battinelli, P. 1998 AJ, 115, 154
- Evans (1999) Evans, N. J. II 1999, ARA&A, 37, 311
- Fitzpatrick (1996) Fitzpatrick, E. L. 1996, ApJ, 473, L55
- Grevesse & Noels (1993) Grevesse, N., & Noels, A. 1993, in Origin of the Elements, ed. N. Prantzos et al. (Cambridge: Cambridge Univ. Press), 15
- Gardiner & Noguchi (1996) Gardiner, L. T., & Noguchi, M. 1996, MNRAS, 278, 191
- Garnett (1999) Garnett, D. R. 1999, in IAU no. 190 New Views of the Magellanic Clouds, ed. Y.-H. Chu et al., p.266
- Gibson et al. (2000) Gibson, B. K., Giroux, M. L., Penton, S. V., Putman, M. E., Stocke, J. T., & Shull, J. M. 2000, AJ, 120, 1830
- Hambly et al. (1994) Hambly, N. C., Dufton, P. L., Keenan, F. P., Rolleston, W. R. J., Howarth, I. D., Irwin, M. J. 1994, A&A, 285, 716
- Henry & Worthey (1999) Henry, R. B. C., & Worthey, G. 1999 PASP, 111, 919
- Henry, Edmunds, & Köppen (2000) Henry, R. B. C., Edmunds, M. G., & Köppen, J. 2000 ApJ, 163, 165
- Hollenbach, Werner, & Salpeter (1971) Hollenbach, D. J., Werner, M. W., & Salpeter, E. E. 1971 ApJ, 163, 165
- Hoopes et al. (2002) Hoopes, C. G., Sembach, K. R., Howk, J. C., Savage, B. D., & Fullerton, A. W. 2002, ApJ, 569, 233
- Howk et al. (2000) Howk, J. C., Sembach, K. R., Roth, K. C., & Kruk, J. W. 2000, ApJ, 544, 867
- Howk et al. (2002b) Howk, J. C., Savage, B. D., Sembach, K. R., & Hoopes, C. G. 2002b, ApJ, in press
- Howk et al. (2002a) Howk, J. C., Sembach, K. R., Savage, B. D., Massa, D., Friedman, S. D., & Fullerton, A. W. 2002a, ApJ, 569, 214
- Irwin, Demers, & Kunkel (1990) Irwin, M. J., Demers, S., Kunkel, W. E. 1990, AJ, 99, 191
- Jenkins (1987) Jenkins, E. B. 1987, in Interstellar Processes, edd. D.J. Hollenbach & H.A. Thronson (Dordrecht: Reidel), 533
- Jenkins et al. (2000a) Jenkins, E. B., et al. 2000a, ApJ, 538, L81
- Jenkins et al. (2000b) Jenkins, E. B., Woz̀niak, P. R., Sofia, U. J., Sonneborn, G., & Tripp, T. M 2000b, ApJ, 538, 275
- Kobulnicky & Dickey (1999) Kobulnicky, H. A., & Dickey, J. M. 1999, AJ, 117, 908
- Korn and Wolf (1999) Korn, A. J., & Wolf, B. 1999, in IAU no. 190 New Views of the Magellanic Clouds, ed. Y.-H. Chu et al., p.241
- Lauroesch et al. (1996) Lauroesch, J. T., Truran, J. W., Welty, D. E., & York, D. G. 1996, PASP, 108, 641
- Lehner (2000) Lehner, N. 2000, PhD Thesis, The Queen’s University of Belfast
- Lehner et al. (2001c) Lehner, N., Fullerton, A. W., Sembach, K. R., Massa, D., Jenkins, E. B. 2001c, ApJ, 556, L103
- Lehner, Keenan, & Sembach (2001) Lehner, N., Keenan, F.P., & Sembach, K. R. 2001, MNRAS, 323, 904
- Lehner et al. (2001) Lehner, N., Sembach, K. R., Dufton, P. L., Rolleston, W. J. R., & Keenan, F. P. 2001, ApJ, 551, 781
- Lehner et al. (1999) Lehner, N., Sembach, K. R., Lambert, D. L., Ryans, R. S. I., & Keenan, F. P. 1999, A&A, 352, 257
- Lu, Sargent, & Barlow (1998) Lu, L., Sargent, W. L. W., & Barlow, T. A. 1998b, AJ, 115, 55
- Lu et al. (1998) Lu, L., Savage, B. D., Sembach, K. R., Wakker, B. P., Sargent, W. L. W., & Oosterloo, T. A. 1998, AJ, 115, 162
- Mallouris et al. (2001) Mallouris, C., et al. 2001 ApJ, 558, 133
- Meyer et al. (1998) Meyer, D. M., Jura, M., & Cardelli, J. A. 1998, ApJ, 493, 222
- Moos et al. (2000) Moos, H. W., et al. 2000, ApJ, 538, L1
- Morton (1991) Morton, D. C. 1991, ApJS, 77, 119
- Prochaska et al. (2002) Prochaska, J. X., Henry, R. B. C., O’Meara, J. M., Tytler, D., Wolfe, A. M., Kirkman, D., Lubin, D., & Suzuki, N., 2002 ApJ, submitted
- Putman (2000) Putman, M. E. 2000, PASA, 17, 1
- Putman et al. (2002) Putman, M. E., Staveley-Smith, L., Freeman, K. C., Gibson, B. K., & Barnes, D. G. 2002, ApJ, to be submitted
- Richter et al. (2001) Richter, P., Sembach, K.R., Wakker, B.P., & Savage, B.D. 2001, ApJ, 526, L181
- Rolleston et al. (1999) Rolleston, W. R. J., Dufton, P. L., McErlean, N. D., & Venn, K. A. 1999, A&A, 348, 728
- Russell and Dopita (1992) Russell, S. C., & Dopita, M. A. 1992, ApJ, 384, 508
- Sahnow et al. (2000) Sahnow, D. J., et al. 2000, ApJ, 538, L7
- Savage et al. (1977) Savage, B. D., Bohlin, R. C., Drake J. F., & Budich, W. 1977, ApJ, 216, 291
- Savage & Sembach (1991) Savage, B. D., & Sembach, K. R. 1991, ApJ, 379, 245
- Savage & Sembach (1996) Savage, B. D., & Sembach, K. R. 1996, ARA&A, 34, 279
- Savage et al. (2000) Savage, B. D. et al., 2000, ApJ, 538, L30
- Scoville, Sanders, & Clemens (1986) Scoville, N. Z., Sanders, D. B., & Clemens, D. P. 1986, ApJ, 310, L77
- Sembach et al. (2000) Sembach, K. R., Howk, J. C., Ryans, R. S. I., & Keenan, F. P. 2000, ApJ, 528, 310
- Sembach et al. (2001) Sembach, K .R., Howk, J. C., Savage, B. D., & Shull J. M. 2001, ApJ, 121, 992
- Sembach & Savage (1992) Sembach, K. R., & Savage, B. D. 1992, ApJS, 83, 147
- Sembach, Savage, & Hurwitz (1999) Sembach, K. R., & Savage, B. D., Hurwitz, M. 1999, ApJ, 524, 98
- Shull & Beckwith (1982) Shull, J. M., & Beckwith, S. 1979, ApJ, 227, 131
- Shull & McKee (1979) Shull, J. M., & McKee, C.F. 1979, ApJ, 227, 131
- Shull et al. (2000) Shull, J. M., et al. 2000, ApJ, 538, L73
- Slavin, Shull, & Begelman (1993) Slavin, J. D., Shull, J. M., & Begelman, M. C. 1993, ApJ, 407, 83
- Smoker et al. (2000) Smoker, J.V., Keenan, F.P., Polatidis, A., Mooney, C.J., Lehner, N., & Rolleston, W.R.J. 2000, A&A, 363, 451
- Sofia & Jenkins (1998) Sofia, U. J., & Jenkins, E. B. 1998, ApJ, 499, 951
- Spitzer (1996) Spitzer, L. 1996, ApJ, 458, L29
- Spitzer, Cochran, & Hirshfeld (1974) Spitzer, L., Cochran, W. D., & Hirshfeld, A. 1974, ApJS, 28, 373
- Sutherland & Dopita (1993) Sutherland, R. S., & Dopita, M. A. 1993, ApJS, 88, 253
- Tripp & Savage (2000) Tripp, T. M., & Savage, B. D. 2000, ApJ, 542, 42
- Tumlinson et al. (2002) Tumlinson, J., et al. 2002, ApJ, 566, 857
- Vila-Costa & Edmunds (1993) Vila-Costa, M. B., & Edmunds, M. G. 1993, MNRAS, 265, 199
- Wakker & van Woerden (1997) Wakker. B. P., & van Woerden, H., 1997, ARA&A, 35, 217
- Welty et al. (1997) Welty, D. E., Lauroesch, J. T., Blades, J. C., Hobbs, L. M., & York, D. G. 1997, ApJ, 489, 672
- Welty et al. (1999a) Welty, D. E., Frisch, P. C., Sonneborn, G., & York, D. G. 1999a, ApJ, 512, 636
- Welty et al. (1999b) Welty, D. E., Hobbs, L. M., Lauroesch, J. T., Morton, D. C., Spitzer, L., & York, D. G. 1999b, ApJS, 124, 465
- Wiese, Bonvallet, & Lawler (2002) Wiese, L. M., Bonvallet, G. A., & Lawler, J. E. 2002, ApJ, 569, 1032
- Zsargó et al. (2002) Zsargó, J., Sembach, K. R., Howk, J. C., & Savage, B. D. 2002, ApJ, in preparation
| Star | |||||||||
|---|---|---|---|---|---|---|---|---|---|
| (J2000) | (J2000) | kK | dex | ||||||
| DI 1388 | 02:57:11.94 | 72:52:54.61 | 14.39 | ||||||
| DGIK 975 | 04:19:58.63 | 73:52:25.80 | 15.05 |
| Species | a | a | S/Nb | Note | ||
|---|---|---|---|---|---|---|
| (Å) | (mÅ) | () | ||||
| C III | 977.020 | 24 | ||||
| N I | 953.655 | 9 | ||||
| 953.970 | 10 | |||||
| 954.104 | 9 | |||||
| 964.626 | 9 | |||||
| 1134.415 | 38 | |||||
| 1134.980 | 18 | |||||
| N II | 1083.994 | 12 | ||||
| N III | 989.799 | 7 | 1 | |||
| O I | 924.950 | 10 | ||||
| 929.517 | 13 | 2 | ||||
| 936.630 | 19 | |||||
| 948.686 | 9 | |||||
| 950.885 | 16 | 3 | ||||
| 1039.230 | 20 | |||||
| P II | 1152.818 | 19 | ||||
| S III | 1012.495 | 22 | ||||
| Ar I | 1048.220 | 30 | ||||
| 1066.660 | 23 | |||||
| Fe II | 1055.262 | 24 | ||||
| 1063.176 | 32 | |||||
| 1096.877 | 22 | |||||
| 1125.448 | 32 | |||||
| 1143.226 | 32 | |||||
| 1144.938 | 24 | |||||
| Fe III | 1122.524 | 24 | ||||
| H2 | ||||||
| 1–0 | 1092.195 | 17 | ||||
| 3–0 | 1062.882 | 16 | ||||
| H2 | ||||||
| 0–0 a | 1009.771 | 15 | ||||
| 0–0 | 1108.633 | 15 | ||||
| 1–0 | 1092.732 | 19 | ||||
| 2–0 | 1077.697 | 16 | ||||
| 3–0 | 1063.460 | 16 | ||||
| 4–0 | 1049.960 | 16 | ||||
| 7–0 | 1013.435 | 16 | ||||
| 8–0 | 1002.449 | 22 | ||||
| 1–0 | 1094.052 | 19 | ||||
| 2–0 | 1078.923 | 17 | ||||
| 3–0 | 1064.606 | 12 | ||||
| 4–0 | 1051.031 | 26 | ||||
| H2 | ||||||
| 0–0 | 1010.938 | 18 | ||||
| 1–0 | 1094.244 | 15 | ||||
| 4–0 | 1051.498 | 23 | ||||
| 8–0 | 1003.984 | 13 | ||||
| 10–0 | 983.589 | 12 | ||||
| 1–0 a | 986.241 | 11 | ||||
| H2 | ||||||
| 0–0 | 1014.504 | 16 | ||||
| 4–0 | 1056.472 | 25 | ||||
| 1–0 a | 987.445 | 12 | ||||
| H2 | ||||||
| 3–0 | 1070.899 | 20 |
Note. — Results are from Hambly et al. (1994) (DI 1388) and Rolleston et al. (1999) (DGIK 975) and references therein.
Note. — Uncertainties are errors. Upper limits indicate that no feature is present and are estimates. Lower limits indicate that the absorption line is saturated. Colons indicate that the value is uncertain. For atomic species, the column density is the direct integration of the apparent column density; while for H2, it results from a COG analysis. Note however that the adopted column densities for N I, O I, and Fe II result from a COG analysis, see Table 7 and § 3.
() Rest frame vacuum wavelengths and oscillator strengths are from Morton (private communication, 2000) for the atomic and ionic species, except for the -values of Fe II which are from Howk et al. (2000). The H2 wavelengths are from Abgrall et al. (1993a, b), while the H2 -values were calculated from the emission probabilities given by those authors. () Signal-to-noise level per spectral resolution.
(1) N III 989.8 is blended with Si II 989.9. The equivalent width is the total strength of this feature (N III and Si II). To obtain the column density, the contribution of Si II to the feature was removed (see § 3 for more details). (2) The red wing of the line is blended with local O I. (3) The line is blended with local H2. (4) Blended with lower velocity components, profile integrated from 160 to 255 .
| Ions | a | a | S/Nb | |||
|---|---|---|---|---|---|---|
| Å | (mÅ) | () | ||||
| N I | 1134.165 | 7 | ||||
| 1134.980 | 9 | |||||
| N II | 1083.994 | 2 | ||||
| O I | 1039.230 | 12 | ||||
| Si II | 1020.699 | 6 | ||||
| P II | 1152.818 | 8 | ||||
| Ar I | 1048.220 | 10 | ||||
| Fe II | 1096.877 | 9 | ||||
| 1125.448 | 12 | |||||
| 1143.226 | 7 | |||||
| 1144.938 | 7 | |||||
| Fe III | 1122.524 | 7 |
Note. — Uncertainties are errors. Upper limits indicate that no feature is present and are estimates. Lower limits indicate that the absorption line is saturated. Colons indicate that the value is uncertain.
() Rest frame vacuum wavelengths and oscillator strengths are from Morton (private communication, 2000), except for the -values of Fe II which are from Howk et al. (2000). () Signal-to-noise level per spectral resolution.
| Species | a | a | Fitb | ||||
|---|---|---|---|---|---|---|---|
| (Å) | () | () | () | () | |||
| MB | MB | HVC | MW | ||||
| c | c | c | c | ||||
| O VI | 1031.926 | P | |||||
| C IV | 1548.195 | P | |||||
| 1550.770 | G | ||||||
| P | |||||||
| P | |||||||
| Si IV | 1393.755 | G | |||||
| P | |||||||
| P | |||||||
| 1402.770 | G | ||||||
| P | |||||||
| P |
Note. — Uncertainties are errors. Colons indicate that the value is uncertain. () Rest frame vacuum wavelengths and oscillator strengths are from Morton (private communication, 2000). () Gaussian (G) or polynomial (P) fit to the continuum (see § 4.3 and Figure 7 for more details). () Range in over which the column density profile is integrated.
| MB | MB | HVC | MW | |
|---|---|---|---|---|
| O VI) | ||||
| C IV) | ||||
| Si IV) | ||||
| C IVO VI) | ||||
| C IVSi IV) |
Note. — Error bars reflect the range of possible values. Numbers between brackets indicate the range in over which the column density profile is integrated.
| MB | MW | |
|---|---|---|
| O VI) (1031.926) | ||
| C IV) (1550.770) | ||
| Si IV) (1393.755) | ||
| Si IV) (1402.770) | ||
| Si IV) (mean) | ||
| C IVO VI) | ||
| C IVSi IV) |
Note. — Uncertainties are errors.
| Ions | MB | Galactic Depletions | SMC | LMC | Data | ||||
|---|---|---|---|---|---|---|---|---|---|
| b | Coldc | Warmc | Halod | ||||||
| C II | STIS | ||||||||
| N I | FUSE STIS | ||||||||
| O I | FUSE STIS | ||||||||
| Mg II | STIS | ||||||||
| Al II | STIS | ||||||||
| Si II | STIS | ||||||||
| P II | FUSE | ||||||||
| Mn II | STIS | ||||||||
| Ar I | (0.0) | (0.0) | (0.0) | FUSE | |||||
| Fe II | FUSE STIS | ||||||||
| Ni II | STIS | ||||||||
Note. — Solar system meteoritic abundances from Anders & Grevesse (1989) except for C, N and O, which are photospheric values from Grevesse & Noels (1993); . Adopted S II column density, dex. The errors on Si II and S II were overestimated by in Lehner et al. (2001). Updated from Jenkins (1987), see Lauroesch et al. (1996); Welty et al. (1997, 1999b). From Savage & Sembach (1996); Fitzpatrick (1996); and references therein. Values in parentheses are estimated, see Welty et al. (1997, 1999b). For Ni II, the depletions were corrected to take into account the new oscillator strength scaling, see Lehner et al. (2001). (Russell and Dopita (1992) but adjusted for C, N and O photospheric values, and Al abundances are from Welty et al. (1997, 1999a), while LMC Si abundance is from Korn and Wolf (1999), but see also discussion in Garnett (1999)).