e-mail: sasha, ds, weigelt (@mpifr-bonn.mpg.de) 22institutetext: Astronomy Department, School of Physics, University of Sydney, NSW 2006, Australia
e-mail: gekko@physics.usyd.edu.au 33institutetext: Institute of Astronomy, Russian Academy of Sciences, Pyatnitskaya 48, Moscow, Russia
e-mail: lry@inasan.rssi.ru
Properties of the close binary and circumbinary torus
of the Red Rectangle
New diffraction-limited speckle images of the Red Rectangle in the wavelength range 2.1–3.3 m with angular resolutions of 44–68 mas (Tuthill et al. 2002) and previous speckle images at 0.7–2.2 m (Osterbart et al. 1997; Men’shchikov et al. 1998) revealed well-resolved bright bipolar outflow lobes and long X-shaped spikes originating deep inside the outflow cavities. This set of high-resolution images stimulated us to reanalyze all infrared observations of the Red Rectangle using our two-dimensional radiative transfer code. The high-resolution images imply a geometrically and optically thick torus-like density distribution with bipolar conical cavities and are inconsistent with the flat disk geometry frequently used to visualize bipolar nebulae. The new detailed modeling, together with estimates of the interstellar extinction in the direction of the Red Rectangle enabled us to more accurately determine one of the key parameters, the distance 710 pc with model uncertainties of 70 pc, which is twice as far as the commonly used estimate of 330 pc. The central binary is surrounded by a compact, massive ( 1.2 ), very dense dusty torus with hydrogen densities reaching cm-3 (dust-to-gas mass ratio ). The model implies that most of the dust mass in the dense torus is in very large particles and, on scales of more than an arcsecond, the polar outflow regions are denser than the surrounding medium. The bright component of the spectroscopic binary HD 44179 is a post-AGB star with mass , luminosity , and effective temperature K. Based on the orbital elements of the binary, we identify its invisible component with a helium white dwarf with 0.35 , 100 , and K. The hot white dwarf ionizes the low-density bipolar outflow cavities inside the dense torus, producing a small H II region observed at radio wavelengths. We propose an evolutionary scenario for the formation of the Red Rectangle nebula, in which the binary initially had 2.3 and 1.9 components at a separation of 130 . The nebula was formed in the ejection of a common envelope after Roche lobe overflow by the present post-AGB star.
Key Words.:
radiative transfer – circumstellar matter – stars: individual: Red Rectangle – stars: mass-loss – stars: AGB and post-AGB – infrared: stars1 Introduction
The Red Rectangle is a spectacular bipolar reflection nebula around an evolved close binary star (also known as HD 44179, AFGL 915, IRAS 06176–1036). The object has been extensively studied for more than two decades (see, e.g., references in Waters et al. 1998; Men’shchikov et al. 1998). Recent diffraction-limited speckle images of the object with 62–76 mas resolution in the optical (0.6–0.8 m, Osterbart et al. 1997, hereafter Paper I) and near infrared (0.7–2.2 m, Men’shchikov et al. 1998, hereafter Paper II) displayed a compact, highly symmetric bipolar nebula with pronounced X-shaped spikes, implying a toroidal distribution of the circumstellar material. No direct light from the completely obscured central binary could be seen.
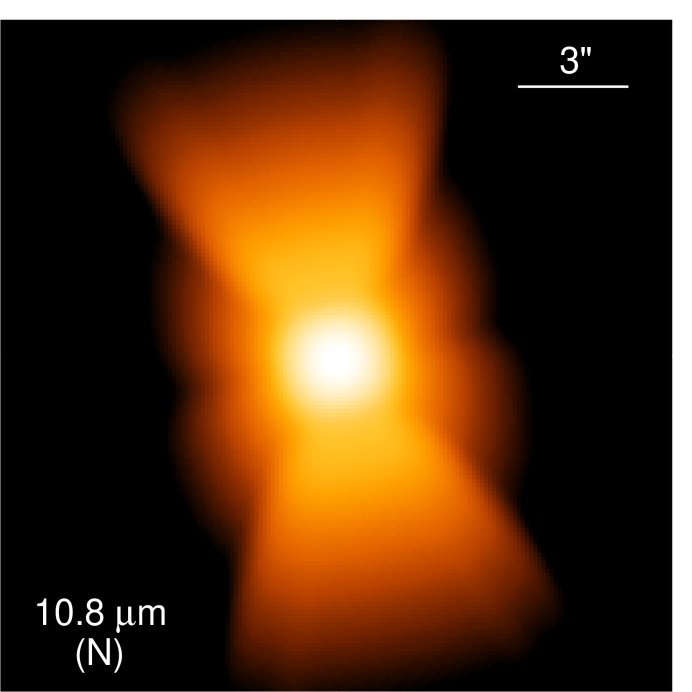
New diffraction-limited images of the Red Rectangle in the near-IR (2.1–3.3 m) with unprecedented angular resolutions of 46–68 mas were recently presented by Tuthill et al. (2002) (hereafter Paper III). The images were reconstructed from the Keck telescope speckle data using the bispectrum speckle interferometry method. The highest-resolution images clearly show two bright lobes above and below the midplane of an inclined torus or geometrically very thick disk. X-shaped spikes along the surfaces of the conical outflow cavities contribute to the intensity distribution of the two bright lobes, making them appear widened and even double-peaked. A striking feature of the Red Rectangle bipolar nebula is its self-similar appearance on scales from 80 mas to 1′ and from the red light to at least 10 m, implying that large grains of at least several microns in size dominate scattering.
Only a few two-dimensional (2D) radiative transfer calculations of the bipolar envelope of the Red Rectangle have been published to date. Yusef-Zadeh et al. (1984) first simulated the well-known optical images of the nebula with X-shaped spikes using a Monte-Carlo scattering method. Varying the density distribution and scattering properties of dust grains, they found that a torus-like configuration with a radial density profile and with biconical cavities having a full opening angle of 70° is able to reproduce the shape of the nebula. These calculations gave support to the previously suggested idea (Cohen et al. 1975; Morris 1981; Perkins et al. 1981) that a quasi-spherical envelope with bipolar cavities can reproduce the shape of the Red Rectangle.
Extending the previous modeling, Lopez et al. (1997) applied a Monte-Carlo technique in which they were able to not only simulate scattering of the stellar radiation at a selected wavelength, but also calculate the radiative equilibrium temperature and emission of dust. With multi-wavelength radiative transfer computations, they aimed to constrain the model by comparing it with the observed spectral energy distribution (SED) and a deconvolved 02 resolution intensity map at 2.2 m (Cruzalébes et al. 1996). This work represented the first step in the direction of a more realistic modeling of the Red Rectangle capable of explaining a larger set of observational data and to reconstruct reliable properties of the object.
In the previous 2D modeling presented in Paper II, we applied a frequency-dependent ray tracing method (Men’shchikov & Henning 1997) to construct a detailed model of the Red Rectangle consistent with a much larger number of observational constraints. For the first time, the model reproduced reasonably well the entire SED of the Red Rectangle from the ultraviolet to centimeter wavelengths and the highest-resolution (76 mas) speckle-interferometry images at 0.656 m, 0.8 m, 1.65 m, and 2.2 m. The extensive modeling allowed us to derive the geometry of a compact circumbinary torus-like structure, such as the opening angle ° of the bipolar cavities and the inclination angle ° of the symmetry axis. For an assumed distance of 330 pc, the model reconstructed physical parameters of the object, such as the total luminosity , the radius AU and the mass of the opaque () torus, the density distribution for AU and for AU, and very large sizes of dust particles ( cm).
Although the model describes reasonably well the large number of constraints, our new Keck telescope images of the Red Rectangle with unprecedented resolutions (44–68 mas, Paper III, ) have shown that the model is not consistent with the longest-wavelength 3.1 m and 3.3 m images. As we have already demonstrated in Paper III, the model predicts a single elongated peak at this wavelength, whereas the Keck image clearly displays two lobes divided by a dark lane, very similar to the shorter-wavelength images. In the model, there is too much emission from the hot grains close to the inner boundary of the torus, which implies insufficient optical depths. This finding stimulated us to recompute the model taking into account the new constraints in addition to the old data.
This paper presents a new detailed study of the Red Rectangle based on our previous model (Paper II) and on the new constraints provided by the Keck telescope images (Paper III). In Sect. 2 we describe our assumptions and radiative transfer model of the dusty circumbinary torus. In Sect. 3 we present the model results and compare them with available observational data. In Sect. 4 we discuss the parameters of the Red Rectangle and evolution of its close binary. In Sect. 5 we summarize conclusions of this work.
2 Radiative transfer model
2.1 General formulation
The detailed 2D radiative transfer model described below is similar to our recent model presented in Paper II. This new modeling was stimulated by the speckle images of the Red Rectangle with the unprecedented, diffraction-limited resolutions of 44–68 mas, based on data collected with the 10 m Keck telescope (Paper III). The images extend our previous series of high-resolution optical and near-IR images of the object (\al@Osterbart_etal1997,Men'shchikov_etal1998; \al@Osterbart_etal1997,Men'shchikov_etal1998) to 3.3 m and place stronger constraints on models. The new images gave us the opportunity to reanalyze the wealth of existing data on the Red Rectangle in the widest wavelength range from the far-UV to radio wavelengths, using accurate radiative transfer calculations. Following Paper III, we denote the Keck telescope near-infrared camera filters at 2.2, 3.08, and 3.31 m as , , and , respectively.
Our aim was to derive from the observations reliable information on the structure and physical properties of the Red Rectangle and on the evolutionary status of its central binary, HD 44179. We utilized our 2D radiative transfer code based on a ray-tracing method (Men’shchikov & Henning 1997), which solves the frequency-dependent radiative transfer problem in axially-symmetric dusty envelopes for a number of dust components and grain sizes. A large parameter space was explored in hundreds of models by comparing the resulting spectral energy distribution and images to the available observational constraints. For more discussion of our modeling approach, see Paper II, Men’shchikov & Henning (2000), and Men’shchikov et al. (2001).
2.2 Geometry and assumptions
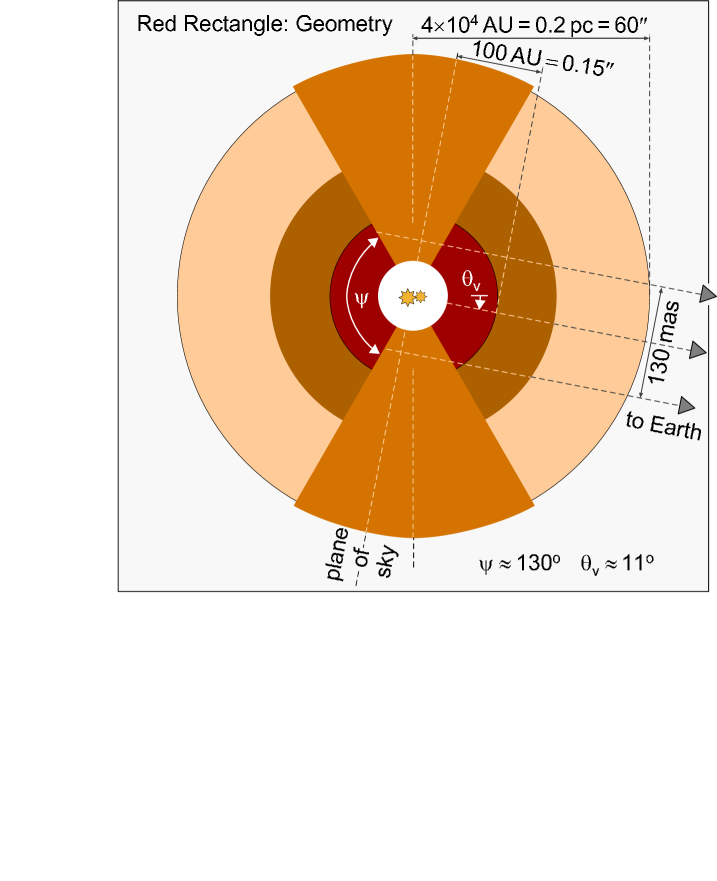
The axially-symmetric model torus of the Red Rectangle is shown in Fig. 1. The central binary HD 44179 is embedded in a very large dusty envelope of an axially-symmetric geometry defined by the biconical outflow cavities in the otherwise spherical distribution of material. For brevity, we call such a structure “torus”, although it displays obvious differences from a mathematician’s torus.
The density distributions of the massive torus and its outer envelope depend only on the radial distance from the center. The density of the bipolar outflow cavities is much lower than in the central regions of the massive torus ( 800 AU), whereas in its outer parts the outflow is denser than the surrounding envelope. Processes of dust condensation or sublimation put the inner boundary of the dusty torus at 14 AU, where temperatures of dust grains 1000 K. The location of the outer boundary can be constrained from below by a deep coronagraphic image of the Red Rectangle tracing the nebula up to 1′ from the center (Van Winckel 2001). Although the envelope can well be even more extended, we have fixed the model boundary at that angular distance. In contrast to other mass-losing evolved stars (e.g., IRC $$+10 216, Men’shchikov et al. 2001), any more precise location of in this object is unimportant: with the steep outer density distribution of our model (, Sect. 3.3), 99 % of the mass is contained in the compact dense torus ( 100 AU).
As usual, only the transfer of dust radiation was computed in this work. The gas component, present in the model only implicitly, is described by a dust-to-gas ratio = within the dense torus. Instead of assuming an arbitrary value, we used constraints from a detailed analysis of the binary evolution in the Red Rectangle (see Sect. 4.5 for details) to estimate and fix the total mass of the circumbinary material at , therefore determining . Since there are no reliable constraints for the outer regions of the envelope, we adopted = 0.004 outside the dense torus, which is close to the usual ratio for the mass-losing evolved stars.
Since the semimajor axis of the spectroscopically observed component of the close binary (Sect. 4.1) is significantly smaller than , we can replace the binary at the center of the system with a single star (see also Sects. 2.3, 2.5) for the purpose of the radiative transfer calculations. Furthermore, we assume that the plane of the binary’s orbit is parallel to the midplane of the circumbinary torus, i.e., that the inclination angle of the orbit is (cf. Fig. 1).
Extending the previous modeling (Paper II), we used a more realistic approach to describe dust grains, the main ingredient of the radiative transfer models. Instead of having dust particles of a single (very large) radius, we assume that the grains have a wide distribution of sizes. The radiative transfer code can handle any (reasonable) number of dust components, each of them with an arbitrary number of grain sizes. In practice, the number of the dust components needs to be kept at a minimum, balanced with available observational constraints. Details of the spatial distribution of chemical compositions, shapes, sizes, and other parameters of real dust grains in this object are poorly known. Large uncertainties of the real properties of dust enormously increase the (free) parameter space of the models to explore. Since our purpose was to reconstruct global properties of the Red Rectangle, we had to simplify the dust model (see Sect. 2.6) and ignore in this work the presence of polycyclic aromatic hydrocarbon molecules (PAHs) and of crystalline silicate dust (Waters et al. 1998). These are only minor components of the dust and our experience shows that they would not alter results of the modeling.
2.3 Effective temperature
It is impossible to observe the intrinsic energy distribution of the central source in the Red Rectangle directly since the close binary is obscured by the optically thick torus. The radiation of both components of the binary is reprocessed by dust grains, which makes our understanding of what is going on in the system very difficult. Cohen et al. (1975) classified the radiation source as a B9–A0 III star with K. From high-resolution spectroscopy, Waelkens et al. (1992) favored lower effective temperatures of 7500 K (or 8000 K) and gravity (or 1.4). Knapp et al. (1995) and Jura et al. (1997) measured radio emission from the Red Rectangle, concluding that it is produced by a small H II region (radius of 17–170 AU for our = 710 pc). Knapp et al. (1995) deduced a much higher temperature of at least K for the ionizing star and Jura et al. (1997) estimated an electron density of cm-3 in the region. The UV spectrum of the Red Rectangle does not show such a hot continuum in scattered light, therefore we can safely assume that the other star, a cooler supergiant with 8000 K, is responsible for the entire SED of the Red Rectangle (see also Sect. 2.5).
In this work, we have used several models of stellar atmospheres with effective temperatures between 7500 and 8000 K (Kurucz 1993). In the final model, described in Sect. 3, we adopted an atmosphere parameterized by = 7750 K, gravity , metallicity [M/H] = 3, and microturbulent velocity of 2 km s-1. The high-resolution spectrum of the atmosphere had been smoothed to a resolution of 100 and extrapolated to wavelengths 10 m. Although our final model’s parameters correspond to a slightly lower value of , this difference does not have any impact on the results of our continuum radiative transfer calculations.
2.4 Distance
Accurate estimates of distances are important for reliable derivation of parameters of individual objects. The most frequently cited distance to HD 44179 of 330 pc (Cohen et al. 1975) was obtained by assuming that the star is a visual binary, that it has the same bolometric luminosity as LkH$α$ 208 and as R Mon, and averaging the two distances. Since now we know that LkH$α$ 208 and R Mon are of a different spectral type and nature (massive pre-main-sequence Herbig Ae/Be stars), this derivation does not seem reliable. The same conclusion can be made with respect to another estimate of 280 pc (Schmidt et al. 1980), which assumed that the binary is visual and has identical components of spectral type A0 III, whose bolometric luminosities are 360 each. An upper limit of 800–1400 pc (Waelkens et al. 1992) was based on the measurements of photospheric abundances, accurate assessment of the effective temperature and gravity (Sect. 2.3), and the assumption that circumstellar dust produces a 2.7 mag extinction. Although the latter may not be reliable, the distance limit seems reasonable. An estimate of 940 pc (Knapp et al. 1995) was based on the upper end of the luminosity range of 2300–7500 suggested by Waelkens et al. (1992) and the bolometric flux of the Red Rectangle. Since the luminosity was chosen somewhat arbitrarily, it implies an uncertainty by a factor of 1.8 toward shorter distances. Parallax measurements with the Hipparcos satellite gave the value of 2.622.37 mas (Perryman et al. 1997), which amounts to a distance of 380 pc with quite large uncertainties making the whole range of 200–4000 pc plausible.
The widely adopted distance of 330 pc is definitely inconsistent with the well-established post-AGB status of the Red Rectangle. If the value were accurate, the total luminosity of the central binary (estimated from the SED assuming spherical symmetry of the nebula) would only be 920 (Leinert & Haas 1989). This luminosity is too low for a single post-AGB star (by a factor of 3–10) and it seems to be impossible to account for such a difference in the framework of the stellar evolution theory for single stars. Although binarity does modify stellar evolution to some extent, we still believe that the most natural and likely cause of this discrepancy is invalid distance.
The results of our modeling (Sect. 3.2) confirm this idea, demonstrating that an almost perfect fit to the SED of the Red Rectangle can be obtained only if the interstellar extinction (proportional to the distance) is properly taken into account. The interstellar reddening varies with direction in the Galaxy, and the variations increase closer to the galactic plane. The Red Rectangle is located at a galactic latitude of 118, in a region without noticeable dense interstellar dust clouds. The published photometric data for the Red Rectangle (Cohen et al. 1975; Kilkenny et al. 1985) show no significant color variations with an average = 0.42 mag. The stellar gravity and effective temperature correspond to an intrinsic color index = 0.18 mag (Straizhis 1977). As the extinction by the dense circumbinary torus is gray, a color excess = 0.24 mag is due to the interstellar dust. This results in an observational estimate of the interstellar = 0.74 mag, which is close to the value of = 0.89 mag we obtained in our model fitting of the observed SED (Sect. 3.2).
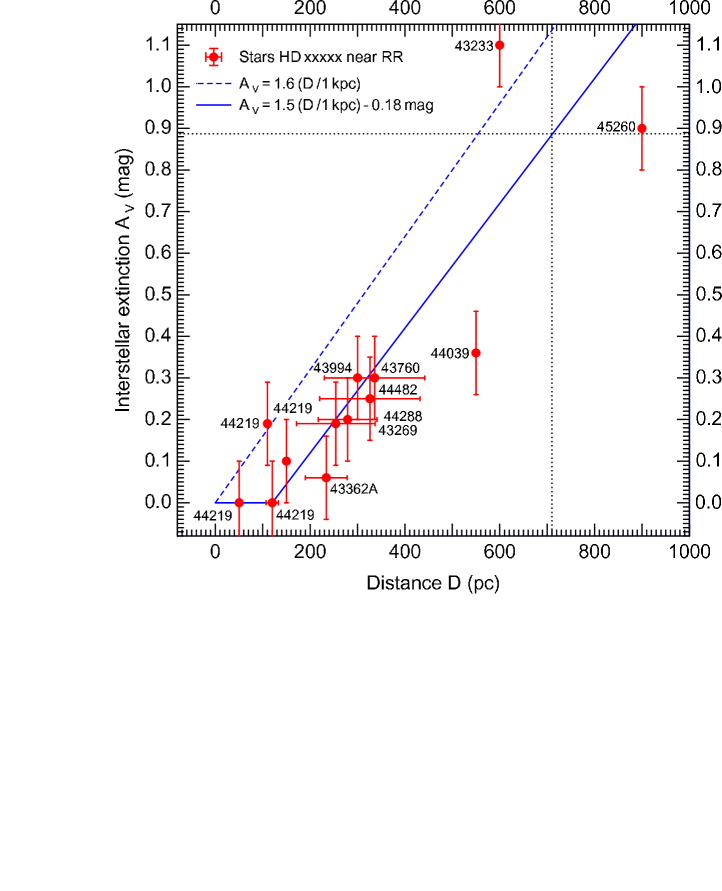
From these data one can estimate toward the Red Rectangle using the photometry and spectral classification of nearby stars available in the literature, as well as the Hipparcos parallaxes. Our search for the stars was facilitated by the SIMBAD and the Two Micron All Sky Survey databases. Although not many stars around the Red Rectangle have the estimates of spectral types, the existing data allow us to put some constraints on the relationship between and in this direction (Fig. 2). The stars located closer than 350 pc have 0.3 mag, demonstrating that a distance of 330 pc (Cohen et al. 1975) is inconsistent with of 0.74–0.89 mag derived in this paper. Data on two B-type stars suggest that reaches 1 mag at pc, although there is a very large gap in the diagram, in the region of our interest. A rough interpolation between the few available points seems to suggest a distance between 600 and 800 pc, however, there are no stars with known spectral types in the region. Photometric and spectroscopic observations of 9–10 mag A- and B-type stars in the neighborhood of the Red Rectangle on the sky would be very useful in obtaining a better estimate.
In this study we adopted an average interstellar extinction per hydrogen column number density mag cm2 (Bohlin et al. 1978) and a hydrogen number density cm-3. Assuming also that there is no extinction within 120 pc from the Sun, this resulted in mag (Fig. 2). Using the value of = 0.89 mag derived in this modeling and the dependence shown in Fig. 2, we can determine a distance 710 pc, with possible uncertainties of 100 pc due to unknown Galactic extinction beyond 350 pc from the Sun.
| Parameter | Symbol | Value | Units | Uncert. | Comment |
| Distance | 710 | pc | 10% | derived (from SED and reddening, Sects. 2.4, 3.2) | |
| Total luminosity | 6 050 | 20% | derived (from SED and distance, Sects. 2.5, 3.2) | ||
| Effective temperature | 7 750 | K | 10% | derived (from observations, Sect. 2.3) | |
| Stellar radius | 43 | — | derived () | ||
| Inner boundary | 14 | AU | — | derived ( 71 , Sect. 3.3) | |
| Outer boundary | 43 000 | AU | — | assumed (from deep optical images, Sect. 2.2) | |
| Total mass of envelope | 1.2 | — | derived (corresponds to = , Sects. 2.2, 4.5) | ||
| Gaussian density profile | FWHM | 26 | AU | — | model (14–100 AU, Sect. 3.3) |
| 1st density exponent | 1.5 | — | — | model (100–430 AU, Sect. 3.3) | |
| 2nd density exponent | 4.0 | — | 20% | model (430–43 000 AU, Sect. 3.3) | |
| Cavity opening angle | 50 | ° | 10% | derived (from high-resolution speckle images, Sect. 3.4) | |
| Viewing angle | 11 | ° | 10% | derived (from SED and model images, Sects. 3.2, 3.4) |
2.5 Luminosity
With the above distance of 710 pc, the object’s bolometric luminosity would be 4260 , if the nebula were spherically-symmetric. Although the value would better agree with the AGB status of the star, this simple estimate based on the assumption of spherical geometry is incorrect, because the Red Rectangle is strongly non-spherical. Large deviations from spherical geometry in optically thick environments usually lead to large errors (by a factor of several), depending on the optical depths, viewing angle, and degree of non-sphericity (see e.g., Men’shchikov & Henning 1997; Men’shchikov et al. 1999). Our present modeling shows that the actual total luminosity of the binary is 6050 (Sect. 3.2). This entire luminosity seems to be produced by the post-AGB component of the binary. Luminosities, masses, and other parameters of both components, not related directly to the radiative transfer calculations, are discussed in more detail in Sect. 4.
2.6 Dust particles
As we have shown in the previous modeling (Paper II), the dominant particles in the dense dusty torus of the Red Rectangle are very large. Much smaller amounts of small dust grains and PAHs seem to exist somewhere in the nebula, perhaps in its outer dilute parts and in the outflow regions. In the final model we assumed that there are two (spatially separate) components of dust grains. Following Paper II, the first component is made of very large particles of an unspecified chemical composition, with sizes of 0.2 cm. This component exists only in the compact, extremely dense circumbinary torus, where most of the grains are assumed to have coagulated into the large particles. The other component is the amorphous carbon grains with radii in the range of 0.005–600 m and with the standard interstellar size distribution . This second component exists beyond the boundary of the compact torus (100 AU ), where the density drops by several orders of magnitude. This particular choice of the dust parameters is somewhat arbitrary, as there are no observational constraints to better restrict the freedom. We should note, however, that it was impossible to make our model explain all observations when considerable amounts of small dust grains were put in the dense torus. We can conclude that a difference between the dust properties of the compact dense torus, made up of very large particles and of those of the surrounding low-density envelope, made up of normal grains, is a firm result of the modeling.
3 Results of the modeling
3.1 Model parameters
The final parameters of our detailed radiative transfer model and their approximate uncertainties are presented in Table 1. The model results are described in Sects. 3.2–3.6 in detail. The density distribution is assumed to be a broken power law , the exponents ( = 1, 2) being allowed to change in different radial zones. The third column lists the values adopted in the final model. The fifth column contains our estimates of the uncertainties associated with the final model parameters. They indicate very approximately the maximum changes of the parameters, such that the fit to the observations can still be restored by adjusting some other model parameters. The uncertainties should not be interpreted as absolute error bars. If some of our general assumptions turn out to be insufficiently realistic, this would possibly affect the results more than these uncertainties imply.
It may be useful to recall here that the results of our radiative transfer modeling are invariant with respect to the distance , except for several parameters which are scaled in the following simple way:
| (1) |
where mass and density refer to the properties of dust; for conversion to the gas parameters, must be specified (Sects. 2.2, 4.5). These relations make it easy to scale the model results to another distance, if necessary.
3.2 Spectral energy distribution
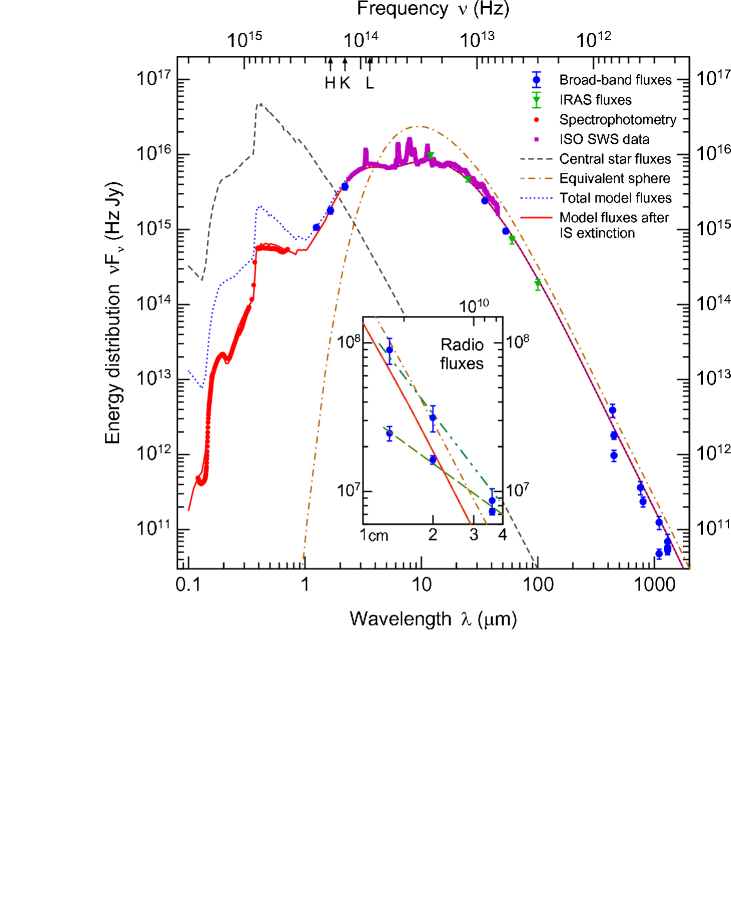
In addition to the fluxes used in Paper II, in our new modeling we included data collected by the Infrared Space Observatory’s short-wavelength spectrometer (ISO SWS, Waters et al. 1998) as well as new (sub-)millimeter fluxes (Greaves & Holland 1997; Jura & Turner 1998; Sánchez Contreras et al. 1998). To make sure that the observed SED of the Red Rectangle is not influenced by observations at different epochs, we ignored older broad-band fluxes (in the wavelength range covered by the ISO data) containing essentially no additional information on the spatial distribution of intensity. As our model does not contain any species producing unidentified nebular red emission between 0.55 and 0.75 m (Schmidt et al. 1980), we included an optical spectrum of the innermost few arcseconds around HD 44179 (Reese & Sitko 1996) that shows no extended red emission.
Figure 3 compares the model SED to the broad-band flux distribution and spectrophotometry of the Red Rectangle. To emphasize the influence of the bipolar geometry, the SED of an equivalent spherical envelope is also shown. The latter differs from the torus model only by the absence of the outflow cavities (i.e. = 180°, = 0, Fig. 1). The model of the Red Rectangle fits the observed continuum underlying the emission features almost perfectly, from the far UV to centimeter wavelengths. Three lower radio fluxes in small beams with a spectral index of are most likely produced by a compact H II region (Jura et al. 1997), whereas three higher fluxes in larger beams are mostly due to dust emission. When the compact radio emission of the H II region, which has not been included in our modeling, is added to the total model fluxes, the large-beam fluxes become perfectly fitted (Fig. 3). There is no discernible effect of different apertures (larger than a few arcseconds) at any wavelengths in the model SED, which implies that the dusty torus has density distribution highly concentrated toward the center (see Sects. 3.3, 3.4).
The Red Rectangle differs from other dusty objects in that the dominant dust particles are very large, most likely millimeter-sized (\al@Jura_etal1997,Men'shchikov_etal1998; \al@Jura_etal1997,Men'shchikov_etal1998). The new modeling presented here confirms the idea that the dense torus contains most of its circumstellar dust mass in large particles having gray extinction. We found no model with significant amounts of small grains that would be able to reproduce all high-resolution images and the SED. It seems to be impossible, however, to fit the observed fluxes with only very large grains.
It was clear also from our previous model (Paper II) that gray circumstellar extinction alone cannot reproduce the SED of the Red Rectangle in the optical and UV. The steep peak of the scattered intrinsic stellar energy distribution of the post-AGB component in the visible sharply contrasts the almost horizontal SED in that region. At wavelengths shorter than the Balmer jump, the observed fluxes drop much deeper and much steeper than simple gray scattering of stellar radiation would predict (Fig. 3). This puzzle can be solved in a simple and natural way just by taking into account interstellar extinction.
Usually it is difficult to discriminate between the absorption by circumstellar and interstellar dust: small circumstellar dust grains absorb radiation the same way the interstellar grains do. In contrast to the latter, dust in stellar environments is embedded within and plays an active role in modifying the circumstellar radiation field. On the other hand, the interstellar dust is just passively absorbing and scattering photons on their way to the observer. Since our modeling has shown that the dust particles in the circumbinary torus of the Red Rectangle are predominantly very large, we are left with only one possibility to explain the discrepancy at short wavelengths, namely, that the SED is altered by the selective extinction of small interstellar dust grains.
The distance to the Red Rectangle is large enough for the interstellar extinction (Sect. 2.4) to affect the observed SED. For the wavelength dependence of the interstellar extinction, we used the analytic fits of given by Cardelli et al. (1989). The extinction law parameter was fixed at the generally accepted value of 3.1 corresponding to the diffuse interstellar medium. The pronounced effect of interstellar extinction is visible in Fig. 3 as the increasingly larger difference toward shorter wavelengths ( 1 m) between the total (unreddened) model fluxes and the model fluxes reddened by ( mag). After the interstellar reddening has been taken into account, the model SED became almost indistinguishable from the observed flux distribution.
In contrast to the transfer of radiation in circumstellar envelopes, interstellar extinction does depend explicitly on the distance to the object. The accurate fit of the short-wavelength part of the SED enabled us to derive a distance pc to the Red Rectangle, with approximate model uncertainties of about 10 %, which is consistent with both the interstellar reddening data in this direction and the object’s luminosity. In fact, this larger distance implies the stellar luminosity is more than four times higher, reducing by the same factor the large discrepancy between the post-AGB nature of HD 44179 and its low apparent luminosity (Sect. 2.5). The actual luminosity obtained in our modeling is even higher than the value of 4260 one would expect for a spherical envelope. This is not surprising, given the obvious non-sphericity of the optically thick circumbinary torus (Sect. 2.5).
The above 40 % increase of the derived luminosity is a result of accurate 2D radiative transfer calculations. In the optically thick non-spherical configurations like the torus of the Red Rectangle, a large fraction of the central star’s radiation can escape in the optically thin polar cavities, thus changing the value of the luminosity an observer would derive under the (invalid) assumption of spherical symmetry. The observer would underestimate the luminosity if the object’s orientation is close to edge-on, whereas one would significantly overestimate the luminosity if one sees the object almost pole-on. Corrections for converting the observed “spherical” luminosities into the real luminosities of the central energy sources may reach a factor of several, depending on the distribution of optical depths, opening angle of the cavities, and the viewing angle of the object (see, e.g., Men’shchikov & Henning 1997; Men’shchikov et al. 1999). It seems to be difficult (if possible at all) to determine such factors once and for all; they have to be derived for each individual object in a detailed modeling.
3.3 Densities and temperatures
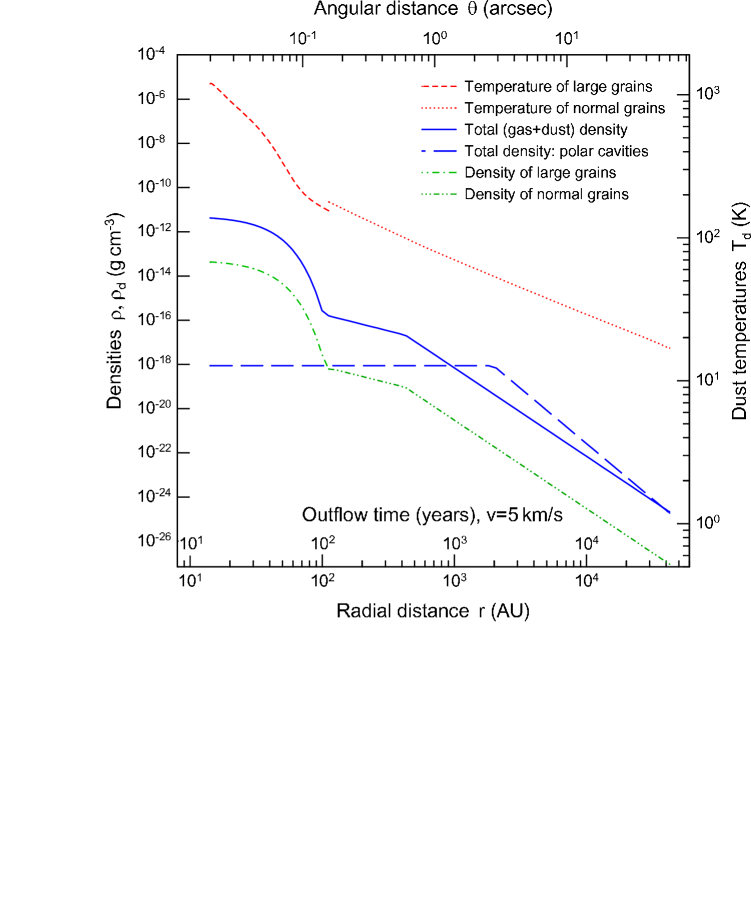
The density and dust temperature distributions of our final model of the Red Rectangle are shown in Fig. 4 for the smallest grains; the total gas plus dust density is also plotted assuming a spatially uniform dust-to-gas mass ratios = within the dense torus and 0.004 outside (Sects. 2.2, 4.5). Although may be a more complex function of the position inside the nebula, we assumed this simple form in the absence of better constraints. This parameter is only a means to approximately convert the dust densities into the total density.
A unique property of the Red Rectangle is that even the and images show almost the same intensity distribution as the images at shorter wavelengths (\al@Osterbart_etal1997,Men'shchikov_etal1998,Tuthill_etal2002; \al@Osterbart_etal1997,Men'shchikov_etal1998,Tuthill_etal2002; \al@Osterbart_etal1997,Men'shchikov_etal1998,Tuthill_etal2002). Moreover, the biconical shape is preserved across a wide range of wavelengths (0.6–10 m) and spatial scales (0.001–1′) (cf. \al@Cohen_etal1975,Perkins_etal1981, Waters_etal1998,Men'shchikov_etal1998,VanWinckel2001; \al@Cohen_etal1975,Perkins_etal1981, Waters_etal1998,Men'shchikov_etal1998,VanWinckel2001; \al@Cohen_etal1975,Perkins_etal1981, Waters_etal1998,Men'shchikov_etal1998,VanWinckel2001; \al@Cohen_etal1975,Perkins_etal1981, Waters_etal1998,Men'shchikov_etal1998,VanWinckel2001; \al@Cohen_etal1975,Perkins_etal1981, Waters_etal1998,Men'shchikov_etal1998,VanWinckel2001, ). This fact provides a strong observational constraint on the density structure and dust properties of the circumbinary environment of the Red Rectangle.
The invariant biconical shape of the nebula at such different scales and even at the mid-infrared wavelengths suggests that the shape is produced by scattering. The 10 m image presented by Waters et al. (1998), in which the bipolar outflow can be traced to 10″ from the central stars rules out thermal emission from dust: in our model, grains in the torus and in the cavities have temperatures of 32 K and 95 K, respectively, at these distances. At optical as well as at near-IR wavelengths, the biconical shape is caused by the radiation scattered by dust grains in the bipolar outflow regions. The particles must be very large compared to the normal (small) interstellar grains since the latter have negligible albedo in the mid-infrared. Dominant grains must have sizes of at least several microns in order to efficiently scatter the mid-IR radiation.
The present modeling has shown that the density distribution of the toroidal structure of the Red Rectangle has two distinct regions: the compact dense torus and the extended low-density envelope (Figs. 1, 4). The model density distribution displayed in Fig. 4 follows a Gaussian profile in the very dense torus, with a full width at half maximum of 26 AU and a maximum total density of g cm-3 ( cm-3). The dense torus contains 99 % of the total mass of the circumbinary material. The density of the toroidal core drops by 5 orders of magnitude at AU (015), where it changes to a much flatter radial profile, which in the outermost regions at 430 AU (06) steepens to a distribution. Constrained by our new highest-resolution speckle images ( Paper III, see also Sect. 3.4), the radial density profile differs from that of the previous model (Paper II) by the much steeper, exponential fall-off in the outer regions of the torus and by the flatter density distribution just outside it. No simpler power-law density profile has been found to reproduce the well-defined bright bipolar lobes which are almost invariant between the and bands.
The bipolar appearance of the Red Rectangle implies much lower density in the outflow cones compared to the torus over the central subarcsecond region (Fig. 4). The inner dense torus is optically thick ( up to 1 cm) and our modeling demonstrated that the observed appearance of the Red Rectangle requires the outflow cavities to be optically thin (). On the other hand, the model shows that the outer regions of the circumbinary material (at angular distances 05) are optically thin in all directions. This implies that the strong biconical shape visible in the outer parts of the Red Rectangle is produced by dust scattering in the outflow regions which are much denser there than the rest of the torus at the distances of 800 AU from the center. This conclusion implicitly assumes that the dust properties in the outflow cones and in the rest of the toroidal envelope are the same. If dust grains in the torus and in the outflow cones differ in such a way that the outflow regions scatter significantly more radiation to the observer, there may be no need for a density contrast to explain the observations.
In the absence of reliable constraints, we modeled the radial density distribution in the outflow cavities by a constant density g cm-3 ( cm-3) at 2000 AU (28) and by a steep profile outside (Fig. 4). The density profile of the outer regions is constrained by the long-wavelength fluxes of the observed SED, which must be produced largely by the dense inner torus with very large dust grains. At the distance of 2000 AU, the density in the outflow cavities is larger by a factor of 14 than that of the toroidal envelope; the density contrast is vanishing toward the outer boundary of the model. At the inner boundary, the torus is denser by a factor of than the outflow cavities. Such a density structure can be interpreted as a result of higher mass loss and velocity in the outflow along the symmetry axis during the last years, as compared to the early mass loss that made up the rest of the outer toroidal envelope.
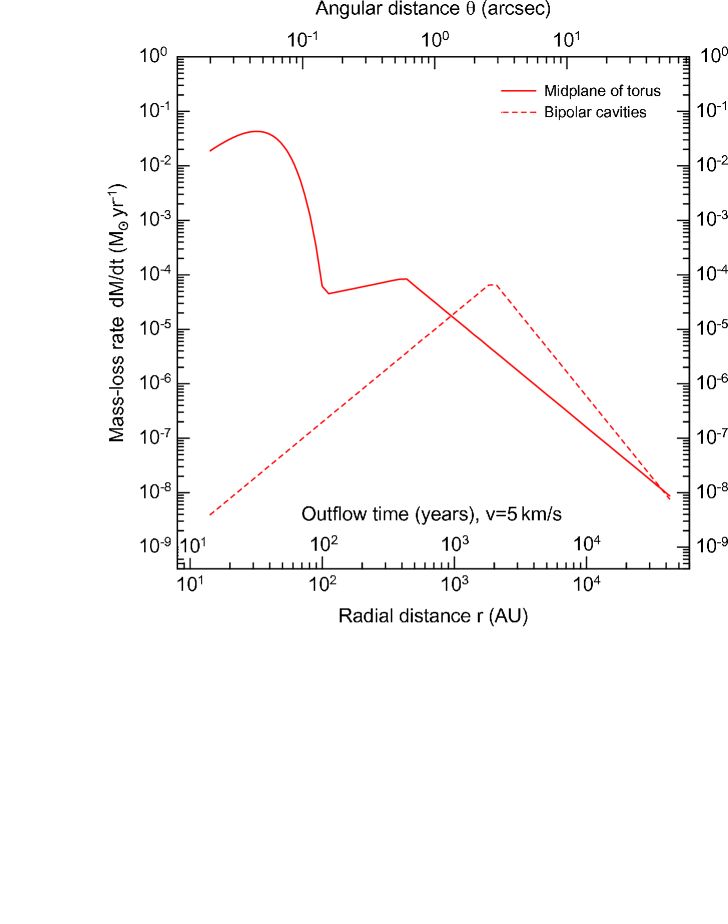
With the assumption of a constant-velocity spherically-symmetric mass loss, one can derive the mass-loss history of the Red Rectangle from the density profiles shown in Fig. 4. The reconstruction presented in Fig. 5 can provide approximate but useful information on the global properties and temporal evolution of the mass loss. The very high density contrast of the toroidal core of our model with respect to the outer envelope (Fig. 4) is reflected in the mass-loss rates that seem to reach yr-1 within the dense core, very high values compared to the usual spherical mass loss from AGB stars. However, the dense core is most likely the result of a complex, time-dependent hydrodynamical evolution of the self-gravitating envelope ejected from the central binary. Both expansion and infall are likely to have played a role in the accumulation of the circumbinary material and in the compression of the compact torus to very high densities. For an illustration, note that 90 % of the dense torus’ mass resides within AU. If the mass is redistributed over a radius of 430 AU (where and change their sign, Fig. 5), then the peak densities and mass-loss rates we derive would be lowered by a factor of 430 to the values of cm-3 and yr-1. It seems plausible that the hydrodynamical interplay between the gravitation, gas and radiation pressure, and bipolar outflow have led to the present-day density distribution inside the circumbinary torus and within the bipolar outflow cavities (see also Sect. 4.4).
3.4 Near-infrared images
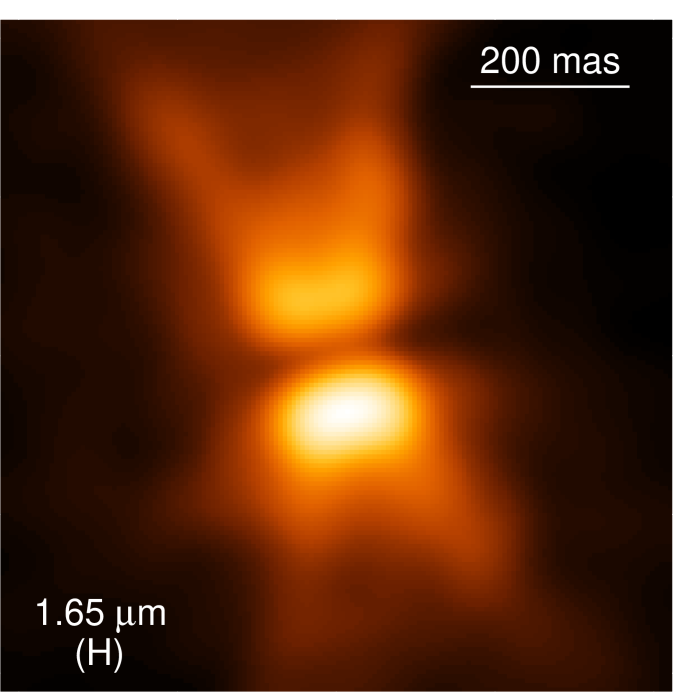
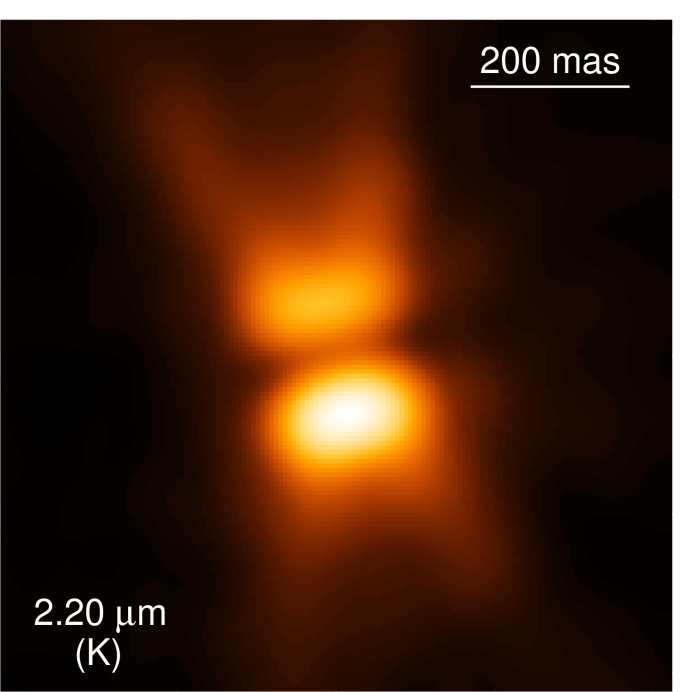
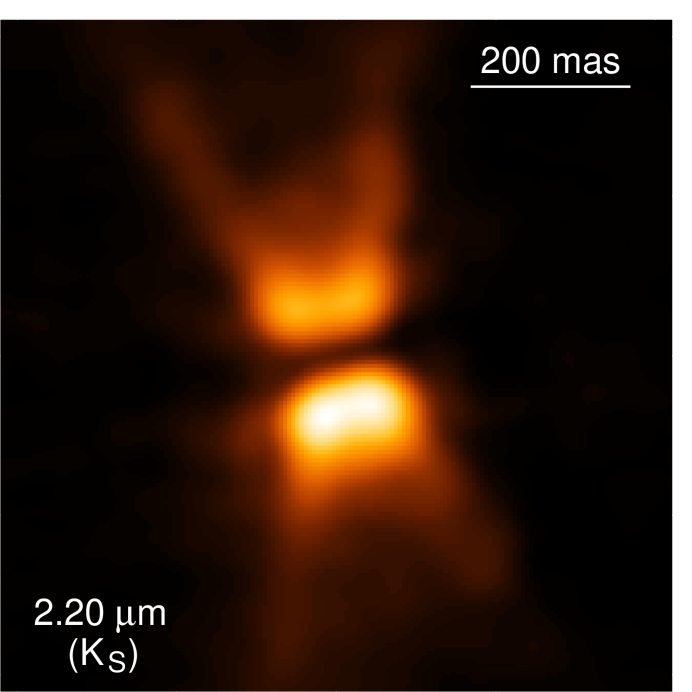
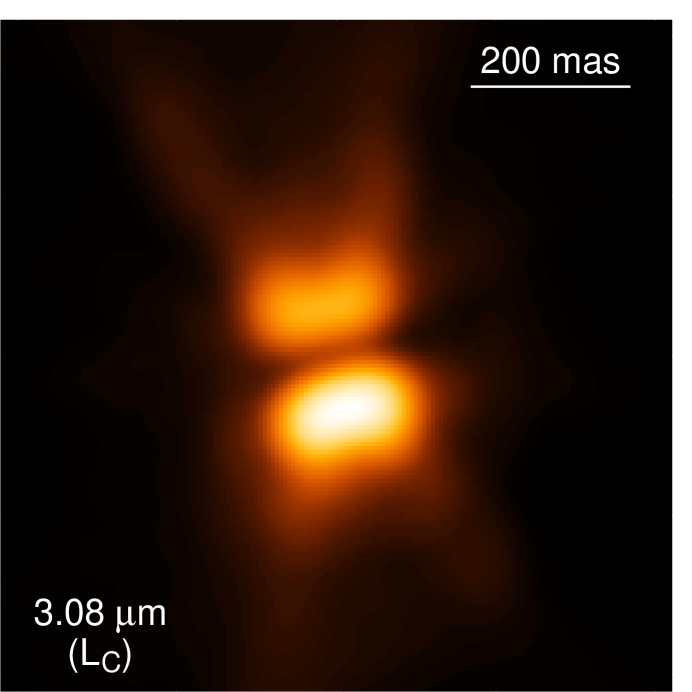
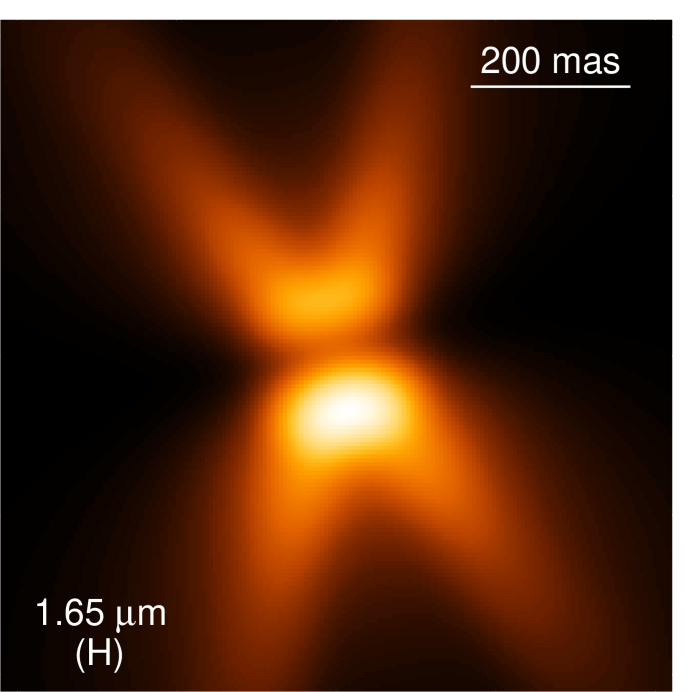
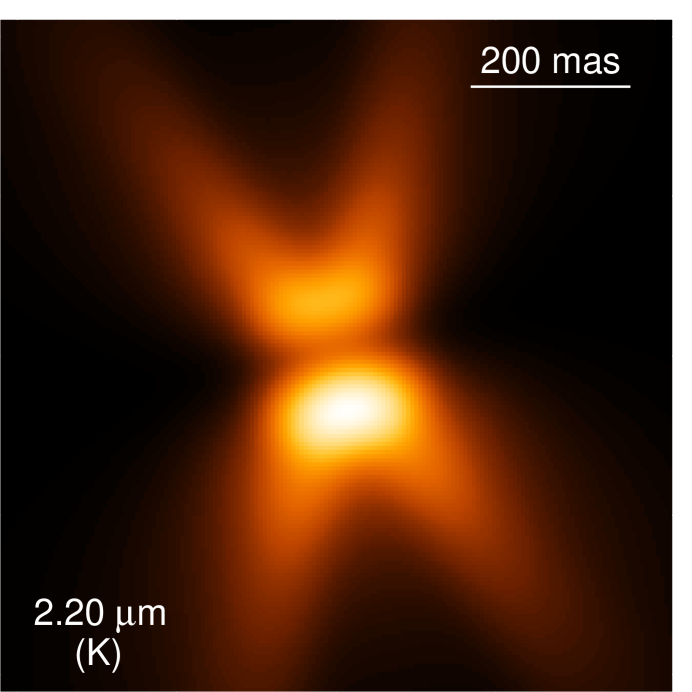
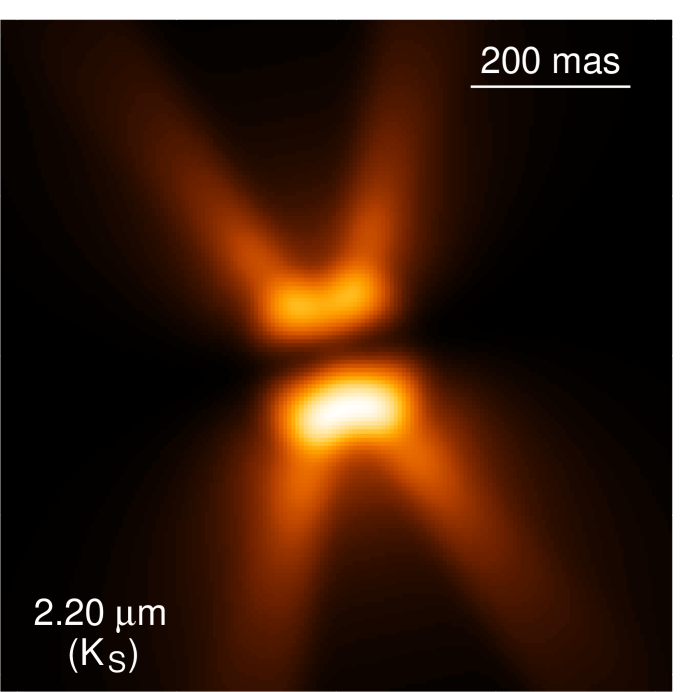
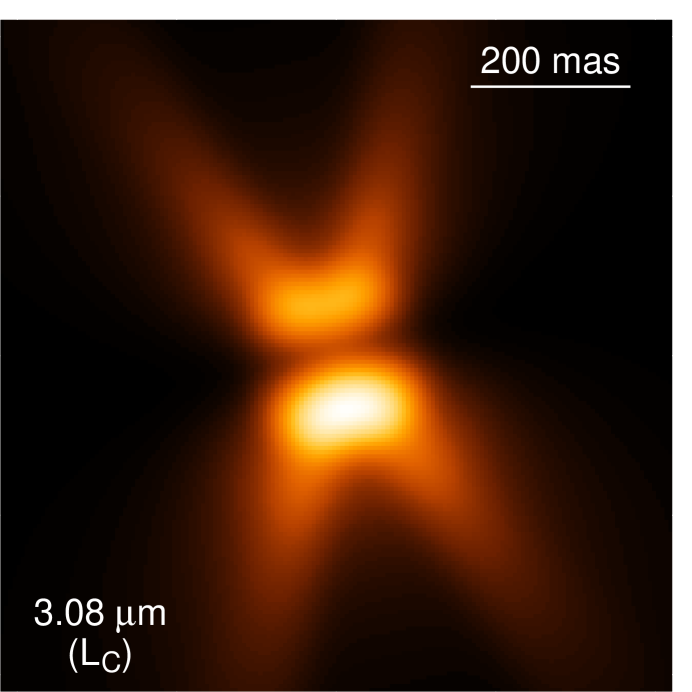
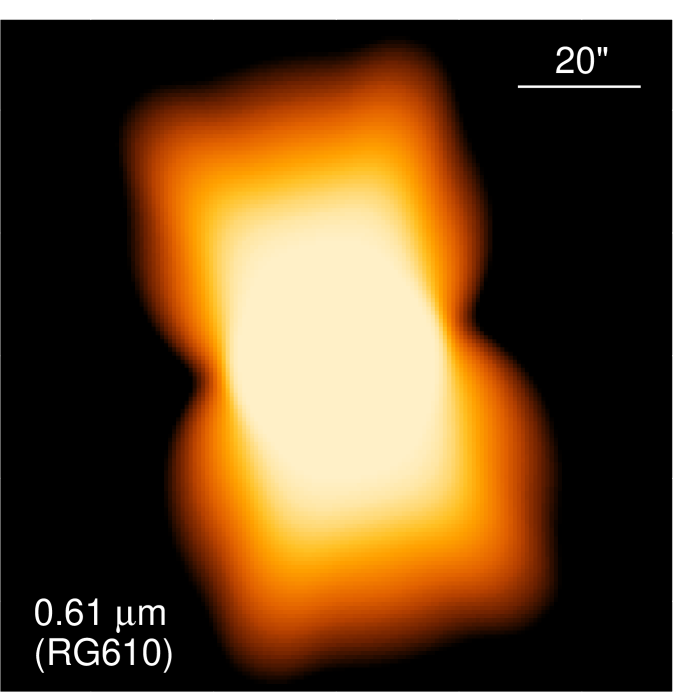
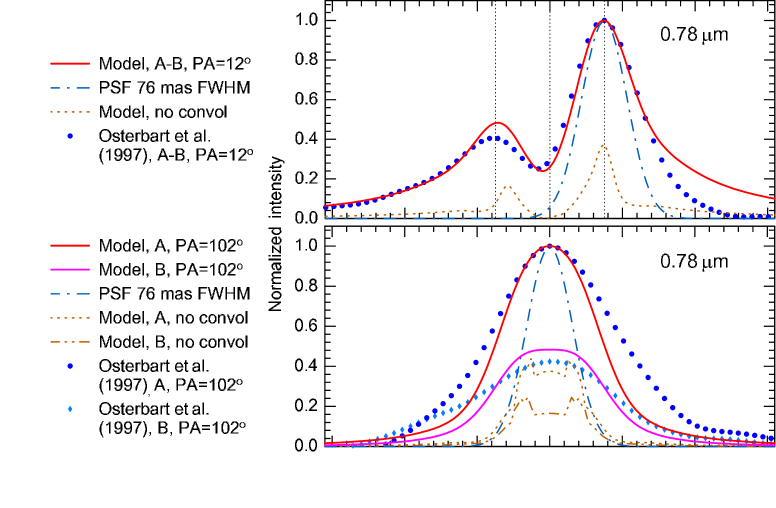
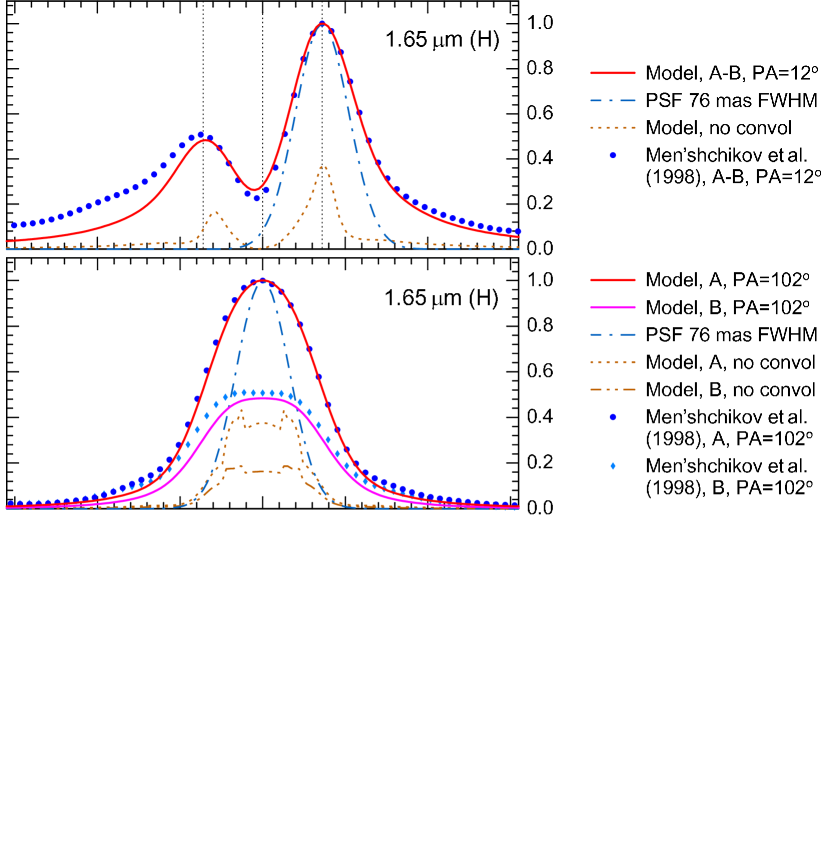
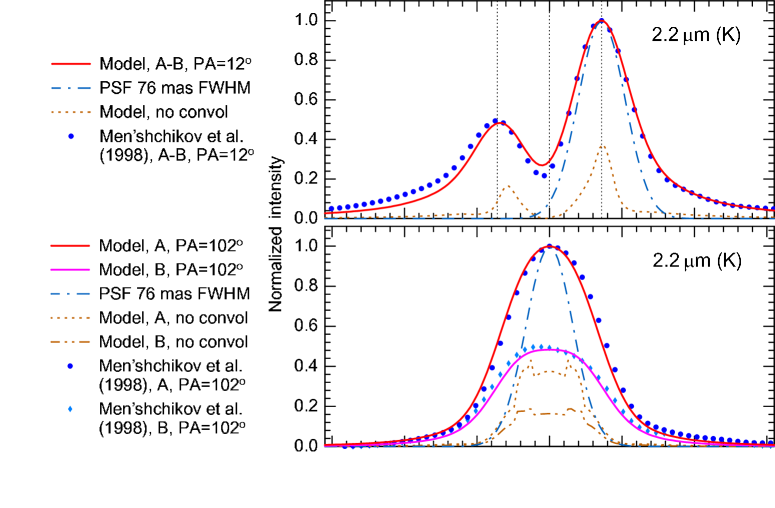
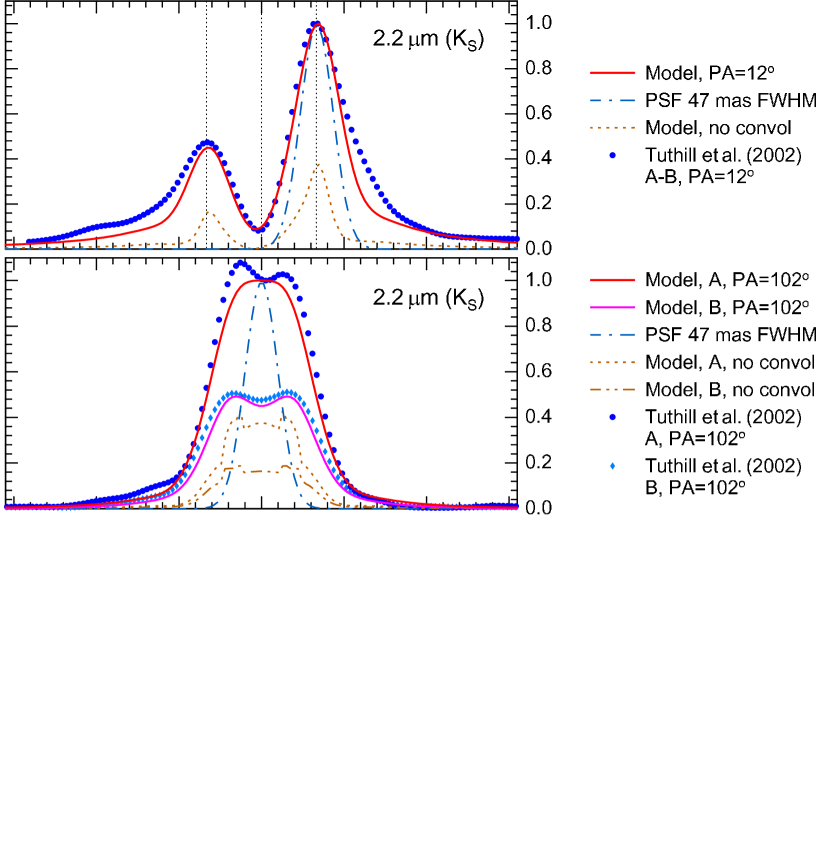
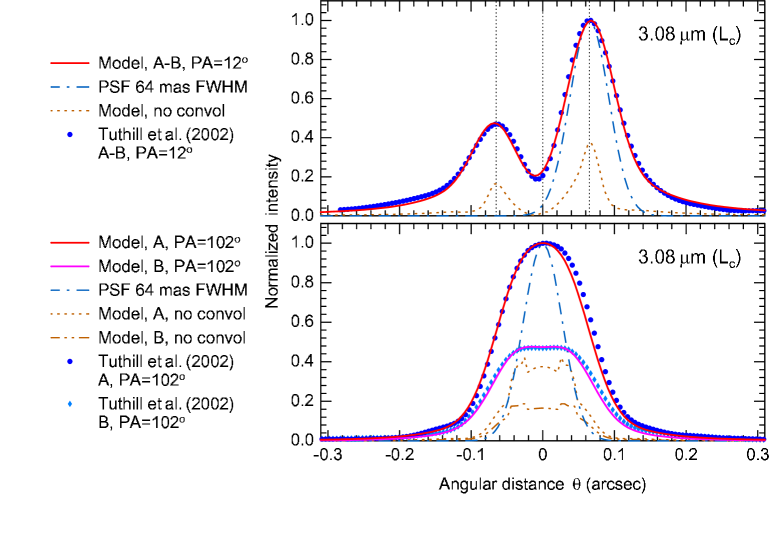
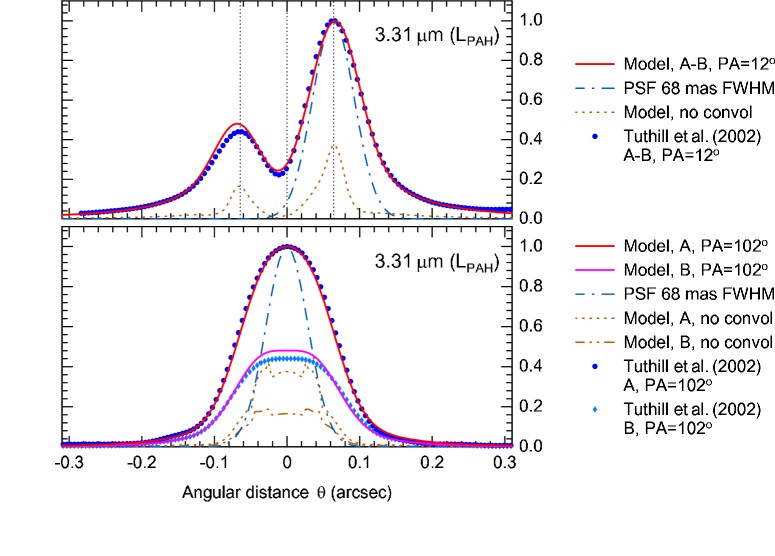
In Fig. 7, our model images are compared side by side with our high-resolution images of the Red Rectangle in the , , , and bands (\al@Men'shchikov_etal1998,Tuthill_etal2002; \al@Men'shchikov_etal1998,Tuthill_etal2002). The model intensity distributions at these wavelengths were convolved with circular Gaussian point-spread functions (PSF) of half-maximum widths of 47–76 mas corresponding to the resolutions of the reconstructed speckle images. In Fig. 7, we also present the model images at 0.61 m and 10 m, which can be qualitatively compared to an optical RG 610 photograph (Cohen et al. 1975), a deep coronagraphic Hα image (Van Winckel 2001), and an -band image (Waters et al. 1998). The effects of saturation from long exposures in the optical images was roughly simulated by convolving the model intensity distribution with a circular PSF of 8″, whereas the 10 m model image was convolved with a PSF of 07 which takes into account probable seeing conditions during the observations. Missing details on the PSFs and intensity scales in the papers mentioned above prevented us from using the images as constraints in the modeling and from making more accurate, quantitative comparisons.
Two well-resolved bright lobes above and below the inclined torus of the Red Rectangle are seen in the observed images of Fig. 7, along with the X-shaped spikes originating deep inside the biconical outflow cavities. The spikes are bright enough to contribute to the intensity distribution of the bright lobes (outflow cavities), making them appear broadened and even double-peaked in the highest-resolution image (see also Sect. 3.6). The X-shaped spikes are caused most likely by a combination of the limb brightening and scattering by dust in the dense boundaries of the biconical outflow cavities, as first indicated by polarization maps (Perkins et al. 1981). Unidentified optical emission bands, extended red emission, and the 3.3 m PAH emission line also originate close to the biconical surfaces along the X spikes (Kerr et al. 1999).
Extending our previous modeling of Paper II, in this work we attempted to simulate the X spikes appearing in the conical walls of the outflow cavities along the planes tangential to their surfaces. To accurately and consistently model the spikes, one needs a more sophisticated radiative transfer code than we have; moreover, the properties of dust and other species producing the X shape are very poorly known. For these reasons, we did not try to incorporate the spikes in our 2D code in a self-consistent way as part of the radiative transfer iterations; instead, we decided to simulate the spikes for an illustrative purpose when computing the observable model fluxes. The spikes in the model images were produced by artificially increasing the scattering term of the source function in the cavities by 20 % between the plane tangential to the cavity surface and another plane closer by 5° to the symmetry axis.
The spikes are clearly seen in all images of Fig. 7, both observed and modeled, traced along the surface of the biconical outflow cavities to within the distances of 04 from the center. It is clear that the length of the spikes depends on the density distribution and dust properties, as well as on the sensitivity and resolution of observations. A higher signal-to-noise composite near-IR image of the Red Rectangle (Paper III) traces them to within 08 from the central binary. The spikes can be approximated by straight lines passing through the east and west peaks of the split northern and southern lobes and intersecting at the position of the central binary. The opening angle of the conical outflow cavities, measured between the spikes, is 50°.
The near-IR images of the Red Rectangle (Fig. 7) clearly show the bright lobes which our model associates with a geometrically and optically thick torus inclined toward us in the south by 11°. The images exhibit a compact, highly symmetric brightness distribution, very similar in shape and extent between the and bands. As is becoming more apparent with highest resolution of the image, the bright lobes are divided by a very dark narrow lane, having a similar width in all the images. Even at the longest wavelengths there are no signs of either the direct light from the central binary, or an increasing contribution of hot emission (1000 K) from the inner dust boundary of the torus. As discussed also in Paper III, such an appearance suggests a strong concentration of circumstellar matter toward the central binary in an axially-symmetric density distribution and a high gray optical depth due to large dust particles (Sect. 2.6).
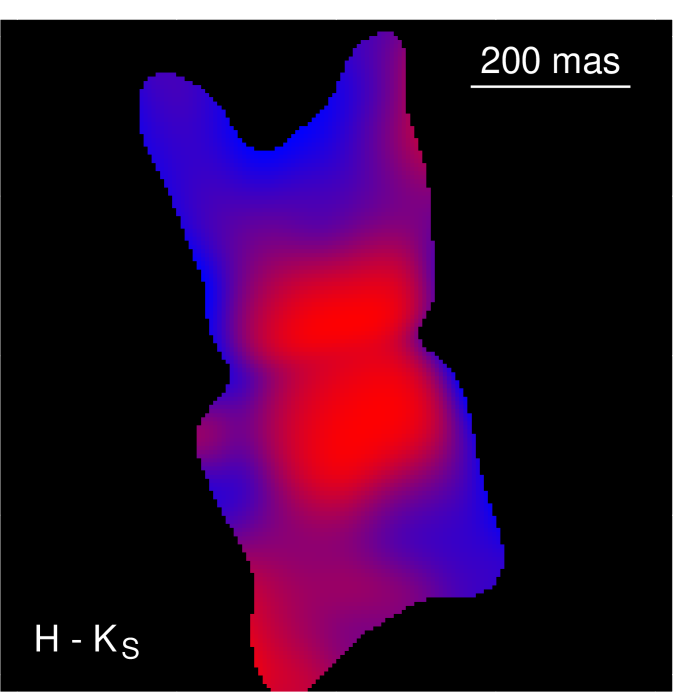
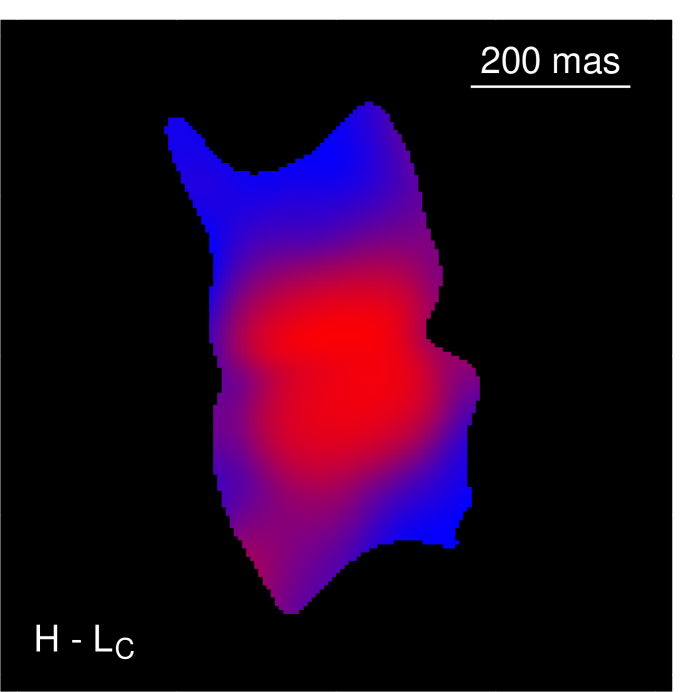
3.5 Near-infrared color images
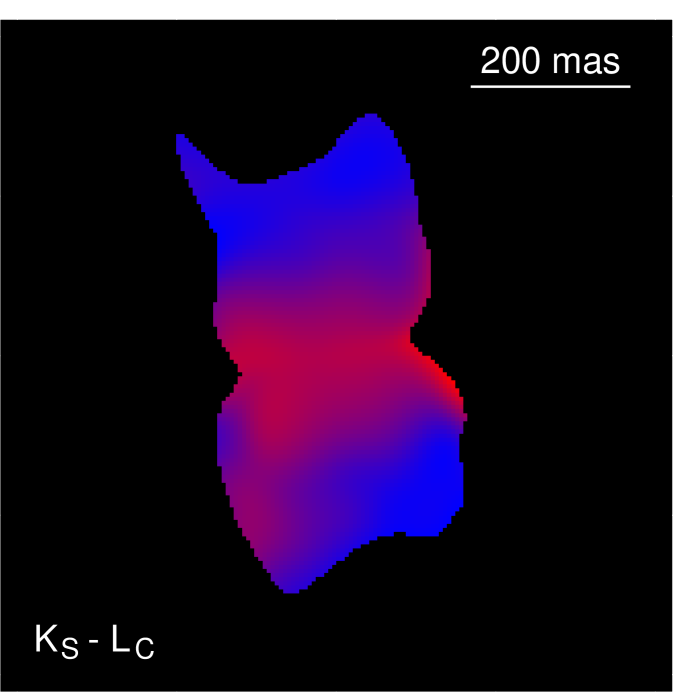
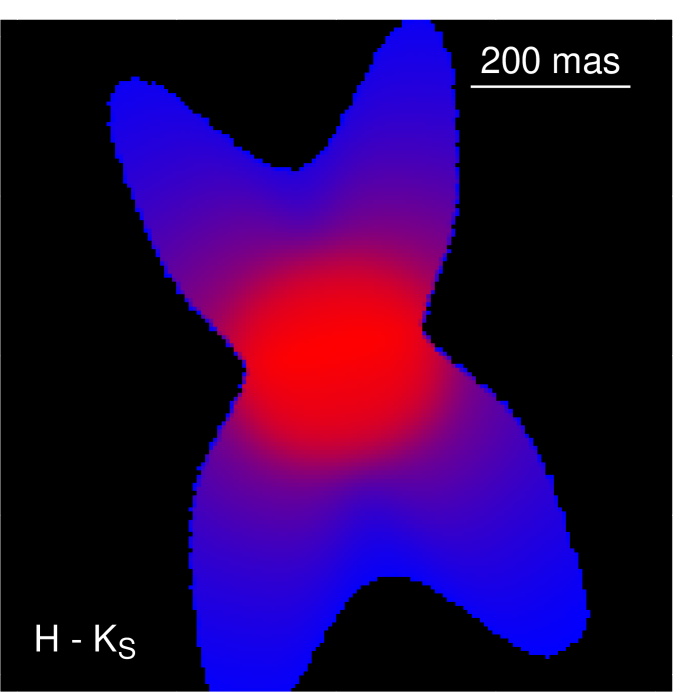
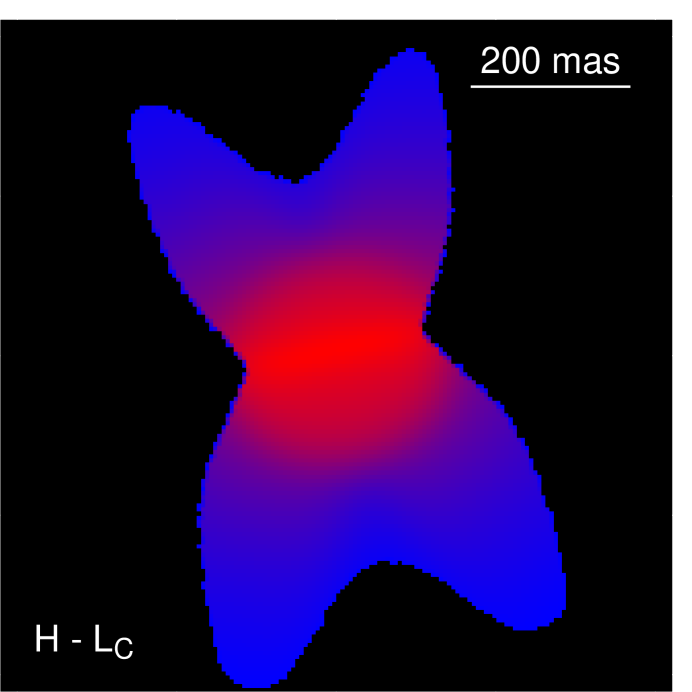
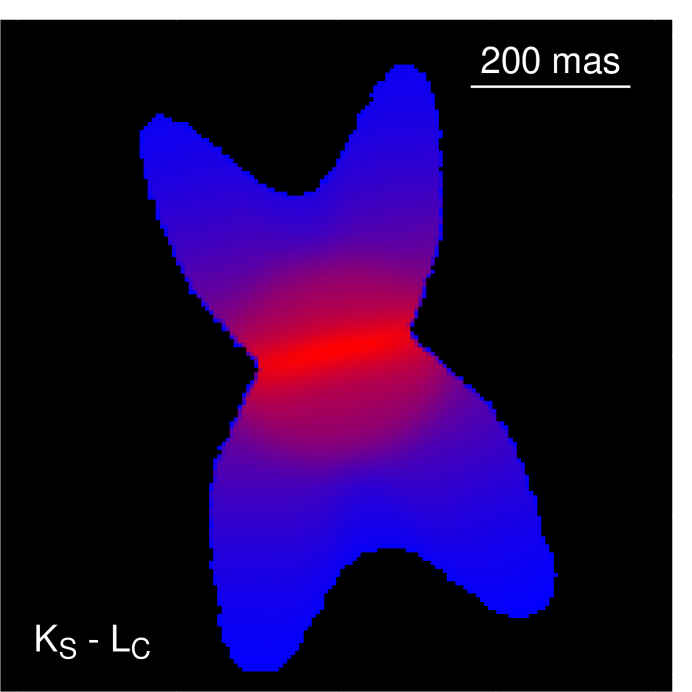
High-resolution color images provide a sensitive measure of the relative intensity distribution at selected wavelengths and a comparison of the observed and model color images gives a better idea of how closely the model resembles reality. Such a comparison is given in Fig. 7, where we display side by side the , , and color images of the Red Rectangle with the corresponding model images at the same wavelengths. The corresponding near-IR speckle images (with resolutions of 68–76 mas) used to produce the color images were presented in Paper II and Paper III.
The images in Fig. 7 exhibit a broad, relatively flat red plateau roughly 200 mas in size, covering the entire region of the bright lobes and the dark lane between them. The model color distributions in the near-IR bands are clearly consistent with observations. Quantitatively, the reddest model colors of 3.0 mag, 5.4 mag, and 2.5 mag (in , , and ) are similar to those of 2.0 mag, 4.5 mag, and 2.8 mag in the observed images. As the color images were computed from only those parts of the respective , , , and images, where intensities are higher than 5 % of the peaks, the shapes of the outer edges of the color distributions essentially outline the brightest parts of the images. The blue X-shaped spikes are also clearly delineated in the color images. The red plateau marks the position of the very dense, optically thick, inclined torus. The bluer colors outside the dense torus indicate optically thin regions in and around the outflow cavities which scatter the hot radiation of the central stars toward an observer.
3.6 Intensity profiles
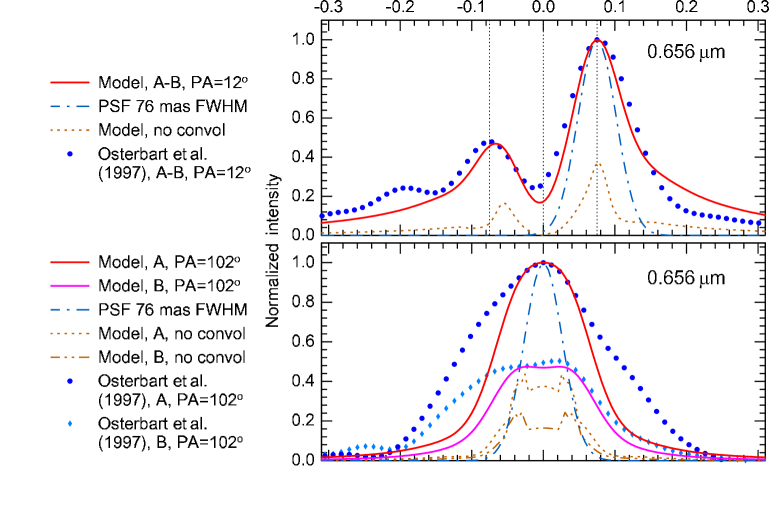
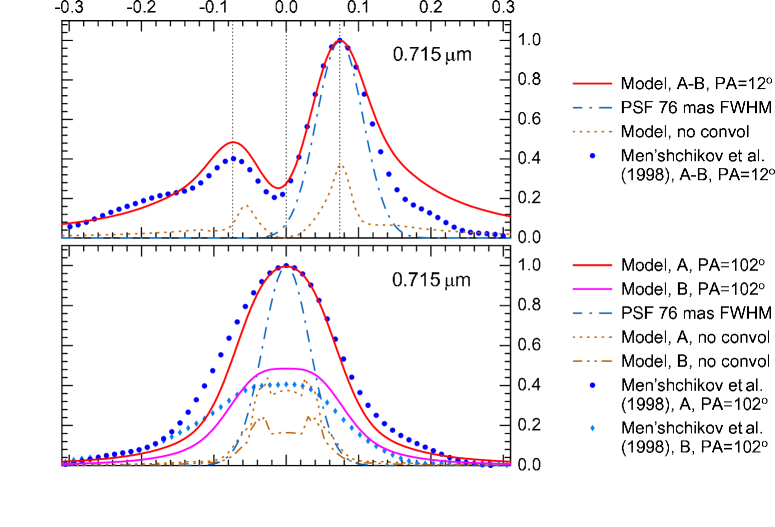
Figure 8 presents a quantitative comparison of the model images with available high-resolution optical and near-IR images of the Red Rectangle in terms of the intensity profiles in two directions, parallel (PA = 12°) and perpendicular (PA = 102°) to the projected symmetry axis of the nebula. The profiles (intensity cuts) were taken from the images of Paper I (RG 656, RG 780), Paper II (RG 715, , ), and Paper III (, , ).
An inspection of the intensity profiles shows that the model is in good agreement with the observed intensity distributions of the Red Rectangle. There are almost no changes in the intensity profiles over all the near-IR wavelengths except for those caused by slightly different resolutions. Such an invariance of the intensity profiles indicates that very large grains dominate the scattered and emitted radiation in the very dense circumbinary torus of the Red Rectangle.
There are considerable discrepancies between the model and observed images at optical wavelengths, where the bright lobes start to appear more diffuse and extended in the direction perpendicular to the symmetry (outflow) axis (see also images in \al@Osterbart_etal1997,Men'shchikov_etal1998; \al@Osterbart_etal1997,Men'shchikov_etal1998, ). In part, these deviations may be due to the approximations we used to describe the model geometry. The model density distribution is assumed to be independent of the polar angle and this assumption might become more important at short wavelengths. We believe, however, that this morphological change can be naturally explained by additional contribution of the extended red emission, known to be present in the Red Rectangle (but not in our model) at the optical wavelengths (0.55–0.75 m). This emission veils the X-shaped spikes, making them appear relatively fainter in the visible than at the near-IR wavelengths, where the extended red emission does not affect the images.
3.7 Comparison with previous models
Our results are consistent with the optical images of the Red Rectangle simulated by Yusef-Zadeh et al. (1984), although the density distribution predicted by our model is more complex than a simple profile assumed in their calculations. The two models have derived a similar bipolar geometry of the dusty envelope with density distributions (almost) independent of the polar angle up to a limiting latitude, where the density drops to zero (or very small values) inside the biconical cavities. The authors assumed a full opening angle of 70° for the cavities, derived from low-resolution optical images (e.g., Cohen et al. 1975). In our model, a smaller opening angle ° was adopted, which is consistent with our new high-resolution images.
The model constructed by Lopez et al. (1997) differs from our model, in part due to the factor of 4 greater resolutions of our new speckle images containing much more detailed information about the physical properties of the nebula. The differences can also be attributed to more extensive exploration of the parameter space in our modeling. The overall geometry of their envelope with bipolar cavities is very similar to the one adopted in Yusef-Zadeh et al. (1984) and in the present modeling, although the density is decreasing almost linearly with the latitude. The radial density distribution adopted by Lopez et al. (1997) (with an order-of-magnitude jump upward beyond AU) is relatively flat, containing most of the mass at the outer boundary. This would have a pronounced effect (by a factor of 2–3) on the beam-matched fluxes at long wavelengths, which their fit of the observed SED did not take into account. Very low densities of the innermost regions in the model are inconsistent with the bipolar appearance of the Red Rectangle in the high-resolution near-IR speckle images shown in Fig. 7.
Our previous model (Paper II) is very similar to the new model presented in this paper. As explained in Sect. 1, the old model was unable to reproduce the shape of the bright lobes of the Red Rectangle in the new Keck telescope images at the wavelengths of 3.1–3.3 m. The model was also not very successful in fitting the observed SED over the UV to optical wavelength range and in explaining the flat distribution of the color image over the bright lobes. All this stimulated us to reconsider all existing observations and construct a more realistic model described in this paper.
4 Discussion
Below we interpret the results of our modeling of the Red Rectangle and discuss the properties and evolution of its close binary and dense circumbinary environment.
4.1 Physical parameters of the binary
The radio emission of a small H II region observed in the Red Rectangle (cf. Sects. 2.3, 3.2) indicates that there is a hot source of ionizing photons in the nebula. However, IUE spectroscopy (Sitko 1983) shows no signature of any hot K companion in the far-UV spectrum of the Red Rectangle, where one would expect to see the peak of its radiation. This fact suggests that the hot invisible component has much lower luminosity than of the observed post-AGB star. Taking into account interstellar extinction in our model (see Sect. 3.2), we can estimate that the well-observed SED sets an upper limit for the hot companion’s luminosity of 100 .
To illustrate this, in Fig. 3 we have added a hot ( K) blackbody to the stellar continuum of the post-AGB object, normalized so as to maximize its luminosity and yet to preserve our model fit of the observed SED. It is this hot additional component that produces rising far-UV fluxes toward the shortest wavelengths ( m) in the stellar continuum and in the model SED with no interstellar reddening. Although the increasing interstellar extinction at these wavelengths (3 mag at 0.12 m) forces the model fluxes to decline, a bump in the SED due to the hot companion remains (Fig. 3). Our normalization implies that the invisible hot component’s luminosity is a factor of at least 60 less luminous than the post-AGB object, giving the upper limit of 100 . Together with the inferred effective temperature of K, this limit marks an area in the Hertzsprung-Russell (HR) diagram populated by cooling white dwarfs with masses (Driebe et al. 1998). This can be interpreted as the evidence that the close binary indeed consists of a post-AGB object and a relatively hot white dwarf.
This idea is further supported by the spectroscopic orbital elements of the binary’s observed component. Van Winckel et al. (1995) determined the orbital period = 298 days and the eccentricity = 0.45, whereas Waelkens et al. (1996) gave = 318 days, and Waters et al. (1998) cited = 0.38. We have recomputed the full set of the latest orbital elements from original measurements (Van Winckel et al. 1995; Waelkens et al. 1996) using the computer code of Tokovinin (1992).
The new orbital elements of HD 44179 are presented in Table 2. With the viewing angle 11° (Fig. 1) and the current mass of the post-AGB star of (see for details Sect. 4.5), the mass function = 0.049 implies that the invisible companion is a low-mass object with . If one adopts a lower-limit effective temperature of K (Sect. 2.3), one gets from the evolutionary tracks of white dwarfs (Driebe et al. 1998) a very low luminosity of for the star. In this paper we assume, however, that the hot component’s luminosity is just at the upper limit of and, therefore, significantly hotter, with K.
| Parameter | Symbol | Value | Error | Units |
|---|---|---|---|---|
| Period | 322 | 2.0 | days | |
| Periastron (JD 244+) | 8075 | 7.0 | days | |
| System velocity | 19.8 | 0.4 | km s-1 | |
| Semiamplitude | 12.2 | 0.5 | km s-1 | |
| Eccentricity | 0.37 | 0.03 | ||
| Semimajor axis | 0.34 | 0.01 | AU | |
| Mass function | 0.049 | 0.006 |
4.2 The bipolar geometry
Despite the narrowness of the dark lane, the circumbinary material we see in the images is definitely not confined to a flat disk. As discussed by Men’shchikov & Henning (2000) and Men’shchikov et al. (2001), the appearance of optically thick structures with bipolar outflow cavities may easily be misleading. The narrow dark lane is a result of the radiation transfer effects, with optical depths along different lines of sight greatly varying in such an axisymmetric density distribution. The narrow dark lane appears quite naturally in bipolar envelopes like the one shown in Fig. 1 even when the “torus” density is independent of the polar angle. This is demonstrated by the model images in Figs. 7, 7 which show very good agreement with observations.
A thin flat disk observed edge-on would appear as an ellipsoidal structure highly elongated at PA 102° (by a factor of 5) perpendicular to the symmetry axis of the nebula, with a narrow and long dark lane (see, e.g., -band model images of a circumstellar disk in Suttner & Yorke 2001). The expected appearance of a thin disk sharply contrasts the observed bipolar brightness distribution extended along the symmetry axis. This rules out the flat disk geometry as a model for the interpretation of the observed properties of the Red Rectangle and other similar bipolar nebulae. Plausible distributions of dusty material may include either a strongly flaring, geometrically very thick disk or a toroidal structure (envelope) with biconical outflow cavities.
We believe that it would be more accurate to describe the circumstellar environment of the Red Rectangle as an envelope with conical cavities, since the term “disk” is usually associated with a thin flat geometry. Many such dense envelopes are known among both young and evolved low-mass stars (L1551 IRS 5, HL Tau, IRC $$+10 216 are just a few of them; e.g., Men’shchikov & Henning 1997; Men’shchikov et al. 1999; White et al. 2000; Men’shchikov et al. 2001). In young stellar objects this geometry is naturally produced by the (radial) collapse of an initially spherical protostar, which eventually creates powerful jets and excavates bipolar (conical) outflows. In old stars this geometry is naturally produced by the high (radial) mass loss they experience on the top of the AGB and by the fast bipolar winds expected at the later stages of their evolution. Close binarity of the stars plays an important role in the creation of such extremely dense, opaque bipolar envelopes, and the Red Rectangle is an outstanding example of such a structure.
4.3 The gas component
Although our model suggests a self-consistent picture of the Red Rectangle explaining a variety of observational data, the modeling was done using only the constraints from the dust continuum radiation (Sect. 2.2). Since the modeling directly predicts only the properties of the binary and its bipolar dusty envelope, discussion of a wealth of information on the molecular and atomic species obtained during the past decades of observations is beyond the scope of this paper. Below we briefly discuss, however, a few aspects related to the circumbinary gas component.
Where is the H II region located in the Red Rectangle? Our model requires such high densities in central regions of the nebula ( cm-3, Sect. 3.3) that the relatively low-luminosity white dwarf would not be able to ionize hydrogen within a radius of 17–170 AU, as seems to be required by the observed radio fluxes (Jura et al. 1997). This is true, however, only for a spherical distribution of circumstellar matter. The Red Rectangle has biconical outflow cavities with much lower densities of cm-3 (Fig. 1, Sect. 3.3). An estimate of the Strömgren sphere radius (Lang 1974) for the parameters of the hot white dwarf (Sect. 4.1) and electron temperature of K, gives AU. This suggests that the H II region fills in the outflow cavity of the dense circumbinary torus of the Red Rectangle.
Optical spectroscopy of the Red Rectangle by Jura et al. (1997) revealed a two-component H emission consisting of a narrow spike of a full width of 20 km s-1 at half-maximum, on top of a broad plateau with a width of 200 km s-1 at zero intensity. Their analysis attributed the slow gas to the extended H II region, whereas the fast-moving ionized gas is likely to be confined to a much smaller zone that fits into the the binary’s orbit. The ultraviolet spectra of CO and C I presented by Glinski et al. (1997) displayed narrow emission lines and wide absorption bands with full widths of 25–30 km s-1 and 230 km s-1, respectively. The narrow emission and wide absorption lines of C I seem to be related to the center of mass of the binary, although the absorption could be assigned to a binary component, too. They noted a similarity of the lines with the two-component H profile observed by Jura et al. (1997), suggesting that the respective narrow and wide lines arise in the same distinct environments.
Clearly, new observations are needed to verify these findings of the high-velocity gas in the Red Rectangle and to place more precise constraints on the spatial distribution of the observed species, before any realistic model could be able to interpret all existing data. Without any possibility to explicitly and self-consistently incorporate the gas components in our dust continuum radiative transfer modeling, there is no way to extract more information on the gases in the Red Rectangle from the model presented in this paper.
4.4 Stability of the thick torus
What keeps the gas and dust components of our model at high latitudes above the midplane, if the configuration is considered as stationary and long-lived, as proposed by Jura et al. (1995)? The torus-like (Fig. 1) dense circumbinary envelope (Fig. 7) of the Red Rectangle does not resemble a flat disk (Sect. 4.2) and it may not necessarily be a stationary, centrifugally-supported configuration. Our model implies that it is a massive, selfgravitating, slowly evolving envelope ejected by the binary components, in which cavities were carved out presumably by a faster bipolar outflow.
The idea of a stable disk in the Red Rectangle was invoked by Waters et al. (1992) to explain an unusual chemical composition of the spectroscopically observed post-AGB star (Van Winckel et al. 1995) that suggested separation of the chemical elements due to the formation of dust and reaccretion of the depleted gas back onto the photosphere (Mathis & Lamers 1992). There is no good reason, however, why the circumbinary material should be necessarily distributed in a thin disk for this mechanism, which is based just on the radiation pressure on dust, to work. A long-lived disk was also proposed by Jura et al. (1995) to explain unusual properties of dust in the Red Rectangle and possibly growth of dust particles to very large sizes of at least 200 m. In a (stationary) disk, the dust grains would have much more time to grow than in the transient conditions of a normal wind of an AGB star, whose density quickly drops as the envelope expands.
The growth rates due to coagulation of grains and accretion of gas atoms on the grain surface is proportional to the rate of collisions and, therefore, to the gas and dust densities. As an example, the time scale (in years) for a grain to grow by accretion to a radius can be written as
| (2) |
where is the grain material density, is the number density of H atoms, is the kinetic gas temperature, and a sticking probability of 0.1 and an abundance of of the accreted atoms were adopted. The high densities in the torus of the Red Rectangle (Sect. 3.3) imply years for large dust particles to grow by accretion. This illustrates the possibility of a very rapid coagulation and growth of grains, on a crossing time scale of the dense toroidal envelope ( 100 years, Fig. 4). Thus, there seems to be no need in a long-lived, rotating disk in the Red Rectangle to grow millimeter-sized dust particles.
Although the dense environment is probably not supported by the centrifugal forces, the toroidal envelope may well be quasi-static, balanced against the gravity by the gas pressure and by the radiation pressure on dust grains. The free-fall time scale for the gas component can be estimated from
| (3) |
where is the outer radius of the dense torus and is the mass inside it (as before, is the mass of the torus). Substituting the model values, we find a free-fall time years. The dynamical expansion time scale of the torus due to the gas pressure can be expressed as
| (4) |
As before, assuming that the gas temperature is equal to the dust temperature of K, we find years. The order-of-magnitude comparison suggests that the gas component may be in a quasi-hydrostatic equilibrium.
Estimating the maximum radius of dust particles that can be removed by the radiation pressure of the central star, we get an upper limit of
| (5) |
where is the total mass within the radius . For the high luminosity of the Red Rectangle derived in this modeling, the condition for dust grains to be gravitationally bound requires particles with cm at the inner dust boundary ( AU), where . Since , the same condition of gravitationally bound grains at requires particles with cm. In our model, the radiation pressure cannot remove dust particles with cm from the dense torus. The gravitation and radiation pressure on dust grains seem to balance each other in the envelope, causing its very slow quasi-static evolution.
The dust grains outside the dense torus ( AU) have a normal size distribution in the model, therefore they are more efficiently accelerated by the radiation pressure and can drive a bipolar outflow. This can explain the observation by Jura et al. (1995) that the CO emission in the Red Rectangle is associated with the center of the mass of the binary and that it resembles a bipolar outflow with a speed of 7 km s-1.
4.5 Evolution of the binary
The presence of a large amount of matter in the close vicinity of the binary nucleus of the Red Rectangle suggests that the origin of the nebula may be associated with an unstable mass loss which accompanied formation of the post-AGB star, as noticed by Osterbart et al. (1997). This “unstable mass loss” may be related to the ejection of a common envelope in a close binary (Bond & Livio 1990; Yungelson et al. 1993). Thus we may consider an evolutionary scenario in which one component of a binary first forms a low-mass He or CO white dwarf, while another becomes an AGB star and then a CO dwarf, ejecting the currently observed envelope. In our analysis we followed the general outlines of the work of Nelemans et al. (2000) on reconstruction of the evolution of close binary white dwarfs. For the evaluation of the lifetimes, radii, luminosities, and core masses of the AGB stars we used the SSE package (Hurley et al. 2000). These quantities slightly depend on the specific prescriptions for mass loss adopted by Hurley et al. (2000).
In our discussion, the following notation is adopted. The initial masses of the components (on the main sequence) are and () and their initial separation is . The mass of the primary after Roche lobe overflow (RLOF) is and the separation of the components is . The mass of the secondary prior to RLOF is , its radius is , and the components’ separation prior to the overflow is . After the RLOF, the mass of the secondary component is (we consider the present post-AGB star as a nascent white dwarf) and the final separation of the components is . We attempted to reconstruct the formation of the binary of the Red Rectangle starting from the present configuration and “evolving” the system back in time toward the main sequence, to derive the initial parameters of the components.
Changes of the components’ separation in the common envelope (CE) formed after the RLOF by the AGB star may be described by the equation of the balance of the binding energy of the giant’s envelope and the difference of the orbital energies of the pre- and post-CE binary (Webbink 1984):
| (6) |
Here is a dimensionless factor which allows one to express the binding energy of the envelope as a function of , , and (de Kool 1990). It depends on the structure of the stellar envelope, being a function of the evolutionary stage of the donor (see Dewi & Tauris 2000; Tauris & Dewi 2001). The parameter represents the efficiency of the orbital energy deposition into the common envelope, depending also on the structure of the donor and the nature of the accretor. At the present state of the art in stellar evolution theory, one cannot disentangle these two parameters and it is reasonable to treat the product as a single parameter.
The effective temperature K of the post-AGB object suggests that it is now on the horizontal part of the white dwarf cooling track, therefore we can assume that the present is close to its luminosity before the CE ejection. Using “tracks” constructed by the SSE package, we estimate the mass , core mass , and radius of the star at the moment when its luminosity is equal to the present value. We make then the usual assumption that . The analysis shows that the initial mass of the main-sequence progenitor of the post-AGB object had to be greater than 1.5 , since stars with lower masses do not reach .
One can also obtain an upper limit for the initial mass of the post-AGB object. Since the r.h.s. of Eq. (6) must be positive, we obtain the condition . Assuming that the present mean separation of the components in the Red Rectangle represents the post-CE value of , we derive . The narrow range of possible initial masses for the present post-AGB object implies that now its mass is . Then the mass function and the inclination of the orbit provide the mass of the first-formed white dwarf.
The secondary component lost an amount of mass as stellar wind, predominantly at the AGB stage. This widened the orbit, as the product of the separation and total mass was conserved. At the onset of the RLOF, the stellar radius was equal to the radius of the Roche lobe, for which one can write (e.g., Paczyński 1967)
| (7) |
where is the separation of components, and are the masses of the donor and accretor, respectively. Substituting , , and in Eq. (7), one can obtain an estimate of the separation of the components 670–590 (3.1–2.7 AU) prior to the RLOF, for the initial masses of 1.5–1.9 .
The mass of the first white dwarf suggests that it is a helium white dwarf descending from a red giant with , which had a degenerate helium core. The radii of such stars depend only on the core mass (Refsdal & Weigert 1970). As for the secondary, we assume that the dwarf’s mass is equal to the mass of the helium core of its progenitor. Then one can estimate the radius of the primary at the onset of the RLOF using, e.g., the core mass - stellar radius relation for giants of solar chemical composition (Iben & Tutukov 1985): . The radius of the giant with a 0.35 helium core was and the star should have had a deep convective envelope (more than 50 % of the mass in the outer convective zone, see the models of Mengel et al. 1979). Then the RLOF results in an unstable mass loss on a time scale intermediate between the thermal and dynamical ones. Nelemans et al. (2000) have shown that, for comparable masses of the donor and accretor, the unstable loss of the stellar envelope most probably happens without spiral-in.
The effect of the mass loss can be described in terms of the balance of the angular momentum. Following Paczyński & Ziółkowski (1967), one may assume that the losses of mass and orbital angular momentum are related in a linear way, . Here and are the orbital angular momenta of the binary before and after the mass loss, is the mass lost from the system, and is the total initial mass of the binary. The separation of components changes as
| (8) |
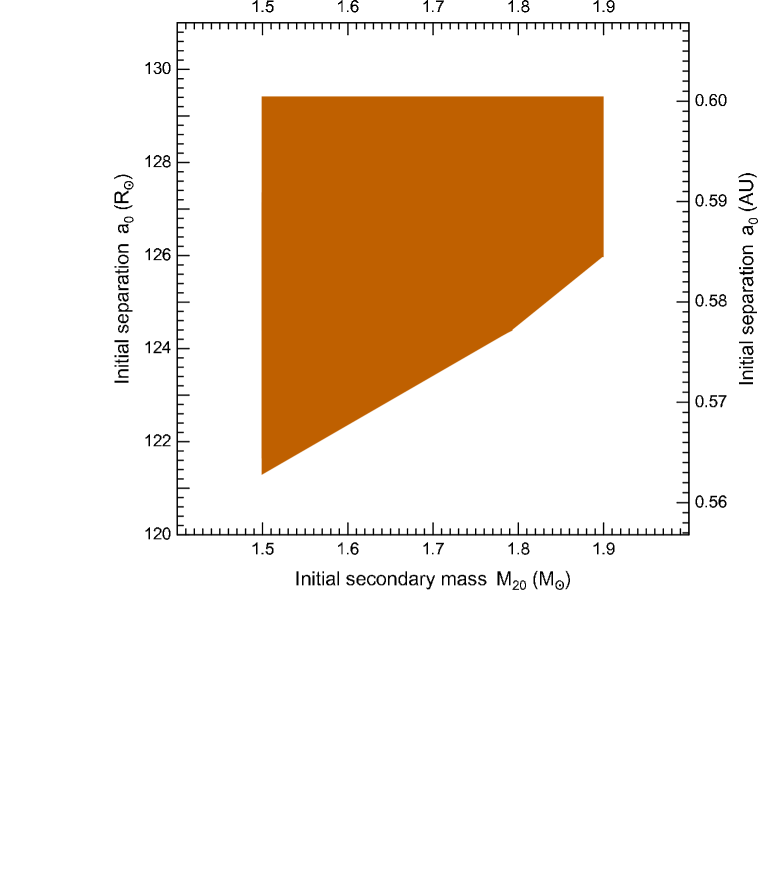
where is the mass of the secondary after the first mass-loss episode. For the stars in the mass range under consideration, a difference of, e.g., only in initial mass is sufficient for the primary to complete its evolution in the red giants branch, while the secondary is still a main-sequence star. Therefore we can expect that the amount of accreted matter in the first mass loss episode in the system was negligible, i.e. that , . Equation (8) allows us to find the separation of components of the initial binary if is known. On the other hand, can be found for any using the core mass - radius relation and Eq. (7), since . This enables us to estimate the range of the parameter . The solutions were obtained for 1.0–1.3, which are marginally compatible with the estimates derived by Nelemans et al. (2000) for low-mass close double white dwarfs. The range of for different is shown in Fig. 9.
Several cautionary notes should be made on the analysis. In our scenario, the combined parameter in Eq. (6) has to be . This may suggest that the release of the internal thermodynamic energy may be involved in unbinding the envelope (Han et al. 1994, 1995). Although the values of the structural parameter have never been derived for stars with , large values of may be characteristic for the tip of the AGB (see Dewi & Tauris 2000). In addition, on the AGB the effect of the orbital shrinkage may be somewhat offset by the wind outflow, as has been noticed by Iben (2000). Strictly speaking, Eq. (6) becomes then invalid, but effectively this would imply an increase of .
Our estimate of is compatible as well with an assumption that this dwarf is a descendant of a star with an initial mass of about 2.5–3 , which overfilled the Roche lobe prior to the helium ignition in the core and produced a helim star that later became a CO dwarf (Iben & Tutukov 1985; Han et al. 2000). However, for the formation of a 0.35 dwarf the RLOF had to occur when and the resulting separation of components would not be sufficient to harbor an AGB star with a 0.57 core.
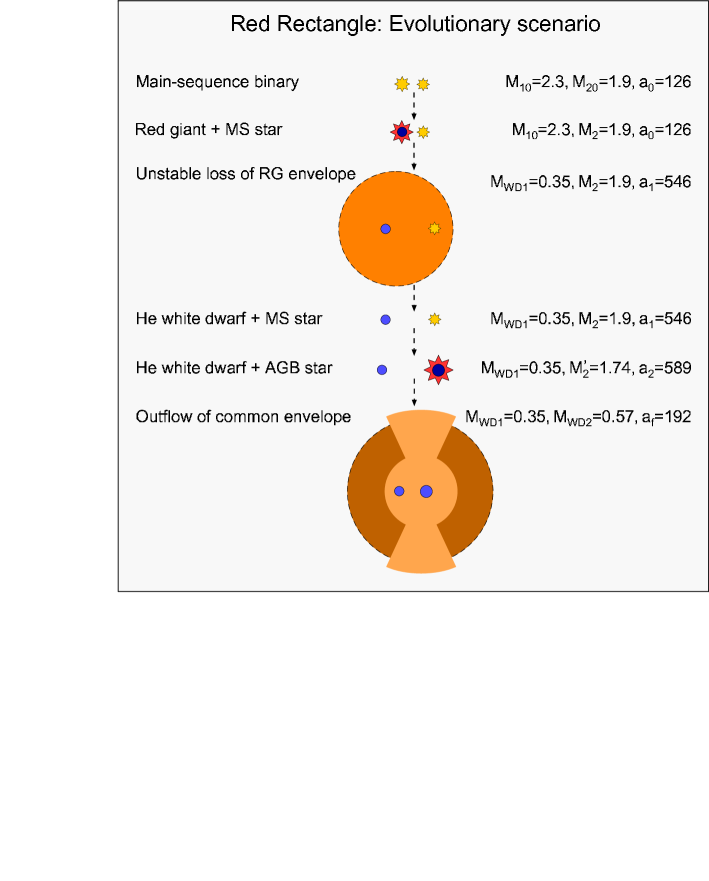
The RLOF occurs close to the tip of AGB and some mass at this evolutionary stage has already been lost by stellar wind. For the initial masses of 1.5–1.9 of the post-AGB object in the Red Rectangle, this amounts to the loss of 0.35–0.16 . The mass of the common envelope is therefore constrained to 0.58–1.17 in our evolutionary scenario. This value derived from the above analysis allowed us to constrain the dust-to-gas mass ratio in a way similar to the approach used in our model of IRC $$+10 216 (Men’shchikov et al. 2001). In fact, from our continuum radiative transfer modeling we know the total mass of dust in the Red Rectangle, which is contained in the dense torus. The estimated range of possible masses of the circumbinary torus implies that = 0.021–0.01, rather high values compared to the usual 0.003 in the winds of single mass-losing AGB stars. The higher value seems to be too high considering the abundances of elements that can make up dust grains. We therefore adopted in this study the lower end of the interval, = 0.01, which corresponds to the total torus mass and the initial mass of the star.
Figure 10 illustrates and summarizes the evolutionary scenario presented above. The initial masses of the components in the progenitor binary system of the Red Rectangle are very similar to each other, but not equal. Whereas a 2.3 star completes its evolution to the tip of the red-giant branch in about 800 Myr, a 1.9 star evolves to the tip of AGB in 1600 Myr. Thus, there may be a difference of about 800 Myr in the ages of the binary components of the Red Rectangle. Within this time a helium white dwarf would cool down to (Driebe et al. 1998). If its present luminosity has indeed a much higher value of , this might mean that the He white dwarf has accreted some hydrogen from the AGB star wind and experienced one or several hydrogen-burning flashes. Then the latter brought it close to the high luminosity and temperature “knee” of the cooling track again.
4.6 Eccentricity of the orbit
It is well known that tidal interactions in close binaries tend to quickly circularize their orbits. The large eccentricity = 0.37 of the close binary in the Red Rectangle has been interpreted in two different ways. Van Winckel et al. (1995) suggested that increased mass loss, when the star passes periastron, may be the process responsible for the increased eccentricity, whereas in a later paper (Waelkens et al. 1996), the authors suggested that gravitational interaction of the binary with the circumbinary disk may be the reason. Recently, Soker (2000) argued that it is the mass loss at periastron which increases the binary eccentricity and that the inner disk mass is too small for the other mechanism to be efficient in this and other similar objects.
In our analysis, the initial orbit of the binary is circular. It is usually assumed that the unstable mass loss by Roche lobe filling stars does not produce eccentric orbits. However, the dynamical time scale for the AGB star was shorter than the orbital period of the binary and we may speculate that the relatively fast loss of the envelope made the orbit elliptic. Later, the eccentricity can increase as a result of the binary-disk interaction.
Our modeling has shown that the torus’ mass in the Red Rectangle may be large enough to account for the eccentricity changes. The mass in question resides inside a radius of and it must be sufficiently large for the circumbinary disk to efficiently drive the increasing eccentricity (Artymowicz et al. 1991). A lower bound on the model torus mass within this radius can be found by extrapolating the density at the inner dust boundary ( g cm-3) into the dust-free zone. This gives a mass of 0.001 and a disk-to-binary mass ratio of the same order. Assuming an initial eccentricity of 0.1, we find from (Artymowicz et al. 1991) a high rate of changes on a time scale of yr. We note, however, that this estimate is just an illustration and that it remains far from being certain that this specific mechanism, assumptions, and formulae are applicable for the binary’s environment existing in the Red Rectangle.
5 Conclusions
Recent diffraction-limited near-IR speckle images of the Red Rectangle in the wavelength range 2.1–3.3 m with angular resolutions of 44–68 mas (Paper III) as well as the previous optical and near-IR speckle images at 0.7–2.2 m (\al@Osterbart_etal1997,Men'shchikov_etal1998; \al@Osterbart_etal1997,Men'shchikov_etal1998) revealed a geometrically thick circumbinary torus with bipolar outflow cones and X-shaped spikes originating deep inside the cavities. This multiwavelength set of high-resolution images enabled us to reanalyze most of the existing observations using our two-dimensional radiative transfer code. Results of this study are summarized below.
Distance. An important by-product of the modeling of the Red Rectangle is a new determination of its distance pc (with model uncertainties of about 10 %), which is twice as large as the commonly adopted value of 330 pc (Sect. 2.4). The new distance, based on the account for interstellar extinction in our model (Sects. 2.4, 3.2), is consistent with high luminosities expected from the stellar evolution theory. Based on this distance, we reconstructed physical parameters of the binary and its circumbinary torus (Table 1).
Close binary. In our model, the observed component of the spectroscopic binary is a luminous, low-mass post-AGB star with , K, and . It is a product of the mass loss by the secondary component in a close binary system. We identified the now invisible descendant of the primary component with a relatively hot white dwarf with 0.35 , K, and 100 . The presence and parameters of the compact degenerate star in the close binary HD 44179 have been deduced (Sect. 4.1) from (1) the spectroscopic mass function = 0.049 , (2) presence of a compact H II region ionized by a hot source of radiation, (3) upper limit of the contribution of the hot object to the continuum in the far UV.
Circumbinary structure. The intensity distribution of the high-resolution images is definitely inconsistent with the flat disk geometry frequently used to visualize bipolar nebulae (Sect. 4.2). A geometrically very thick density distribution of a compact, dense torus with biconical outflow cavities (Fig. 1) is best suitable for reproducing the observed images. The opening angle of the cavities is 50° and the observer’s viewing angle is 11° below the midplane.
Density distribution. Although the nebula extends to at least AU from the central binary, most of its mass of is contained in the extremely dense torus having an outer radius of 100 AU (Sect. 3.3). The inner dust boundary of the torus is located at a distance AU from the center, where gas densities reach values of g cm-3 ( cm-3). The density of the outflow cavities is many orders of magnitude lower than the torus density in the region dominated by the dense torus (Fig. 4), whereas in the outer regions ( 800 AU) the outflow cones are denser than the rest of the toroidal envelope.
Dust properties. Our model of dust in the circumbinary torus of the Red Rectangle has two distinct components whose chemical composition is not constrained by observations. Amorphous carbon grains with radii in the range of 0.005–600 m and typical interstellar size distribution exist mainly in the outer regions of the toroidal envelope ( AU). Most of the dust mass is contained in very large ( = 0.2 cm) particles of the massive, dense torus, which produce an almost gray optical depth of . Although there exist more dust components somewhere in the nebula, including crystalline silicates and PAHs, their mass must be small compared to the mass of the very large particles, which dominate the observed appearance of the Red Rectangle.
Evolution of the binary. Based on our estimates of the masses of the Red Rectangle binary components, their separation and luminosities, we suggest an evolutionary scenario for the formation of the nebula, in which components had initial masses of about 2.3 and 1.9 and a separation of . The scenario associates the formation of the Red Rectangle nebula with the ejection of the common envelope upon the Roche lobe overflow by the present post-AGB star.
Acknowledgements.
We are grateful to Viktor Malanushenko for the assistance in computing the orbital parameters, to Anatoly Miroshnichenko for his help in the derivation of the observational estimate of the interstellar reddening, and to Jarrod Hurley for providing the SSE package. LRY was supported by the Russian “Astronomy and Space Research” program. This research has made use of the SIMBAD database operated at CDS, Strasbourg, France, and of the data products from the Two Micron All Sky Survey, which is a joint project of the University of Massachusetts and the Infrared Processing and Analysis Center, funded by the National Aeronautic and Space Administration and the National Science Foundation. We thank the referee, Michael Barlow, for his very useful comments.References
- Artymowicz et al. (1991) Artymowicz, P., Clarke, C. J., Lubow, S. H., & Pringle, J. E. 1991, ApJ, 370, L35
- Bohlin et al. (1978) Bohlin, R. C., Savage, B. D., & Drake, J. F. 1978, ApJ, 224, 132
- Bond & Livio (1990) Bond, H. E. & Livio, M. 1990, ApJ, 355, 568
- Cardelli et al. (1989) Cardelli, J. A., Clayton, G. C., & Mathis, J. S. 1989, ApJ, 345, 245
- Cohen et al. (1975) Cohen, M., Anderson, C. M., Cowley, A., et al. 1975, ApJ, 196, 179
- Cruzalébes et al. (1996) Cruzalébes, P., Tessier, E., Lopez, B., Eckart, A., & Tiphéne, D. 1996, A&AS, 116, 597
- de Kool (1990) de Kool, M. 1990, ApJ, 358, 189
- Dewi & Tauris (2000) Dewi, J. D. M. & Tauris, T. M. 2000, A&A, 360, 1043
- Driebe et al. (1998) Driebe, T., Schönberner, D., Blöcker, T., & Herwig, F. 1998, A&A, 339, 123
- Glinski et al. (1997) Glinski, R. J., Lauroesch, J. T., Reese, M. D., & Sitko, M. L. 1997, ApJ, 490, 826
- Greaves & Holland (1997) Greaves, J. S. & Holland, W. S. 1997, A&A, 327, 342
- Han et al. (1994) Han, Z., Podsiadlowski, P., & Eggleton, P. P. 1994, MNRAS, 270, 121
- Han et al. (1995) —. 1995, MNRAS, 272, 800
- Han et al. (2000) Han, Z., Tout, C. A., & Eggleton, P. P. 2000, MNRAS, 319, 215
- Hurley et al. (2000) Hurley, J. R., Pols, O. R., & Tout, C. A. 2000, MNRAS, 315, 543
- Iben (2000) Iben, I. 2000, in ASP Conf. Series, Vol. 199, Asymmetrical Planetary Nebulae II: From Origins to Microstructures (Astronomical Society of the Pacific), 107
- Iben & Tutukov (1985) Iben, I. & Tutukov, A. V. 1985, ApJS, 58, 661
- Jura et al. (1995) Jura, M., Balm, S. P., & Kahane, C. 1995, ApJ, 453, 721
- Jura & Turner (1998) Jura, M. & Turner, J. 1998, Nat, 395, 144
- Jura et al. (1997) Jura, M., Turner, J., & Balm, S. P. 1997, ApJ, 474, 741
- Kerr et al. (1999) Kerr, T. H., Hurst, M. E., Miles, J. R., & Sarre, P. J. 1999, MNRAS, 303, 446
- Kilkenny et al. (1985) Kilkenny, D., Whittet, D. C. B., Davies, J. K., et al. 1985, S. Afr. Astron. Obs., Circ., 9, 55
- Knapp et al. (1995) Knapp, G. R., Bowers, P. F., Young, K., & Phillips, T. G. 1995, ApJ, 455, 293
- Knapp et al. (2000) Knapp, G. R., Crosas, M., Young, K., & Ivezić, Z. 2000, ApJ, 534, 324
- Kurucz (1993) Kurucz, R. L. 1993, Kurucz CD-ROM No. 13 (Cambridge: Smithsonian Astrophysical Observatory)
- Lang (1974) Lang, K. R. 1974, Astrophysical Formulae (Berlin: Springer)
- Leinert & Haas (1989) Leinert, C. & Haas, M. 1989, A&A, 221, 110
- Lopez et al. (1997) Lopez, B., Tessier, E., Cruzalèbez, P., Lefèvre, J., & Le Bertre, T. 1997, A&A, 322, 868
- Mathis & Lamers (1992) Mathis, J. S. & Lamers, H. J. G. L. M. 1992, A&A, 259, L39
- Mengel et al. (1979) Mengel, J. G., Demarque, P., Sweigart, A. V., & Gross, P. G. 1979, A&AS, 40, 733
- Men’shchikov et al. (2001) Men’shchikov, A. B., Balega, Y. Y., Blöcker, T., Osterbart, R., & Weigelt, G. 2001, A&A, 368, 497
- Men’shchikov et al. (1998) Men’shchikov, A. B., Balega, Y. Y., Osterbart, R., & Weigelt, G. 1998, NewAst, 3, 601, (Paper II)
- Men’shchikov & Henning (1997) Men’shchikov, A. B. & Henning, T. 1997, A&A, 318, 879
- Men’shchikov & Henning (2000) Men’shchikov, A. B. & Henning, T. 2000, in Darwin and Astronomy – The Infrared Space Interferometer, ed. B. Schürmann, Proc. Conf. “Darwin and Astronomy”, Stockholm, 17–19 Nov. 1999 (ESA SP–451, May 2000) (Noordwijk: ESA Publications Division), 125
- Men’shchikov et al. (1999) Men’shchikov, A. B., Henning, T., & Fischer, O. 1999, ApJ, 519, 257
- Morris (1981) Morris, M. 1981, ApJ, 249, 572
- Nelemans et al. (2000) Nelemans, G., Verbunt, F., Yungelson, L. R., & Portegies Zwart, S. F. 2000, A&A, 360, 1011
- Osterbart et al. (1997) Osterbart, R., Langer, N., & Weigelt, G. 1997, A&A, 325, 609, (Paper I)
- Paczyński (1967) Paczyński, B. 1967, Acta Astron., 17, 287
- Paczyński & Ziółkowski (1967) Paczyński, B. & Ziółkowski, J. 1967, Acta Astron., 17, 7
- Perkins et al. (1981) Perkins, H. G., Scarrott, S. M., Murdin, P., & Bingham, R. G. 1981, MNRAS, 196, 635
- Perryman et al. (1997) Perryman, M. A. C., Lindegren, L., Kovalevsky, J., et al. 1997, A&A, 323, L49
- Reese & Sitko (1996) Reese, M. D. & Sitko, M. L. 1996, ApJ, 467, L105
- Refsdal & Weigert (1970) Refsdal, S. & Weigert, A. 1970, A&A, 6, 426
- Sánchez Contreras et al. (1998) Sánchez Contreras, C., Alcolea, J., Bujarrabal, V., & Neri, R. 1998, A&A, 337, 233
- Schmidt et al. (1980) Schmidt, G. D., Cohen, M., & Margon, B. 1980, ApJ, 239, L133
- Sitko (1983) Sitko, M. L. 1983, ApJ, 265, 848
- Soker (2000) Soker, N. 2000, A&A, 357, 557
- Straizhis (1977) Straizhis, V. 1977, Multicolor Stellar Photometry (Vilnius: Mocslas Publ.)
- Suttner & Yorke (2001) Suttner, G. & Yorke, H. W. 2001, ApJ, 551, 461
- Tauris & Dewi (2001) Tauris, T. & Dewi, J. D. M. 2001, A&A, 369, 170
- Tokovinin (1992) Tokovinin, A. 1992, in Complementary Approaches to Double and Multiple Star Research, ed. H. A. McAlister & W. I. Hartkopf, IAU Colloq. 135, ASP Conf. Series (San Francisco: Astronomical Society of the Pacific), 573
- Tuthill et al. (2002) Tuthill, P. G., Men’shchikov, A. B., Schertl, D., et al. 2002, A&A, (Paper III, in press)
- Van Winckel (2001) Van Winckel, H. 2001, Ap&SS, 275, 159
- Van Winckel et al. (1995) Van Winckel, H., Waelkens, C., & Waters, L. B. F. M. 1995, A&A, 293, L25
- Waelkens et al. (1992) Waelkens, C., Van Winckel, H., Trams, N. R., & Waters, L. B. F. M. 1992, A&A, 256, L15
- Waelkens et al. (1996) Waelkens, C., Van Winckel, H., Waters, L. B. F. M., & Bakker, E. J. 1996, A&A, 314, L17
- Waters et al. (1992) Waters, L. B. F. M., Trams, N. R., & Waelkens, C. 1992, A&A, 262, L37
- Waters et al. (1998) Waters, L. B. F. M., Waelkens, C., Van Winckel, H., et al. 1998, Nat, 391, 868
- Webbink (1984) Webbink, R. F. 1984, ApJ, 277, 355
- White et al. (2000) White, G., Liseau, R., Men’shchikov, A. B., et al. 2000, A&A, 741, 364
- Yungelson et al. (1993) Yungelson, L. R., Tutukov, A. V., & Livio, M. 1993, ApJ, 418, 794
- Yusef-Zadeh et al. (1984) Yusef-Zadeh, F., Morris, M., & White, R. L. 1984, ApJ, 278, 186