Planetary Nebulae As Standard Candles. XII.
Connecting the Population I and Population II Distance Scales
Abstract
We report the results of [O III] surveys for planetary nebulae (PNe) in six galaxies: NGC 2403, NGC 3115, NGC 3351, NGC 3627, NGC 4258, and NGC 5866. Using on-band/off-band [O III] images, as well as images taken in H, we identify samples of PNe in these galaxies and derive their distances using the planetary nebula luminosity function (PNLF). We then combine these measurements with previous data to compare the PNLF, Cepheid, and surface brightness fluctuation (SBF) distance scales. We use a sample of 13 galaxies to show that the absolute magnitude of the PNLF cutoff is fainter in small, low-metallicity systems, but the trend is well modeled by the theoretical relation of Dopita, Jacoby, & Vassiliadis (1992). When this metallicity dependence is removed, the scatter between the Cepheid and PNLF distances becomes consistent with the internal errors of the methods and independent of any obvious galaxy parameter. We then use these data to recalibrate the zero point of the PNLF distance scale. We use a sample of 28 galaxies to show that the scatter between the PNLF and SBF distance measurements agrees with that predicted from the techniques’ internal errors, and that there is no systematic trend between the distance residuals and stellar population. However, we also find that the PNLF and SBF methods have a significant scale offset: Cepheid-calibrated PNLF distances are, on average, mag smaller than Cepheid-calibrated SBF distances. We discuss the possible causes of this offset, and suggest that internal extinction in the bulges of the SBF calibration galaxies is the principle cause of the discrepancy. If this hypothesis is correct, then the SBF-based Hubble Constant must be increased by . We also use our distance to NGC 4258 to argue that the short distance scale to the LMC is correct, and and that the global Hubble Constant inferred from the HST Key Project should be increased by to km s-1 Mpc-1.
1 Introduction
The past two decades has seen remarkable progress in the measurement of the distance scale of the universe. In the early and mid-1980’s, values of the Hubble Constant ranged over a factor of two, from km s-1 Mpc-1 (e.g., Kraan-Korteweg, Cameron, & Tammann, 1988; Sandage & Tammann, 1982) to km s-1 Mpc-1 (e.g., de Vaucouleurs, 1985; Huchra, 1987), with the results depending strongly on the the author and the technique. However, in the early 1990’s, measurements of began to converge (Jacoby et al., 1992), and it became increasingly difficult to argue for values much different than km s-1 Mpc-1. Today, due in large part to the Hubble Space Telescope Distance Scale Key Project, a value of between 65 and 75 km s-1 Mpc-1 is generally accepted (Freedman et al., 2001).
Nevertheless, there are still two lingering problems with the current distance scale. The first concerns the zero point of the Cepheid period-luminosity relation. There are two galaxies whose distances are known from direct geometric techniques: the Large Magellanic Cloud (via the light echo of SN 1987A; Panagia et al., 1991; Gould & Uza, 1998), and NGC 4258 (through the observed motions of its nuclear maser; Herrnstein et al., 1999). The former sets the zero point for the Cepheid scale; the latter provides an independent test of the technique. Unfortunately, the Cepheid distance to NGC 4258 given by Freedman et al. (2001) is larger than the galaxy’s geometric distance (Herrnstein et al., 1999). This marginally significant discrepancy may indicate a problem for the zero point of the system.
The second limitation of the Cepheid distance scale is its limited applicability to Population II distance techniques. For example, the calibration of the elliptical galaxy fundamental plane (Kelson et al., 2000; Freedman et al., 2001) rests largely on the assumption that the early-type galaxies of Leo I, Fornax, and Virgo are at the same distance as the clusters’ spirals. In the case of Virgo at least, this is likely not the case (Ciardullo et al., 1998; West & Blakeslee, 2000). Similarly, the zero point of the surface brightness fluctuation (SBF) technique (Ferrarese et al., 2000b; Tonry et al., 2001; Freedman et al., 2001) is set by just six Cepheid calibrators. Given the susceptibility of the SBF method to the effects of interstellar extinction, this situation is not ideal. Clearly, additional calibrators are needed to secure the Pop II side of the distance ladder.
The planetary nebula luminosity function (PNLF) has the potential to provide these calibrations. As the only general purpose standard candle that is applicable to both spiral and elliptical galaxies, the PNLF provides a critical link between the Pop I and Pop II distance scales. Moreover, since the precision of the PNLF method is comparable to that of Cepheids (Jacoby et al., 1992), the technique can also be used to check for anomalous measurements in the distance ladder. In fact at present, the PNLF is the only method capable of confirming the results obtained from Cepheid variables. Finally, the PNLF can provide distances to some intermediate objects that are too dusty or irregular for Pop II techniques, but not suitable for Cepheid observations.
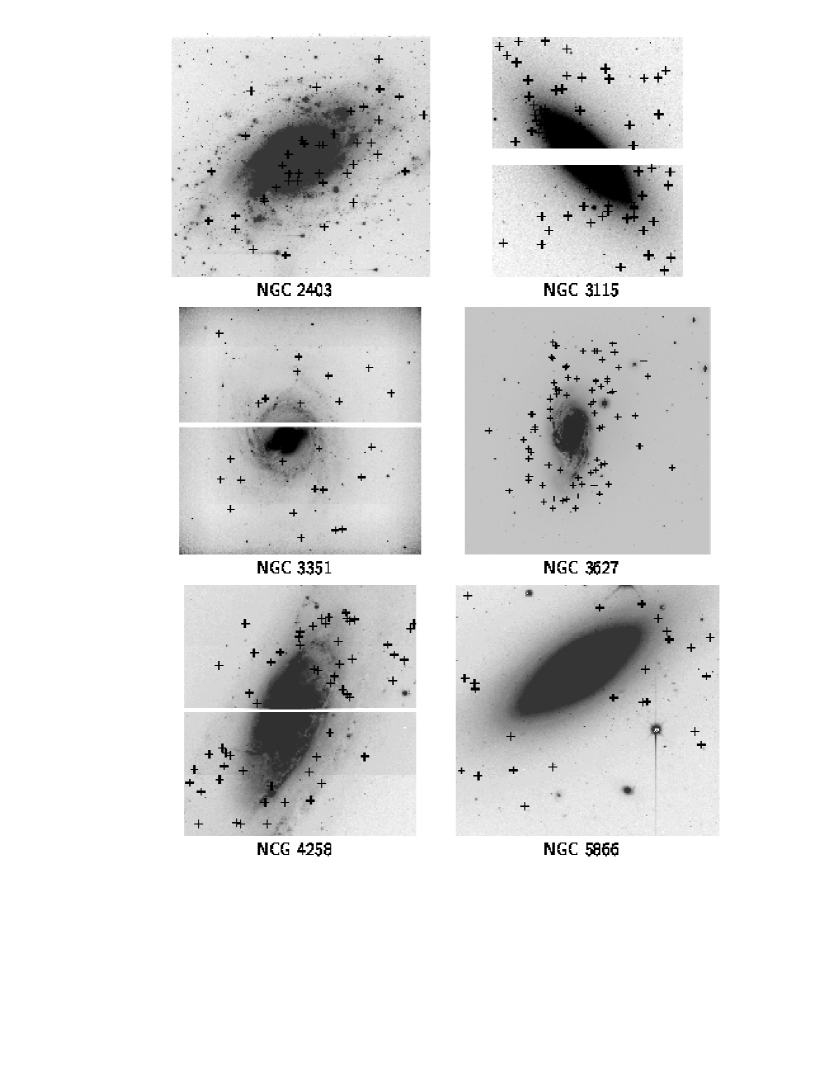
In this paper, we present the PNLFs of six galaxies, NGC 2403, 3115, 3351, 3627, 4258, and 5866, and use these data to search for systematic errors in the extragalactic distance ladder. In Section 2, we describe our observations, detail our reduction procedures, and present the coordinates and [O III] magnitudes of our planetary nebula candidates. We also present new [O III] and H observations of PNe in the inner bulge of M31; these data are used in Section 3 to create a quantitative criterion for discriminating PNe from compact H II regions. In Section 4, we derive PNLF distances to our six galaxies, and comment on the properties of these systems. Included in this section is a discussion of the distance to NGC 4258; our value, combined with that obtained from the Cepheids, argues for a Hubble Constant that is larger than that given by the HST Key Project (Freedman et al., 2001). In Section 5, we combine our distances to NGC 2403, 3351, 3627, and 4258 with data from nine other Cepheid galaxies to re-define the zero point of PNLF distance scale. We show that the absolute magnitude of the PNLF bright-end cutoff does shift to fainter magnitudes at extremely low metallicity; this is in agreement agreement with the theoretical predictions of Dopita, Jacoby, & Vassiliadis (1992). However, we show that in metal-rich galaxies, the PNLF-Cepheid residuals show no statistically significant trend. In Section 6, we compare the PNLF distance scale with that of the SBF method, and show that there is a significant scale error between the two techniques. Specifically, we show that, although the PNLF-SBF residuals do not correlate with any galaxy property, the overall PNLF scale is mag shorter than the SBF scale. Finally, we conclude by considering the possible causes of this discrepancy, and discussing the implications it has for tip of the red giant branch (TRGB) distance measurements and the extragalactic distance scale in general.
2 Observations and Reductions
Several different telescope/detector configurations were used in this program. Four galaxies were observed with the Kitt Peak 4-m telescope: NGC 3115, with a RCA CCD (43 e- readnoise), NGC 5866 with an TI CCD (binned , 4 e- readnoise), and NGC 2403 and NGC 3627 with the T2KB CCD (4 e- readnoise). Two other galaxies, NGC 3351 and NGC 4258, were observed with the Mini-Mosaic camera of WIYN; this instrument employs two 4K 2K CCDs covering a field-of-view of , with a gap between detectors. Finally, in order to define a quantitative criterion for discriminating planetary nebulae from compact H II regions, the inner bulge of M31 was observed with the Kitt Peak 2.1-m telescope and a Tektronix detector. This setup allowed us to survey the central region of the galaxy and measure monochromatic fluxes for PNe mag down the [O III] luminosity function. A log of our observations and the details of the CCDs are given in Table 1.
Our survey technique was similar to that described in previous papers of the series (Jacoby et al., 1989; Ciardullo, Jacoby, & Ford, 1989; Feldmeier, Ciardullo, & Jacoby, 1997). First, a narrow-band filter was selected which passed the [O III] emission line at the redshift of the target galaxy. For M31, 2403, and 4258, the filters used were the standard narrow-band [O III] filters available at NOAO; for the remaining galaxies, custom-made filters were used. The filter names or bandpasses (central wavelength and full-width-half-maximum (FWHM) at ambient temperature in the converging beam of the telescope) are given in Table 1. Note that for NGC 3351, our filter vignetted roughly half of the WIYN camera’s field-of-view. This did not compromise our survey, however, since the unvignetted field-of-view () was reasonably well matched to the diameter of the galaxy.
For each galaxy, a series of exposures was taken through the on-band [O III] and a wider off-band filter (, FWHM Å). In addition, in order to discriminate PNe from H II regions, the late-type spirals were also imaged through a 75 Å wide filter centered on H. The total on-band and H exposure times are listed in Table 1. In general, the off-band exposures were scaled to go mag deeper than their on-band counterparts and were therefore four to seven times shorter. All frames were reduced using standard IRAF routines: the images were bias-subtracted and flat-fielded using CCDPROC, aligned to a common astrometric system with GEOMAP and GEOTRAN, and then combined using IMCOMBINE. The result was a set of summed on-band, off-band, and H images of each galaxy.
Planetary nebulae were identified on our frames in two complementary ways: by “blinking” the summed [O III] image against the off-band image, and by looking for emission-line objects on a “difference” image, formed by subtracting a scaled off-band image from the on-band frame. In order to be considered a planetary nebula candidate, an object had to have a point-spread-function consistent with that of a point source, and be present on the on-band image, but completely invisible on the off-band frame. PN candidates in star-forming galaxies also had to be at least 1.6 times brighter in [O III] than in H (see Section 3).
The PN candidates were measured photometrically using the IRAF version of DAOPHOT (Stetson, 1987; Stetson, Davis, & Crabtree, 1990; Stetson, 1992), and flux calibrated using large-aperture measurements of Stone (1977) and Massey et al. (1988) standard stars and the procedures outlined by Jacoby, Quigley, & Africano (1987). Our 4-m and WIYN observations were taken under photometric conditions, so this straightforward calibration produced fluxes with a zero-point accurate to mag. The M31 data, however, were obtained through light cirrus. The PNe in this galaxy were therefore calibrated by scaling the data to the [O III] and H observations of M31’s bulge taken by Ciardullo et al. (1989) and Ciardullo et al. (1987). Once calibrated, the resulting [O III] monochromatic fluxes (in ergs cm-2 s-1) were converted to magnitudes using
| (1) |
Tables 2 through 8 list the PNe of each galaxy. For M31, the equatorial positions are based on the J2000 system of the Guide Star Catalog (Lasker et al., 1990) and a set of secondary standards defined by Hui, Ford, & Jacoby (1994). For the remaining galaxies, the plate solutions were created using the USNO-A2.0 catalog (Monet et al., 1998). The errors associated with our positions are . Note that the PN identifications in Table 2 are an extension of the numbering scheme of Ciardullo et al. (1989). Figure 1 displays our [O III] images of the six galaxies, with the positions of the PN candidates marked with crosses.
3 Discriminating Planetary Nebulae from H II Regions
PNLF measurements in elliptical and S0 galaxies, such as NGC 3115 and NGC 5866, are relatively straightforward: since these systems have no current star formation, virtually all bright emission-line sources are planetary nebulae. PN observations in late-type galaxies, however, are not so simple. Only a very small percentage of the emission-lines sources in these systems are planetary nebulae; most [O III] line-emission comes from H II regions and supernova remnants. Therefore, in order to derive PN distances to these star-forming systems, an algorithm is needed to discriminate PNe from other sources of line emission.
As stated above, we used three criteria to perform this discrimination. In order to be classified as a planetary nebula, an object had to be spatially unresolved, invisible on the off-band frame, and have an [O III] to H ratio greater than 1.6. The first of these conditions is obvious. All bright PNe in the Galaxy are less than pc across (Acker et al., 1992); in M31, this corresponds to an angular size of . The true PNe in our program galaxies must therefore be stellar; objects that are even marginally resolved must be either H II regions or supernova remnants.
Our second criterion is also quite simple. Although the central stars of PNe can have luminosities , their effective temperatures are such that very little of this energy comes out in the optical. At the distances considered here, central star continuum emission at 5300 Å is well below the threshold of detectability. On the other hand, H II regions usually have OB associations at their center. Depending on how many stars are present, the OB stars’ combined optical emission may be detectable in the continuum. Thus, all valid PN candidates must be completely invisible on the off-band frame.
The third criterion, that of requires some elaboration. The central stars of [O III] bright PNe are typically much hotter than the OB stars that excite H II regions. As a result, much of the oxygen in a planetary nebula is doubly ionized (rather than singly ionized as is common in most H II regions). This fact, combined with the higher electron temperatures produced by the harder radiation field, causes a typical bright PN to have [O III] much brighter than H. Conversely, as the survey of Shaver et al. (1983) illustrates, most H II regions () have H+[N II] brighter than [O III] .
We can be quantitative about this condition by defining as the [O III] to H+[N II] line ratio and examining the behavior of as a function of [O III] absolute magnitude. [O III] , H, and [N II] line strengths now exist for large samples of PNe in three Local Group galaxies: M33, through the [O III] and H+[N II] photometry of Magrini et al. (2000, 2001a), the Large Magellanic Cloud, through the [O III] photometry of Jacoby, Walker, & Ciardullo (1990) and the spectrophotometric line ratios of Meatheringham & Dopita (1991a), Meatheringham & Dopita (1991b), and Vassiliadis et al. (1992), and M31 (this paper). The data are plotted in Figure 2. As the figure shows, the distribution of line ratios for [O III] bright planetary nebulae is remarkably independent of stellar population. PNe that are several magnitudes down the [O III] luminosity function have values of that are anywhere from to . Objects in the top mag of the PNLF, however, all have . This result holds for all populations, from the old, metal-rich bulge stars of M31, to the young, metal-poor planetaries of the LMC. Conversely, H II regions with are rare: of the 42 objects studied by Shaver et al. (1983), only four have this ratio greater than 1.5, and only one has .
Since the [O III] surveys presented in this paper extend less than mag down the PNLF, an efficient criterion for the removal of contaminating H II regions is to consider only those objects with [O III] to H+[N II] line ratios greater than 2. Note that this is a more stringent requirement than the criterion imposed by Magrini et al. (2000) and Magrini et al. (2001b) in their PN surveys of M33 and M81. However, Magrini et al. derived their value by considering the excitations of all PNe, regardless of absolute [O III] magnitude. As Figure 2 demonstrates, a criterion that uses absolute magnitude in addition to excitation is a much more powerful discriminator.
Unfortunately, due to time constraints and variable seeing at the telescope, our H images did not go deep enough to record objects with . Instead, for the faintest PNe in our sample, our H limiting magnitude corresponded to . We therefore used this number as our PN/H II region discriminator. This criterion is not perfect: if just 1% of bright H II regions are high excitation objects, then a substantial number of interlopers may survive this cut. However, by using our excitation rule in combination with the other two conditions, and limiting our PN search to regions away from the galaxies’ spiral arms and obvious star-forming regions, we are confident that we have reduced the fraction of contaminants to a negligible level.
4 Fitting the PNLFs and Obtaining Distances
Figure 3 displays the [O III] PNLFs for the six galaxies in our sample. Each shows an abrupt rise, and a flattening that is characteristic of the PNLF of other galaxies (see Jacoby et al., 1992). However, before these data can be used to derive distances, we need to define statistically complete samples for analysis.
For NGC 3115 and NGC 5866, this task was relatively straightforward: we used the fact that, on smooth backgrounds, a detection rate occurs at a signal-to-noise of (Ciardullo et al., 1987; Hui et al., 1993). The PN limiting magnitude is therefore a unique function of the background surface brightness: by noting the background at each position in the galaxies, we could define photometrically complete samples of objects (see Jacoby et al., 1989; Ciardullo, Jacoby, & Ford, 1989). Unfortunately, in the spiral galaxies, variable internal extinction, as well as the complexity of the underlying background makes this type of analysis impossible. Thus, statistical sub-samples of PNe had to be derived empirically from the frames.
To create the PN samples for the later-type galaxies, we began by noting the median sky background associated with each PN measurement. After excluding those few objects superposed on bright regions of the galaxy, we picked the worst (most uncertain) background remaining in the sample, and computed the signal-to-noise each PN would have had, if it had been projected on that background. We then defined our statistical PN sample as those objects with a hypothetical signal-to-noise above some threshold value. In the case of NGC 3351, 3627, and 4258, a threshold signal-to-noise of 10 served to define our limiting PN magnitude. For NGC 2403, however, our ability to blink was restricted by the complexity of the galaxy’s emission regions. Simply put, our PN identifications in NGC 2403 were confusion limited, rather than detection limited. As a result, we chose an extremely high value for the detection threshold for this galaxy – only objects with a hypothetical signal-to-noise greater than 25 made it into our complete sample. Those PNe that are part of our statistical samples are identified in Tables 3-8 with an “S”.
In order to derive PNLF distances and their formal uncertainties, we followed the procedure of Ciardullo et al. (1989). We took the analytical form of the PNLF
| (2) |
convolved it with the photometric error vs. magnitude relation derived from the DAOPHOT output, and fit the resultant curve to the statistical samples of PNe via the method of maximum likelihood. To correct for foreground extinction, we used the DIRBE/IRAS all-sky map of Schlegel, Finkbeiner, & Davis (1998), and the reddening curve of Cardelli, Clayton, & Mathis (1989). Finally, to estimate the total uncertainties in our measurements, we convolved the formal errors of the maximum-likelihood fits with the errors associated with the photometric zero points of the CCD frames (0.04 mag), the filter response curves (0.03 mag), and the Galactic foreground extinction (; Schlegel, Finkbeiner, & Davis, 1998). For consistency with previous papers of the series, we used a PNLF zero point of , which is based on an M31 distance of 710 kpc (Welch et al., 1986) and foreground reddening of (McClure & Racine, 1969). We will revisit the question of the PNLF zero point in Section 5.
4.1 NGC 2403
NGC 2403, the medium-sized Scd spiral in the M81 Group, has historically been the limit for ground-based Cepheid observations, and its Cepheid measurements date back over half a century (Tammann & Sandage, 1968). The galaxy’s revised Cepheid distance modulus of (Freedman et al., 2001) is based on the -band photometry of 10 Cepheids with the Canada-France-Hawaii telescope (Freedman & Madore, 1988) and the assumption that the galaxy’s internal extinction is similar to that of other spirals.
At a distance of Mpc, it is extremely easy to detect NGC 2403’s planetaries and resolve out the galaxy’s H II regions, even in seeing. Consequently, most of our PNe are extremely well detected, with signal-to-noise values over 100. Nevertheless, the PNLF of NGC 2403 turns over just mag down the luminosity function, as if the data past were severely incomplete. Part of the reason for this behavior may be due to the fact that in many regions of the galaxy, PN detections were confusion limited. However, this peculiar feature of the luminosity function may also be intrinsic to the galaxy’s stellar population. Jacoby & De Marco (2002) have shown that the luminosity function of PNe in the SMC is non-monotonic with a pronounced dip mag down the luminosity function. The luminosity function of Magrini et al. (2000) suggests that M33 has a similar feature mag down the PNLF. Like the SMC and M33, NGC 2403 is undergoing strong star formation. It is therefore possible that the turnover in the luminosity function at real. If so, the position and strength of the dip may serve as an age or metallicity indicator for the stellar population (Ciardullo, Kuzio, & Simone, 2001).
Even if NGC 2403’s PNLF declines past , this behavior does not affect the precision of the PNLF method, since PNLF distances depend only on the brightest objects. A fit to the top mag of the observed PNLF yields a distance modulus for the galaxy of ( Mpc). This is larger than that derived from the Cepheids.
4.2 NGC 3115
Due to the small size of the RCA CCD, this prototypical field S0 galaxy was observed in two parts, with the fields positioned north and south of the galaxy’s nucleus. The inner regions of the galaxy were excluded from our analysis, since PN detections in these high surface brightness regions ( mag arcsec-2) are difficult. Despite this limitation, we were still able to identify a statistical sample of 29 PNe that extends mag down the luminosity function. If we fit these data to the empirical curve, then the galaxy’s most likely distance modulus is ( Mpc).
Because NGC 3115 has a smooth luminosity profile with little, if any, internal extinction, it is possible to normalize our PN counts to the bolometric luminosity of the sampled population. This quantity, defined as by Ciardullo et al. (1989), is potentially useful, since it has been observed to vary by almost an order of magnitude in different stellar populations (Ciardullo, 1995).
To perform our normalization, we adopted the surface photometry measurements of Hamabe & Okamura (1982), and summed the -band flux contained in our survey regions. We then converted this total magnitude to a bolometric magnitude by integrating the galaxy’s spectral energy distribution, as defined by the multicolor optical and IR photometry of de Vaucouleurs & Longo (1988) and Persson, Frogel, & Aaronson (1979). We then used this bolometric magnitude to compute using the maximum-likelihood technique described in Ciardullo et al. (1989). The resulting value, PN yr, is similar to that found for the bulge of M31, and is typical of that for an old, metal-rich stellar population (Ciardullo, 1995).
4.3 NGC 3351
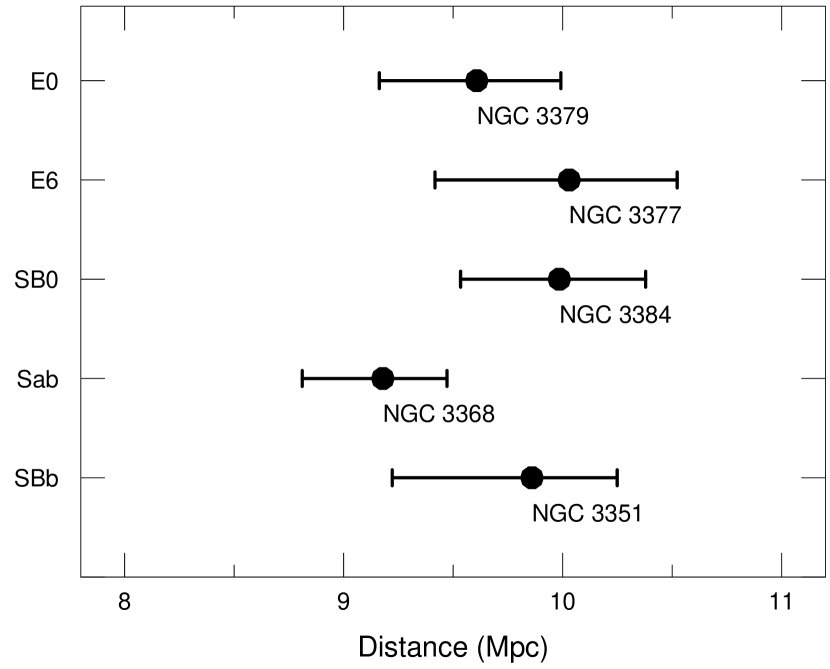
The importance of the Leo I Group to extragalactic distance measurements has been recognized for almost half a century (Humason, Mayall, & Sandage, 1956). The group is compact, well-defined, and contains both early and late-type galaxies; it is thus the ideal location for linking the Pop I and Pop II distance scales. As a medium-sized SBb galaxy in the core of Leo I, NGC 3351 is especially valuable. The galaxy is late enough to contain a large number of Cepheids (Graham et al., 1997) and be useful as a Tully-Fisher calibrator (Macri et al., 2000), yet early enough to have a bulge that can be analyzed using the surface brightness fluctuation method (Jensen et al., 2001; Watanabe et al., 2001).
Because our [O III] filter vignetted part of the field, our PN survey of NGC 3351 was limited to the inner of the galaxy. Nevertheless, we detected 20 PNe; 12 of these were bright enough to be part of a complete sample. Our derived distance modulus of ( Mpc) agrees with the value derived from the HST photometry of 49 Cepheids (Graham et al., 1997; Freedman et al., 2001). More importantly, as demonstrated in Figure 4, our PNLF distance to NGC 3351 is also in excellent agreement with the PNLF distances to four other members of the group. This consistency provides further evidence that the absolute magnitude of the PNLF does not depend strongly on galaxy type or stellar population.
4.4 NGC 3627
NGC 3627, a large Sb spiral in the Leo Triplet, became important for distance scale research in 1989, when it produced the well-observed Type Ia supernova 1989B (Wells et al., 1994). The galaxy has also hosted two other supernova-like events, the Type II SN 1973R (Ciatti & Rosino, 1977) and the unusual object SN 1997bs (Van Dyk et al., 2000), and is a zero-point calibrator for the Tully-Fisher relation.
The body of NGC 3627 is quite dusty, so PN identifications in the bulge and interarm region of the galaxy are difficult. However, NGC 3627 has recently undergone an interaction with NGC 3628; this is evidenced by the galaxy’s asymmetric spiral arms, the plumes of extragalactic H I and optical material extending from NGC 3628 (Rots, 1978; Kormendy & Bahcall, 1974; Chromey et al., 1998), and the large faint halo surrounding NGC 3627 (Burkhead & Hutter, 1981). It is, in fact, this low surface brightness stellar halo that allows us to determine the galaxy’s distance; the region contains many bright planetary nebulae and very few H II regions.
Our survey of NGC 3627’s halo produced 73 planetary nebula candidates; 40 of these constituted our statistically complete sample. A maximum likelihood fit to these data yields a distance modulus of ( Mpc), in excellent agreement with the value of obtained from HST observations of 68 Cepheids (Saha et al., 1999; Freedman et al., 2001).
4.5 NGC 4258
In the mid-1990’s, nuclear masers were discovered moving in a Keplerian orbit around the central black hole of NGC 4258 (Watson & Wallin, 1994). By resolving these masers (Miyoshi et al., 1995), measuring their acceleration (Greenhill et al., 1995), and monitoring their proper motions, Herrnstein et al. (1999) were able to derive a geometric distance to the galaxy, Mpc. This makes NGC 4258 one of only two galaxies with a direct geometric distance, and an important crosscheck for extragalactic distance techniques.
Our [O III] survey in NGC 4258 resulted in the identification of 58 PN candidates. Of these, 29 were above our signal-to-noise cutoff of 10, and had magnitudes in the top mag of the PNLF. The distance implied by these PNe, ( Mpc), is larger than the system’s geometric distance.
The fact that our PNLF distance is slightly higher than the galaxy’s geometric distance may be due to chance. However, it also may be indicative of a more substantial problem with the extragalactic distance scale. HST measurements of 15 Cepheids in the disk of NGC 4258 yield a distance modulus of (random + systematic error) or Mpc (Newman et al., 2001; Freedman et al., 2001). Like the PNLF distance, the Cepheid value is also slightly high (by ).
Is this a serious problem? Aside from NGC 4258, there is only one other galaxy with a geometrical distance estimate. That galaxy, the Large Magellanic Cloud, has a measurement based on the light echo of SN 1987A (Panagia et al., 1991). Unfortunately, the light-echo distance is still somewhat controversial, with recent estimates differing by mag, from kpc (Panagia, 1999) to less than kpc (Gould & Uza, 1998). The former distance is close to that derived from the Galactic calibration of Cepheids (Feast & Catchpole, 1997) and the Hipparcos calibration of RR Lyrae variables (Reid, 1997); the latter value is in line with distances inferred from the statistical parallax calibration of RR Lyrae stars (Layden et al., 1996) and the Hipparcos calibration of red clump stars (Udalski, 2000).
The Cepheid distance scale of Freedman et al. (2001) is based on an LMC distance modulus of . However, the most comprehensive analysis of SN 1987’s light-echo is probably that of Gould & Uza (1998), and their distance modulus is (where the upper limit reflects the possible time lag between the arrival of the EUV-light and line fluorescence). If we adopt this shorter value, then the geometric distance ratio between the LMC and NGC 4258 becomes . This is in perfect agreement with the distance ratios derived from both the Cepheids (), and the PNLF ().
Our PNLF distance to NGC 4258, when combined with that from the Cepheids, provides independent evidence in support of the “short” distance to the LMC. If this result holds, then the entire extragalactic distance scale is affected. Specifically, if we work backward from the Herrnstein et al. (1999) distance for NGC 4258, and apply the observed PNLF and Cepheid LMC/NGC 4258 distance ratios, then the LMC distance modulus becomes . This increases the Freedman et al. (2001) Hubble Constant by 8%, from km s-1 Mpc-1 to km s-1 Mpc-1. Moreover, if we further constrain the LMC distance using the Gould & Uza (1998) measurement of SN 1987A’s light echo, then the error on the LMC distance is reduced to mag, and the Freedman et al. (2001) Hubble Constant becomes km s-1 Mpc-1.
4.6 NGC 5866
The edge-on S0 galaxy NGC 5866 is the most distant galaxy in our sample, and it has the poorest data quality. As a result, PN identification could only be made in the galaxy’s halo, where the galactic surface brightness is well below that of the sky. Even then, our limiting magnitude for completeness reached only mag down the PN luminosity function. Still, the 11 PNe in our statistical sample yield a relatively well-constrained distance modulus of ( Mpc).
For galaxies such as NGC 5866 with distances greater than Mpc, PN samples can suffer contamination due to the redshifted emission lines of distant galaxies. It is therefore reasonable to consider the possibility that some of the PN candidates listed in Table 8 are, in reality, Ly galaxies at . In the case of NGC 5866, however, this source of contamination should be negligible. Ciardullo et al. (2002) have shown that the surface density of emission-line contaminants brighter than our limiting magnitude of is object per 66 arcmin-2. Since NGC 5866 was surveyed with a small chip (16 arcmin-2), the likelihood of finding a background galaxy in the field is low. Thus our PNLF distance should not be affected by this source of error.
5 The PNLF-Cepheid Comparison
The PNLF is a secondary standard candle. Although there have been a few attempts to measure the absolute magnitude of the PNLF cutoff in the Milky Way (e.g., Pottasch, 1990; Méndez et al., 1993), must still be defined via observations in galaxies with known distances. The original value of the zero point, , was based on an M31 Cepheid distance of 710 kpc (Welch et al., 1986) and a foreground extinction of (McClure & Racine, 1969). Since then the Cepheid distance to M31 has increased (750 kpc; Freedman et al., 2001) and estimates of the foreground extinction have decreased (; Burstein & Heiles, 1984; Schlegel, Finkbeiner, & Davis, 1998). Formally, this brightens to and increases all the PNLF distances by 2.5%.
Rather than rely on a single galaxy for the PNLF zero point, it is better to derive by combining the PNLF measurements of many different systems. With the addition of NGC 2403, NGC 3351, NGC 3627, and NGC 4258, there are now 13 galaxies with both Cepheid and PNLF photometry. If we adopt the final HST Key Project Cepheid distances (uncorrected for metallicity) given by Freedman et al. (2001) and use the DIRBE/IRAS estimates for foreground extinction (Schlegel, Finkbeiner, & Davis, 1998), we can obtain a measure of in each system. These are listed in Table 9 and plotted as a function of galactic metallicity (as estimated from the systems’ H II regions; Ferrarese et al., 2000a) in Figure 5. Note that is not measured with the same precision in each galaxy. This is a limitation intrinsic to the PNLF method: low-luminosity systems simply do not have as many PNe populating the bright-end of the luminosity function as large, luminous galaxies (Ciardullo et al., 1989).
As Figure 5 illustrates, at low-metallicity, our derived values of appear to be sensitive to oxygen abundance. In particular, in the three most metal-poor galaxies in the sample (SMC, NGC 5253, and NGC 300) the PNLF zero point is substantially () fainter than that seen in the metal-rich systems. This behavior is not unexpected: a decrease in the [O III] emission of metal-poor planetary nebulae has been seen by Ciardullo & Jacoby (1992) and Richer (1993) in Local Group surveys and the trend has been successfully modeled by Dopita, Jacoby, & Vassiliadis (1992). According to the Dopita, Jacoby, & Vassiliadis (1992) models, is brightest when the PN oxygen abundance is near solar; in more metal-poor and metal-rich populations, fades. This dependence, which is plotted in Figure 5, can be expressed via the quadratic
| (3) |
where the solar abundance of oxygen is assumed to be (Grevesse, Noels, & Sauval, 1996). In reality, the weakening of [O III] in high-Z galaxies will not be observed, since in these systems, solar-metallicity stars are available to define the systems’ PNLF cutoff. However, the dimming of in low metallicity galaxies can be observed, and, as Figure 5 indicates, the observed trend is in excellent agreement with theory.
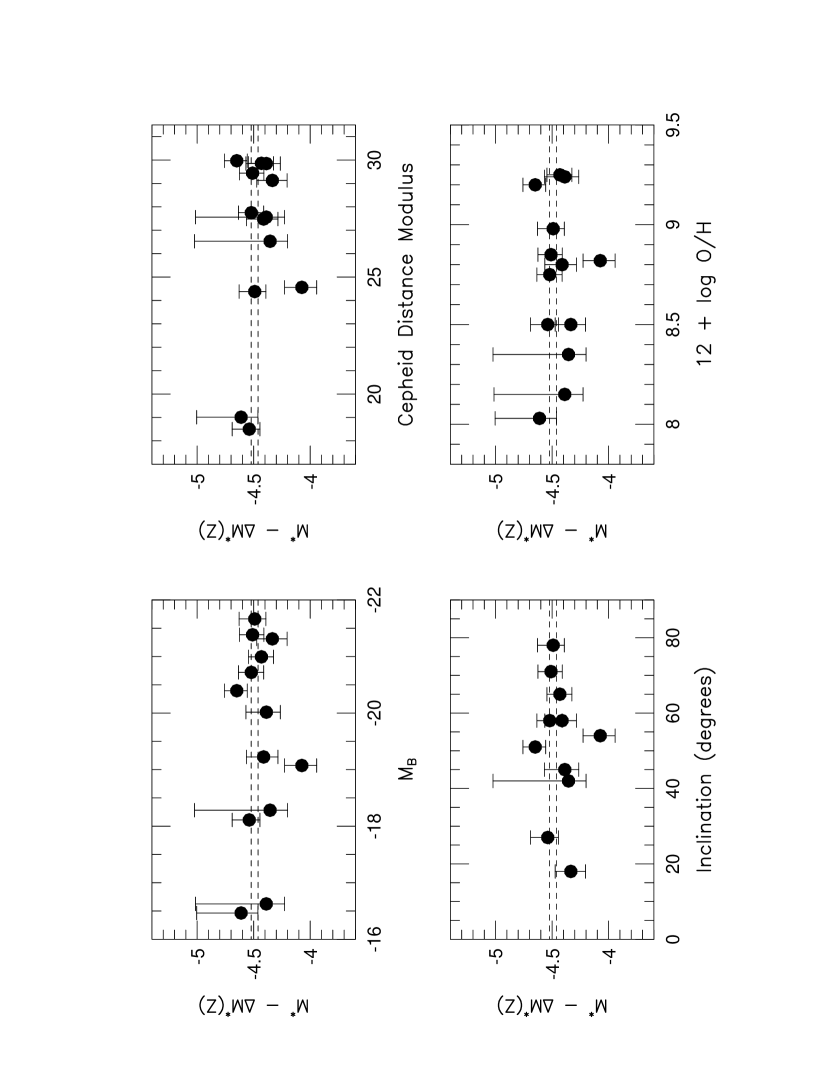
To search for further systematic errors in the PNLF, we applied the Dopita, Jacoby, & Vassiliadis (1992) metallicity correction to the galaxies on the low-metallicity side of the relation’s inflection point, and replotted the data against several galactic parameters. The results, displayed in Figure 6, are impressive. Except for one object (M33), the scatter in the data is perfectly consistent with the internal uncertainties associated with the PNLF and Cepheid distance measurements. This implies that the quoted errors of the two techniques are reasonable, and that any additional sources of error are small. Moreover, the one discrepant point may have an explanation. The mag () offset between M33’s expected and observed PNLF zero point is essentially the same as the offset found between the galaxy’s Cepheid distance and its distance derived from RGB tip and red clump stars (Kim et al., 2002). In both cases, the discrepancy can be traced to a difference in the adopted reddening. M33’s Cepheid distance uses an extinction that is derived from multicolor photometry of the Cepheids themselves (Freedman, Wilson, & Madore, 1991; Freedman et al., 2001). Our measurement of , and the measurement of the galaxy’s RGB stars, use the DIRBE/IRAS Galactic extinction. The difference between these values, , is one of the largest observed for any Cepheid galaxy, and may be responsible for the anomalous value of . If the Cepheid reddening were reduced to one typical of other Cepheid galaxies, M33’s PNLF cutoff (and the red star distance indicators) would be in much better agreement.
Further evidence of the consistency of the PNLF technique comes from the lack of correlation between the metallicity-corrected value of the PNLF zero point, , and the various galaxy properties. For example, if the assumed shape of the PNLF (equation 2) were incorrect, as hypothesized by Bottinelli et al. (1991), we would expect to see a correlation between and galaxy absolute magnitude; such a correlation does not exist. Similarly, if compact H II regions were a problem for PN surveys, then PNLF measurements in distant galaxies would be preferentially affected, and would correlate with distance. This trend is not seen, either.
The third panel of Figure 6 plots against galaxy inclination for the 11 spiral galaxies in our sample. Internal extinction can affect PNLF measurements, and indeed, the M33 point moves into perfect agreement with the rest of the sample if we assume that the Cepheid reddening also applies to the planetaries (Magrini et al., 2000). Nevertheless, the evidence of Figure 6 suggests that internal extinction is not a major source of error: if it were, then we would expect to correlate strongly with galaxy inclination. No correlation is seen, and this constancy supports the claim of Feldmeier, Ciardullo, & Jacoby (1997) that the relatively large scale-height of planetary nebulae limits the effect of internal extinction to mag.
Perhaps the most interesting part of Figure 6 concerns the lack of any residual correlation between the metallicity-corrected value for the PNLF zero point and galaxy metallicity, as determined from the oxygen abundance of H II regions (Ferrarese et al., 2000a). The dependence of Cepheid distances on galaxy metallicity is controversial. Theoretical and empirical analyses by numerous groups disagree on both the amplitude and sign of the relation (see Feast, 1999; Freedman et al., 2001, and references therein). For example, while Kochanek (1997) and Sasselov et al. (1997) point out that metallicity corrections to the Cepheid period-luminosity relation might change the extragalactic distance scale by more than 10%, other studies, such as those by Caputo et al. (2000), Kennicutt et al. (1998), and Udalski et al. (2001) argue for a much weaker dependence. Since our measurements of assume that the raw Cepheid distances (with no metallicity correction) are accurate, the constancy seen in Figure 6 supports the latter conclusion.
To quantify this result, we performed a Monte Carlo simulation on the data displayed in the fourth panel of Figure 6. We treated each galaxy’s asymmetrical error bars as probability distributions, and regressed against metallicity for 1,000,000 realizations of the data. The simulations confirmed what is apparent to the eye: once the PNLF zero point is corrected for metallicity via the relation of Dopita, Jacoby, & Vassiliadis (1992), no other term is needed. Formally, the best-fitting slope to the relation is mag per dex. Either the metallicity dependence of Cepheids exactly cancels that of an additional unknown PNLF variation, or abundance changes have little effect on the distances derived from Cepheids.
Since does not appear to correlate with any galaxy property, we can combine the probability distributions of Figure 6 and re-determine the PNLF zero point. Once again, we did this via a Monte Carlo simulation in which we drew randomly from the probability distributions associated with each galaxy. If we exclude the outlying galaxy M33 from the analysis, then our procedure yields a most probable value of with 68.2% of the probability lying between and . (If M33 is included, this value drops slightly to .) Alternatively, if we restrict our analysis to galaxies as large or larger than the LMC (), then the Dopita, Jacoby, & Vassiliadis (1992) metallicity correction is not needed and the most probable value of the zero point becomes (or if M33 is included in the sample). Since emission-line abundances for most elliptical galaxies are unobtainable, we will use in the analysis that follows and exclude low-luminosity galaxies from the analysis.
6 The PNLF-SBF Comparison
PNLF distances provide a bridge between the Pop I distance indicators, such as Cepheids, and the techniques on the Pop II side of the distance ladder. Chief among these Pop II techniques is the Surface Brightness Fluctuation method: SBF distances have a precision comparable to that of Cepheids and the PNLF, and the technique has been applied to over 300 elliptical, lenticular, and early-type spiral galaxies (Tonry et al., 2001). Presently, the SBF scale is calibrated via Cepheid measurements to six intermediate-type spirals: M31, M81, NGC 3368, NGC 4258, NGC 4725, and NGC 7331 (Freedman et al., 2001). Our PNLF measurements provide an independent test of this calibration.
With the addition of NGC 3115, NGC 4258, and NGC 5866, there are now 28 large galaxies with both SBF and PNLF distance measurements. These galaxies are identified in Table 10, along with the differences between the SBF and PNLF distance moduli. For consistency with Section 5, and to explicitly include the effects of cosmic scatter in the distance indicators, the zero-point of the SBF method has been re-computed in exactly the same manner as that for the PNLF. That is, the SBF and Cepheid error bars for the six calibrating galaxies have been added in quadrature, and the resulting probability distributions used in a series of Monte Carlo simulations. This procedure produces an SBF distance scale that is mag smaller than that used by Tonry et al. (2001).
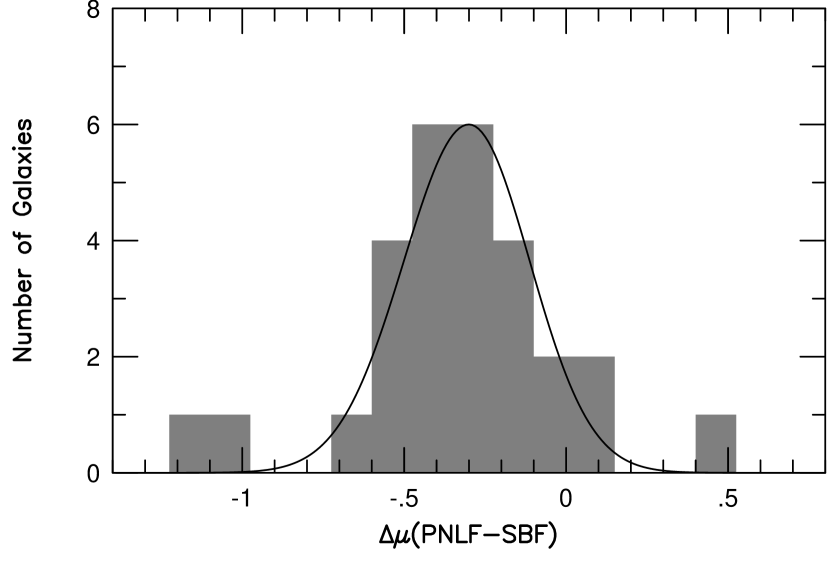
Figure 7 histograms the difference between the SBF distance moduli (as calibrated directly via the six Cepheid galaxies) and the PNLF distance moduli as calibrated in Section 5. The curve displayed in the figure is the expected scatter in the data, as determined by adding (in quadrature) the uncertainties associated with the individual PNLF and SBF measurements, and a uncertainty associated with Galactic reddening (Schlegel, Finkbeiner, & Davis, 1998). The latter component is especially important. As pointed out by Ciardullo, Jacoby, & Tonry (1993), the strong color dependence of the absolute fluctuation magnitude (; Tonry et al., 2001) means that an underestimate of foreground extinction translates into an underestimate of SBF distance. This is the exact opposite of how the PNLF (and most other methods) react to reddening: for the PNLF, an underestimate of extinction results in an overestimate of distance. Consequently, a very small error in extinction propagates into a significant discrepancy between the PNLF and SBF moduli, with .
The results of Table 10 and Figure 7 are noteworthy. Immediately obvious from the figure is the presence of three outliers. NGC 4565, NGC 891, and NGC 4278 have values of that are from the mean of the distribution; this separation is too large to be explained by any random process. Interestingly, two of the points, NGC 4565 ( mag) and NGC 891 ( mag) are edge-on spirals, the only such systems in the sample. Since SBF measurements to late-type galaxies are difficult (due to the presence of dust and color gradients), while photometry of halo PNe is relatively easy, it is tempting to blame this discrepancy on the SBF values. However at this time, all we can say is that one (or both) methods have trouble measuring distances to these systems.
If the outlying galaxies are excluded, then the scatter in the measurements exactly follows that predicted from the internal errors of the methods. This agreement is striking, and strongly suggests that the quoted errors of the measurements are accurate. The agreement also leaves little room for additional sources of error; if there is some population-dependent term in the scatter, it must be small.
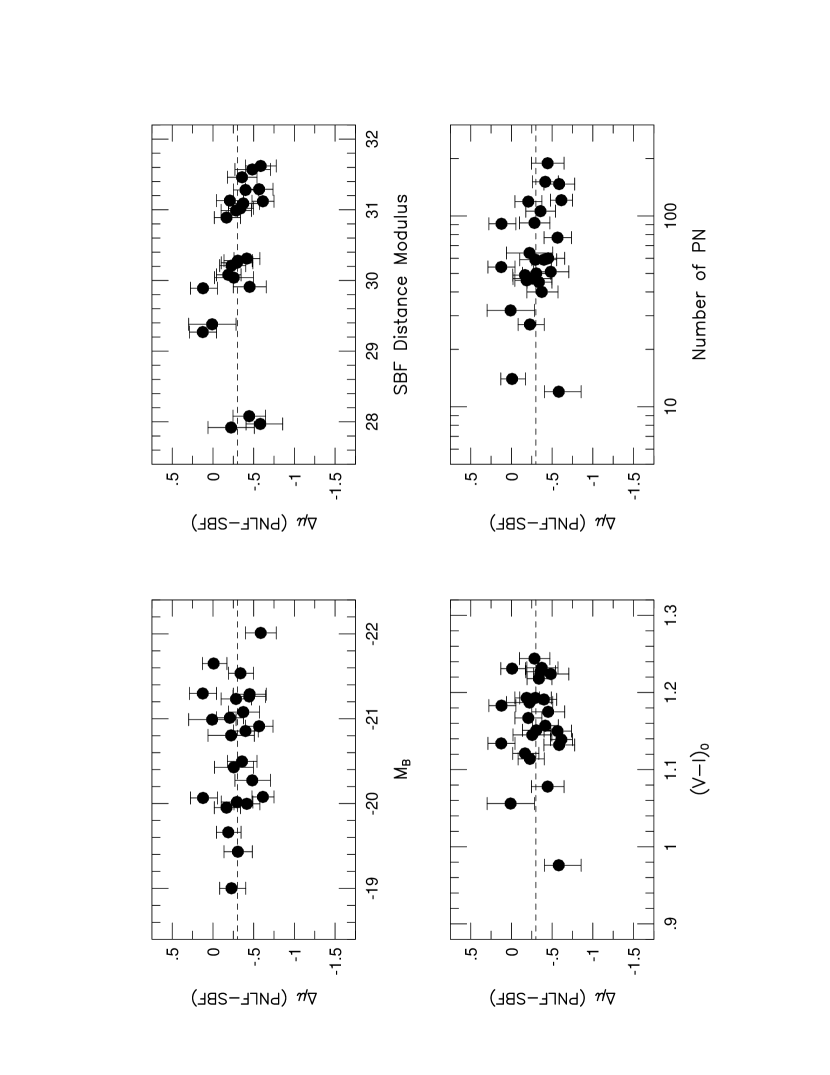
This latter conclusion is confirmed in Figure 8. If either method were significantly affected by population age or metallicity, then would correlate with galactic absolute magnitude or color. As Figure 8 illustrates, it does not. Similarly, if the form of the PNLF (equation 2) were incorrect, would correlate with absolute magnitude or PN population. This correlation does not exist, either. In fact, the only possible trend present in the figure occurs when the PNLF-SBF residuals are plotted against distance. If one only considers galaxies with , then there is a 95% chance that a correlation exists between and distance modulus. Such a trend might be expected if the PN candidates found in these systems are contaminated by background emission-line galaxies or (in the case of galaxies in rich clusters) foreground intracluster stars. However, if the five most distant objects are deleted from the sample, the correlation with distance goes away. Thus, the overall impression left from the figure is that in terms of relative distances, the PNLF and SBF techniques are in excellent agreement.
Unfortunately, the same cannot be said for the methods’ absolute distances. As Figure 7 demonstrates, there is a 0.30 mag offset between the SBF and PNLF distance scales, in the sense that SBF distances are systematically larger than their PNLF counterparts. This offset, which is reduced to mag if the 5 most distant galaxies are excluded, is highly significant. Based on the 13 galaxies with Cepheid and PNLF measurements, the uncertainty in the PNLF zero point is mag. Similarly, the uncertainty in the SBF zero point, as defined by the six Cepheid calibrators, is mag. Finally, there is the uncertainty in the zero point of Galactic extinction. This continues to be a controversial topic (see Burstein & Heiles, 1982, for a review), and, indeed, the zero point of the Schlegel, Finkbeiner, & Davis (1998) extinction map is 0.02 mag smaller in than that of the Burstein & Heiles (1982) map. However, the sense of this offset is that, if the Burstein & Heiles (1982) zero point were adopted, the discrepancy between the PNLF and SBF distance scales would be worse. In fact, if one wishes to avoid negative DIRBE/IRAS reddenings, then the extinction zero point cannot be lowered by more than mag. This translates into a hard upper limit of 0.10 mag on the uncertainty in the mean value of due to dust, and a total upper limit on the uncertainty of 0.12 mag. The observed offset between the PNLF and SBF distance scales is therefore statistically significant at more than the level. Considering the fact that both the SBF and PNLF methods are calibrated in the same way via Cepheids, this is a remarkable result!
7 Discussion
Logically speaking, there are only three possible ways to explain the discrepancy between the PNLF and SBF distance scales:
The Cepheid distances of the SBF calibrators may be systematically different than those of the PNLF calibrators. This solution is extremely unlikely, as the two samples of galaxies are nearly identical. Specifically, four of the six SBF calibrators are also PNLF calibrators, the median metallicity of the PNLF calibrators is very nearly the same as that of the SBF calibrators (O/H vs. O/H ), and there is no significant difference in the Cepheid internal reddenings of the two samples. Consequently, it is difficult to blame the PNLF-SBF discrepancy on the Cepheids.
The PNLF measurements made in Cepheid galaxies may be systematically different from those made in SBF galaxies. PN identifications are best made in the spheroidal components of galaxies, where contamination from H II regions is minimal. However, in order to make direct comparisons with the Pop I distance indicators, PNLF observations must be performed in galactic disks. Thus, one can attempt to explain the PNLF-SBF discrepancy via the hypothesis that the PNLF cutoff is fainter in spiral disks than in bulges and halos. Such an idea is plausible since internal extinction could, in theory, dim disk planetary nebulae more than bulge objects.
We can test for such an effect by dividing the PNLF calibrators into two groups: those whose PN surveys included the galaxies’ Pop I components (the LMC, the SMC, NGC 300, NGC 2403, NGC 3351, NGC 4258, NGC 5253, and M101), and those whose observations were confined primarily to the bulge and halo (M31, M81, NGC 3368, and NGC 3627). When we do this, we find that there is no significant difference between the two samples of galaxies: the zero point found in young populations is only mag fainter than that observed for old systems. Moreover, planetary nebula surveys in the bulge, disk, and halo of M31 (Hui, Ford, & Jacoby, 1994) and M81 (Magrini et al., 2001b) have also failed to find change in the PNLF zero point with stellar population. It is therefore extremely unlikely that PNLF differences can explain the 0.3 mag offset.
The SBF measurements made in Cepheid galaxies may be systematically different than those made in PNLF galaxies. Of the 28 galaxies with both PNLF and SBF measurements, all but eight are elliptical or lenticular. Yet the SBF calibration is derived from the observation of six spiral bulges. Thus, the potential exists for a systematic error between the two data samples. Indeed, due to the extreme color sensitivity of the SBF method, a moderate amount of internal extinction () in the six calibrating galaxies will shift the SBF scale by more than 10% and bring it and bring it into close agreement with the scale defined by the PNLF.
Is there evidence for this amount of internal extinction? It is true that the direct measurements of extinction in the bulges of M31 (McClure & Racine, 1969) and M81 (Peimbert & Torres-Peimbert, 1981) are greater than the galaxies’ DIRBE/IRAS reddening values (Schlegel, Finkbeiner, & Davis, 1998). However, in both cases the excess is less than what is needed, . Similarly, if one breaks the sample of galaxies in two, one finds a slight difference between the PNLF-SBF distance offset for spiral bulges ( mag) and for ellipticals ( mag). Unfortunately, even if this result is significant, it still does not fully explain the 0.3 mag offset of Figure 7.
Nevertheless, internal extinction is still the most likely cause of the scale discrepancy. If the bulges of the six Cepheid calibrators have as little as of internal extinction, then the zero point of the SBF system shifts by 0.14 mag and the SBF-based Hubble Constant of Ferrarese et al. (2000b) moves from to km s-1 Mpc-1. [Note that this shift is almost as large as the formal km s-1 Mpc-1 systematic error assigned by Ferrarese et al. (2000b) and Freedman et al. (2001).] Moreover, if the same extinction is applied to the PNLF measurements, then the PNLF scale is increased by a comparable amount, and the PNLF/SBF discrepancy disappears completely. This result underscores the need close study of the internal extinction of galaxies, and for more independent crosschecks at each rung of the distance ladder.
8 The PNLF-TRGB Comparison
Note that our conclusion differs from that of Ferrarese et al. (2000b), who attributed the PNLF/SBF scale discrepancy to a systematic error in the planetary nebula distances. The evidence Ferrarese et al. (2000b) cited in in support of this interpretation was 1) the similarity between the SBF distances to the ellipticals of Virgo and Fornax, and the Cepheid distances to the clusters’ spirals, and 2) the agreement between the SBF distance scale, and the scale inferred from -band measurements of stars at the the tip of the red giant branch (TRGB). The former argument is suspect, since both clusters are complex, and the elliptical galaxies are not co-mingled with the spirals (West & Blakeslee, 2000; Drinkwater, Gregg, & Colless, 2001). The second comment, however, deserves some attention.
The TRGB method is well tested inside the Local Group: the data from nine nearby galaxies with both TRGB and Cepheid measurements demonstrate that the technique can produce results that are accurate to better than mag (Ferrarese et al., 2000b). However, no Cepheid galaxy more than 3 Mpc away has a TRGB measurement: at these distances, the only direct comparisons are with PNLF and SBF galaxies.
A galaxy-by-galaxy comparison of TRGB, SBF, and PNLF distances appears in Figure 9. As the figure illustrates, the overlap between TRGB, PNLF, and SBF galaxies is scant. Only 7 PNLF galaxies have TRGB distances: the LMC (Sakai, Zaritsky, & Kennicutt, 2000), M31 (Durrell, Harris, & Pritchet, 2001), M33 (Kim et al., 2002), NGC 5102 (Karachentsev et al., 2002), NGC 5128 (Harris, Harris, & Poole, 1999), NGC 3379 (Sakai et al., 1997), and NGC 3115 (Elson, 1997). Only five galaxies have both TRGB and SBF measurements (M31, NGC 5102, NGC 5128, NGC 3379, and NGC 3115). If one just considers the mean offsets between the measurements, then the data do indicate that the SBF and TRGB distance scales are in agreement, and that the PNLF scale is mag too small. However, Figure 9 contains two other properties that should not be ignored.
The first concerns the size of the SBF-TRGB internal error bars relative to the observed scatter in the measurements. An important conclusion of §5 and 6 is that the scatter between the PNLF, SBF, and Cepheid distance measurements is consistent with that expected from the internal errors of the methods. This agreement strongly suggests that the quoted errors for all three methods are accurate. However, the same is not true for the SBF-TRGB comparison. As Figure 9 demonstrates, the observed SBF-TRGB distance residuals are significantly larger than the internal errors of the methods would predict. (The internal and external errors are incompatible at the confidence level.) Since the SBF errors appear to be reasonable, the implication is that the TRGB measurements possess an additional source of uncertainty.
The second property displayed in Figure 9 is the trend exhibited in the PNLF-TRGB comparison. Inside the Local Group, there is excellent agreement between the PNLF and TRGB distance indicators; the mean difference between the two methods is mag. At larger distances, however, the techniques diverge, and . Since the Cepheid and SBF comparisons demonstrate there is no problem with the relative PNLF distances (at least for objects within Mpc), the existence of the discrepancy again suggests a problem with the TRGB data.
With the information currently available, we cannot prove that an error exists in the TRGB distance measurements. However, we can speculate on the types of errors which may be associated with the method. TRGB measurements require that the red giant branch be well-populated: if the RGB is underpopulated, then the apparent magnitude of the RGB tip will be overestimated, and the distance to the parent galaxy will be overestimated (Madore & Freedman, 1995). Even more important is the effect of metallicity. Even if the sample of RGB stars is large, the technique still will not work unless the stars at the RGB tip have [Fe/H] (Lee, Freedman & Madore, 1993; Bellazzini, Ferraro, & Pancino, 2001). If the red giants are more metal-rich than this, their absolute -band luminosities will be fainter than assumed, due to the effects of line blanketing, and the result will again be an overestimate of distance. Thus, the systematic errors associated with the technique are asymmetric: if an error exists, then the distances produced by the TRGB technique will be upper limits.111Madore & Freedman (1995) note that image crowding and low signal-to-noise detections can potentially bias TRGB measurements towards brighter magnitudes (smaller distances). However, these effects will almost always be small ( mag). The systematic effects of sample size and metallicity are much larger.
For nearby galaxies, the metallicity effect on the TRGB is not of great concern. Most Local Group galaxies are small and thus metal-poor; the only exceptions (M31 and M33) both have high quality data and measured RGB metallicity distributions. Consequently, the TRGB distances to these objects are well-determined, and in excellent agreement with the distances derived from Cepheid (Ferrarese et al., 2000b), PNLF, and SBF measurements. Outside the Local Group, however, the data quality is generally poorer, and with one exception (NGC 5128), little or no information is available about the RGB metallicity distribution. Since most of these distant galaxies are more massive (and therefore more metal-rich) than their Local Group counterparts, a systematic error in the TRGB distance scale is not inconceivable. Thus, the PNLF and TRGB measurement may, indeed, be consistent. Higher quality, multicolor TRGB measurements beyond the Local Group are needed to resolve the problem.
9 Conclusion
We have presented PNLF distances to NGC 2403, NGC 3115, NGC 3351, NGC 3627, NGC 4258, and NGC 5866, and have used these data to compare the Cepheid, PNLF, and SBF distance scales. Our observations demonstrate that, in terms of relative distance measurements, the Cepheid, PNLF, and SBF methods are in excellent agreement, and the internal errors estimated for all the methods are correct. However, we also show that the PNLF and SBF distance scales are incompatible: the Cepheid-calibrated SBF scale is mag longer than the Cepheid-calibrated PNLF scale. The likely cause of the discrepancy is internal extinction in the bulges of the SBF Cepheid calibrators. If this is true, then this error results in an underestimate of the SBF Hubble Constant. Finally, we use our PNLF distance to NGC 4258, in combination with the galaxy’s geometric and Cepheid distances, to argue that the short distance to the Large Magellanic Cloud is correct, and that the Freedman et al. (2001) Hubble Constant should be increased by .
References
- Acker et al. (1992) Acker, A., Ochsenbein, F., Stenholm, B., Tylenda, R., Marcout, J., Schohn, C. 1992, Strasbourg-ESO Catalogue of Galactic Planetary Nebulae (Garching: ESO)
- Arnaboldi et al. (2002) Arnaboldi, M., Aguerri, J.A., Napolitano, N.R., Gerhard, O., Freeman, K.C., Feldmeier, J., Capaccioli, M., Kudritzki, R.P., & Méndez, R.H. 2002, ApJ, 123, 760
- Bellazzini, Ferraro, & Pancino (2001) Bellazzini, M., Ferraro, F.R., & Pancino, E. 2001, ApJ, 556, 635
- Bottinelli et al. (1991) Bottinelli, L., Gouguenheim, L., Paturel, G., & Teerikorpi, P. 1991, A&A, 252, 550
- Burkhead & Hutter (1981) Burkhead, M.S., & Hutter, D.J. 1981, AJ, 86, 523
- Burstein & Heiles (1982) Burstein, D., & Heiles, C. 1982, AJ, 87, 1165
- Burstein & Heiles (1984) Burstein, D., & Heiles, C. 1984, ApJS, 54, 33
- Caputo et al. (2000) Caputo, F., Marconi, M., Musella, I., & Santolamazza, P. 2000, A&A, 359, 1059
- Cardelli, Clayton, & Mathis (1989) Cardelli, J.A., Clayton, G.C., & Mathis, J.S. 1989, ApJ, 345, 245
- Chromey et al. (1998) Chromey, F.R., Elmegreen, D.M., Mandell, A., & McDermott, J. 1998, AJ, 115, 2331
- Ciardullo (1995) Ciardullo, R. 1995, in I.A.U. Highlights of Astronomy 10, ed. I. Appenzeller (Dordrecht: Kluwer), 507
- Ciardullo et al. (2002) Ciardullo, R., Feldmeier, J.J., Krelove, K., Jacoby, G.H., & Gronwall, C. 2002, ApJ, 566, 784
- Ciardullo et al. (1987) Ciardullo, R., Ford, H.C., Neill, J.D., Jacoby, G.H., and Shafter, A.W. 1987, ApJ, 318, 520
- Ciardullo & Jacoby (1992) Ciardullo, R., & Jacoby, G.H. 1992, ApJ, 388, 268
- Ciardullo et al. (1998) Ciardullo, R., Jacoby, G.H., Feldmeier, J.J., & Bartlett, R.E. 1998, ApJ, 492, 62
- Ciardullo et al. (1989) Ciardullo, R., Jacoby, G.H., Ford, H.C., & Neill, J.D. 1989, ApJ, 339, 53
- Ciardullo, Jacoby, & Ford (1989) Ciardullo, R., Jacoby, G.H., & Ford, H.C. 1989, ApJ, 344, 715
- Ciardullo, Jacoby, & Harris (1991) Ciardullo, R., Jacoby, G.H., & Harris, W.E. 1991, ApJ, 383, 487
- Ciardullo, Jacoby, & Tonry (1993) Ciardullo, R., Jacoby, G.H., & Tonry, J.L. 1993, ApJ, 419, 479
- Ciardullo, Kuzio, & Simone (2001) Ciardullo, R., Kuzio, R.E., & Simone, A. 2001, BAAS, 33, 1510
- Ciatti & Rosino (1977) Ciatti, F., & Rosino, L. 1977, A&A, 56, 59
- de Vaucouleurs (1985) de Vaucouleurs, G. 1985, in ESO Workshop on the Virgo Cluster of Galaxies, ed. O.-G. Richter & B. Binggeli (Garching: ESO), 413
- de Vaucouleurs & Longo (1988) de Vaucouleurs, A., & Longo, G. 1988, Catalogue of Visual and Infrared Photometry of Galaxies from 0.5 Micron to 10 Micron (Austin, University of Texas)
- Dopita, Jacoby, & Vassiliadis (1992) Dopita, M.A., Jacoby, G.H., & Vassiliadis, E. 1992, ApJ, 389, 27
- Drinkwater, Gregg, & Colless (2001) Drinkwater, M.J., Gregg, M.D., & Colless, M. 2001, ApJ, 548, L139
- Durrell, Harris, & Pritchet (2001) Durrell, P.R., Harris, W.E., & Pritchet, C.J. 2001, AJ, 121, 2557
- Elson (1997) Elson, R.A.W. 1997, MNRAS, 286, 771
- Feast (1999) Feast, M. 1999, PASP, 111, 775
- Feast & Catchpole (1997) Feast, M.W., & Catchpole, R.W. 1997, MNRAS, 286, L1
- Feldmeier, Ciardullo, & Jacoby (1997) Feldmeier, J.J., Ciardullo, R., & Jacoby, G.H. 1997, ApJ, 479, 231
- Ferrarese et al. (2000a) Ferrarese, L., Ford, H.C., Huchra, J., Kennicutt, R.C., Mould, J.R., Sakai, S., Freedman, W.L., Stetson, P.B., Madore, B.F., Gibson, B.K., Graham, J.A., Hughes, S.M., Illingworth, G.D., Kelson, D.D., Macri, L., Sebo, K., & Silbermann, N.A. 2000a, ApJS, 128, 431
- Ferrarese et al. (2000b) Ferrarese, L., Mould, J.R., Kennicutt, R.C., Huchra, J., Ford, H.C., Freedman, W.L., Stetson, P.B., Madore, B.F., Sakai, S., Gibson, B.K., Graham, J.A., Hughes, S.M., Illingworth, G.D., Kelson, D.D., Macri, L., Sebo, K., & Silbermann, N.A. 2000b, ApJ, 529, 745
- Ford et al. (1996) Ford, H.C., Hui, X., Ciardullo, R., Jacoby, G.H., & Freeman, K.C. 1996, ApJ, 458, 455
- Freedman & Madore (1988) Freedman, W.L., & Madore, B.F. 1988, ApJ, 332, L63
- Freedman et al. (2001) Freedman, W.L., Madore, B.F., Gibson, B.K., Ferrarese, L., Kelson, D.D., Sakai, S., Mould, J.R., Kennicutt, R.C. Jr., Ford, H.C., Graham, J.A., Huchra, J.P., Hughes, S.M.G., Illingworth, G.D., Macri, L.M., & Stetson, P.B. 2001, ApJ, 553, 47
- Freedman, Wilson, & Madore (1991) Freedman, W.L., Wilson, C.D., & Madore, B.F. 1991, ApJ, 372, 455
- Graham et al. (1997) Graham, J.A., Phelps, R.L., Freedman, W.L., Saha, A., Ferrarese, L., Stetson, P.B., Madore, B.F., Silbermann, N.A., Sakai, S., Kennicutt, R.C., Harding, P., Bresolin,F., Turner, A., Mould, J.R., Rawson, D.M., Ford, H.C., Hoessel, J.G., Han, M., Huchra, J.P., Macri, L.M., Hughes, S.M., Illingworth, G.D., & Kelson, D.D. 1997, ApJ, 477, 535
- Grevesse, Noels, & Sauval (1996) Grevesse, N., Noels, A., & Sauval, A.J. 1996, in ASP Conf. Ser. 99, Cosmic Abundances, eds. S.S. Holt & G. Sonneborn (San Francisco: ASP), 117
- Gould & Uza (1998) Gould, A., & Uza, O. 1998, ApJ, 494, 118
- Greenhill et al. (1995) Greenhill, L.J., Henkel, C., Becker, R., Wilson, T.L., & Wouterloot, J.G.A. 1995, A&A, 304, 21
- Hamabe & Okamura (1982) Hamabe, M., & Okamura, S. 1982, Ann. Tokyo Astron. Obs., 2nd Ser., 18, 191
- Harris, Harris, & Poole (1999) Harris, G.L.H., Harris, W.E., & Poole, G.B. 1999, AJ, 117, 855
- Herrnstein et al. (1999) Herrnstein, J.R., Moran, J.M., Greenhill, L.J., Diamond, P.J., Inoue, M., Nakai, N., Miyoshi, M., Henkel, C., & Riess, A. 1999, Nature, 400, 539
- Huchra (1987) Huchra, J.P. 1987, in Proc. 13th Texas Symposium on Relativisitic Astrophysics, ed. M.P. Ulmer (Singapore: World Scientific), 1
- Hui et al. (1993) Hui, X., Ford, H.C., Ciardullo, R., & Jacoby, G.H. 1993, ApJ, 414, 463
- Hui, Ford, & Jacoby (1994) Hui, X., Ford, H., & Jacoby, G. 1994, BAAS, 26, 938
- Humason, Mayall, & Sandage (1956) Humason, M.L., Mayall, N.U., & Sandage, A.R. 1956, AJ, 61, 97
- Jacoby et al. (1992) Jacoby, G.H., Branch, D., Ciardullo, R., Davies, R.L., Harris, W.E., Pierce, M.J., Pritchet, C.J., Tonry, J.L., & Welch, D.L. 1992, PASP, 104, 599
- Jacoby, Ciardullo, & Ford (1990) Jacoby, G.H., Ciardullo, R., & Ford, H.C. 1990, ApJ, 356, 332
- Jacoby, Ciardullo, & Harris (1996) Jacoby, G.H., Ciardullo, R., & Harris, W.E. 1996, ApJ, 462, 1
- Jacoby et al. (1989) Jacoby, G.H., Ciardullo, R., Ford, H.C., & Booth, J. 1989, ApJ, 344, 70
- Jacoby & De Marco (2002) Jacoby, G.H., & De Marco, O. 2002, AJ, 123, 269
- Jacoby, Quigley, & Africano (1987) Jacoby, G.H., Quigley, R.J., & Africano, J.L. 1987, PASP, 99, 672
- Jacoby, Walker, & Ciardullo (1990) Jacoby, G.H., Walker, A.R., & Ciardullo, R. 1990, ApJ, 365, 471
- Jensen et al. (2001) Jensen, J.B., Tonry, J.L., Thompson, R.I., Ajhar, E.A., Lauer, T.R., Rieke, M.J., Postman, M., & Liu, M.C. 2001, ApJ, 550, 503
- Karachentsev et al. (2002) Karachentsev, I.D., Sharina, M.E., Dolphin, A.E., Grebel, E.K., Geisler, D., Guhathakurta, P., Hodge, P.W., Karachentseva, V.E., Sarajedini, A., & Seitzer, P. 2002, A&A, 385, 31
- Kelson et al. (2000) Kelson, D.D., Illingworth, G.D., Tonry, J.L., Freedman, W.L., Kennicutt, R.C., Mould, J.R., Graham, J.A., Huchra, J.P., Macri, L.M., Madore, B.F., Ferrarese, L., Gibson, B.K., Sakai, S., Stetson, P.B., Ajhar, E.A., Blakeslee, J.P., Dressler, A., Ford, H.C., Hughes, S.M.G., Sebo, K.M., & Silbermann, N.A. 2000, ApJ, 529, 768
- Kennicutt et al. (1998) Kennicutt, R.C., Stetson, P.B., Saha, A., Kelson, D., Rawson, D.M., Sakai, S., Madore, B.F., Mould, J.R., Freedman, W.L., Bresolin, F., Ferrarese, L., Ford, H., Gibson, B.K., Graham, J.A., Han, M., Harding, P., Hoessel, J.G., Huchra, J.P., Hughes, S.M.G., Illingworth, G.D., Macri, L.M., Phelps, R.L., Silbermann, N.A., Turner, A.M., & Wood, P.R. 1998, ApJ, 498, 181
- Kim et al. (2002) Kim, M., Kim, E., Lee, M.G., Sarajedini, A., & Geisler, D. 2002, AJ, 123, 244
- Kochanek (1997) Kochanek, C.S. 1997, ApJ, 491, 13
- Kormendy & Bahcall (1974) Kormendy, J., & Bahcall, J.N. 1974, AJ, 79, 671
- Kraan-Korteweg, Cameron, & Tammann (1988) Kraan-Korteweg, R.C., Cameron, L.M., & Tammann, G.A. 1988, ApJ, 331, 620
- Layden et al. (1996) Layden, A.C., Hanson, R.B., Hawley, S.L., Klemola, A.R., & Hanley, C.J. 1996, AJ, 112, 2110
- Lee, Freedman & Madore (1993) Lee, M.G., Freedman, W.L., & Madore, B.F. 1993, ApJ, 417, 553
- Macri et al. (2000) Macri, L.M., Huchra, J.P., Sakai, S., Mould, J.R., & Hughes, S.M. 2000, ApJS, 128, 461
- Madore & Freedman (1995) Madore, B.F., & Freedman, W.L. 1995, AJ, 109, 1645
- Magrini et al. (2000) Magrini, L., Corradi, R.L.M., Mampaso, A., & Perinotto, M. 2000, A&A, 355, 713
- Magrini et al. (2001a) Magrini, L., Cardwell, A., Corradi, R.L.M., Mampaso, A., & Perinotto, M. 2001a, A&A, 367, 498
- Magrini et al. (2001b) Magrini, L., Perinotto, M., Corradi, R.L.M., & Mampaso, A. 2001b, A&A, 379, 90
- Massey et al. (1988) Massey, P., Strobel, K., Barnes, J.V., & Anderson, E. 1988, ApJ, 328, 315
- McMillan, Ciardullo, & Jacoby (1993) McMillan, R., Ciardullo, R., & Jacoby, G.H. 1993, ApJ, 416, 62
- McMillan, Ciardullo, & Jacoby (1994) McMillan, R., Ciardullo, R., & Jacoby, G.H. 1994, AJ, 108, 1610
- Méndez et al. (1993) Méndez, R.H., Kudritzki, R.P., Ciardullo, R., & Jacoby, G.H. 1993, A&A, 275, 534
- Méndez et al. (2001) Méndez, R.H., Riffeser, A., Kudritzki, R.-P., Matthias, M., Freeman, K.C., Arnaboldi, M., Capaccioli, M., & Gerhard, O.E. 2001, ApJ, 563, 135
- McClure & Racine (1969) McClure, R.D., & Racine, R. 1969, AJ, 74, 1000
- Meatheringham & Dopita (1991a) Meatheringham, S.J., & Dopita, M.A. 1991a, ApJS, 75, 407
- Meatheringham & Dopita (1991b) Meatheringham, S.J., & Dopita, M.A. 1991b, ApJS, 76, 1085
- Miyoshi et al. (1995) Miyoshi, M., Moran, J., Herrnstein, J., Greenhill, L., Nakai, N., Diamond, P., & Inoue, M. 1995, Nature, 373, 127
- Monet et al. (1998) Monet, D., Bird, A., Canzian, B., Dahn, C., Guetter, H., Harris, H., Henden, A., Levine, S., Luginbuhl, C., Monet, A.K.B., Rhodes, A., Riepe, B., Sell, S., Stone, R., Vrba, F., & Walker, R. 1998, PMM USNO-A2.0: A Catalogue of Astrometric Standards (Washington, DC: US Naval Obs.)
- Newman et al. (2001) Newman, J.A., Ferrarese, L., Stetson, P.B., Maoz, E., Zepf, S.E., Davis, M., Freedman, W.L., & Madore, B.F. 2001, ApJ, 553, 562
- Panagia (1999) Panagia, N. 1999, in IAU Symp. 190, ed. Chu, Y.-H., Suntzeff, N., Hesser, J., & Bohlender, D. (Dordrecht, Kluwer), 549
- Panagia et al. (1991) Panagia, N., Gilmozzi, R., Macchetto, F., Adorf, H.-M., & Kirshner, R.P. 1991, ApJ, 380, L23
- Peimbert & Torres-Peimbert (1981) Peimbert, M., & Torres-Peimbert, S. 1981, ApJ, 245, 845
- Persson, Frogel, & Aaronson (1979) Persson, S.E., Frogel, J.A., & Aaronson, M. 1979, ApJS, 39, 61
- Phillips et al. (1992) Phillips, M.M., Jacoby, G.H., Walker, A.R., Tonry, J.L., & Ciardullo, R. 1992, BAAS, 24, 749
- Pottasch (1990) Pottasch, S.R. 1990, A&A, 236, 231
- Reid (1997) Reid, I.N. 1997, AJ, 114, 161
- Richer (1993) Richer, M.G. 1993, ApJ, 415, 240
- Rots (1978) Rots, A.H. 1978, AJ, 83, 219
- Lasker et al. (1990) Lasker, B.M., Sturch, C.R., McLean, B.J., Russell, J.L., Jenkner, H., & Shara, M.M. 1990, AJ, 99, 2019
- Saha et al. (1999) Saha, A, Sandage, A., Tammann, G.A., Labhardt, L., Macchetto, F.D., & Panagia, N. 1999, ApJ, 522, 802
- Sakai et al. (1997) Sakai, S., Madore, B.F., Freeman, W.L., Lauer, T.R., Ajhar, E.A., & Baum, W.A. 1997, ApJ, 478, 49
- Sakai, Zaritsky, & Kennicutt (2000) Sakai, S., Zaritsky, D., & Kennicutt, R.C. 2000, AJ, 119, 1197
- Sandage & Tammann (1982) Sandage, A., & Tammann, G.A. 1982, ApJ, 256, 339
- Sasselov et al. (1997) Sasselov, D.D., Beaulieu, J.P., Renault, C., Grison, P., Ferlet, R., Vidal-Madjar, A., Maurice, E., Prévot, L., Aubourg, E., Bareyre, P., Brehin, S., Coutures, C., Delabrouille, N., de Kat, J., Gros, M., Laurent, B., Lachièze-Rey, M., Lesquoy, E., Magneville, C., Milsztajn, A., Moscoso, L., Queinnec, F., Rich, J., Spiro, M., Vigroux, L., Zylberajch, S., Ansari, R., Cavalier, F., Moniez, M., Gry, C., Guibert, J., Moreau, O., & Tajhmady, F. 1997, A&A, 324, 471.
- Schlegel, Finkbeiner, & Davis (1998) Schlegel, D.J., Finkbeiner, D.P., & Davis, M. 1998, ApJ, 500, 525
- Shaver et al. (1983) Shaver, P.A., McGee, R.X., Newton, L.M., Danks, A.C., & Pottasch, S.R. 1983, MNRAS, 204, 53
- Soffner et al. (1996) Soffner, T., Méndez, R.H., Jacoby, G.H., Ciardullo, R., Roth, M.M., & Kudritzki, R.P. 1996, A&A, 306, 9
- Stetson (1987) Stetson, P.B. 1987, PASP, 99, 191
- Stetson (1992) Stetson, P.B. 1992, in ASP Conf. Ser. 25, Astronomical Data Analysis Software and Systems I., eds. D.M. Worral, C. Biemesderfer, & J. Barnes (San Francisco: ASP), 297
- Stetson, Davis, & Crabtree (1990) Stetson, P.B., Davis, L.E., & Crabtree, D.R. 1990, in ASP Conf. Ser. 8, CCDs in Astronomy, ed. G.H. Jacoby (San Francisco: ASP), 289.
- Stone (1977) Stone, R.P.S. 1977, ApJ, 218, 767
- Tammann & Sandage (1968) Tammann, G.A., & Sandage, A. 1968, ApJ, 151, 825
- Tonry et al. (2001) Tonry, J.L., Dressler, A., Blakeslee, J.P., Ajhar, E.A., Fletcher, A.B., Luppino, G.A., Metzger, M.R., & Moore, C.B. 2001, ApJ, 546, 681
- Udalski (2000) Udalski, A. 2000, ApJ, 531, L25
- Udalski et al. (1999) Udalski, A., Szymański, M., Kubiak, M., Pietrzyński, G., Soszyński, I., Woźniak, P., & Żebruń, K. 1999, Act. Astr., 49, 201
- Udalski et al. (2001) Udalski, A., Wyrzykowski, L., Pietrzyński, G., Szewczyk, O., Szymański, M., Kubiak, M., Soszyński, I., & Żebruń, K. 2001, Act. Astr., 51, 221
- Van Dyk et al. (2000) Van Dyk, S.D., Peng, C.Y., King, J.Y., Filippenko, A.V., Treffers, R.R., Li, W., & Richmond, M.W. 2000, PASP, 112, 1532
- Vassiliadis et al. (1992) Vassiliadis, E., Dopita, M.A., Morgan, D.H., & Bell, J.F. 1992, ApJS, 83, 87
- Watson & Wallin (1994) Watson, W.D., & Wallin, B.K. 1994, ApJ, 432, L35
- Watanabe et al. (2001) Watanabe, M., Yasuda, N., Itoh, N., Ichikawa, T., & Yanagisawa, K. 2001, ApJ, 555, 215
- Welch et al. (1986) Welch, D.L., McAlary, C.W., McLaren, R.A., & Madore, B.F. 1986, ApJ, 305, 583
- Wells et al. (1994) Wells, L.A., Phillips, M.M., Suntzeff, N.B., Heathcote, S.R., Hamuy, M., Navarrete, M., Fernandez, M., Weller, W.G., Schommer, R.A., Kirshner, R.P., Leibundgut, B., Willner, S.P., Peletier, R.F., Schlegel, E.M., Wheeler, J.C., Harkness, R.P., Bell, D.J., Matthews, J.M., Filippenko, A.V., Shields, J.C., Richmond, M.W., Jewitt, D., Luu, J., Tran, H.D., Appleton, P.N., Robson, E.I., Tyson, J.A., Guhathakurta, P., Eder, J.A., Bond, H.E., Potter, M., Veilleux, S., Porter, A.C., Humphreys, R.M., Janes, K.A., Williams, T.B., Costa, E., Ruíz, M.T., Lee, J.T., Lutz, J.H., Rich, R.M., Winkler, P.F., & Tyson, N.D. 1994, AJ, 108, 2233
- West & Blakeslee (2000) West, M.J., & Blakeslee, J.P. 2000, ApJ, 543, L27
| Image Scale | Exp time (min) | Limiting | ||||||||
|---|---|---|---|---|---|---|---|---|---|---|
| Galaxy | Telescope | Detector | Field-of-View | (per pixel) | Filter | Date | [O III] | H | Seeing | |
| M31’s bulge | KPNO 2.1 m | T1KA | KP1413 | 1994 Jan | 75 | 45 | 24.0 | |||
| NGC 2403 | KPNO 4 m | T2KB | KP1389 | 1996 Nov | 135 | 45 | 24.1 | |||
| NGC 3115 North | KPNO 4 m | RCA3 | 5016/28 | 1985 Mar | 180 | 26.2 | ||||
| NGC 3115 South | KPNO 4 m | RCA3 | 5016/28 | 1985 Mar | 240 | 26.2 | ||||
| NGC 3351 | WIYN | MiniMo | 5027/30 | 2001 Mar | 180 | 45 | 26.3 | |||
| NGC 3627 | KPNO 4 m | T2KB | 5027/30 | 1997 Mar | 240 | 45 | 26.2 | |||
| NGC 4258 | WIYN | MiniMo | KP1590 | 2001 Mar | 120 | 40 | 25.6 | |||
| NGC 5866 | KPNO 4 m | TI2 | 5016/28 | 1985 Apr | 180 | 26.7 | ||||
| ID | R | |||
|---|---|---|---|---|
| 1 | 0 42 46.10 | 41 16 40.9 | 20.51 | 3.5 |
| 2 | 0 42 45.93 | 41 16 24.3 | 21.84 | 0.9 |
| 3 | 0 42 43.73 | 41 16 25.7 | 20.85 | 3.3 |
| 5 | 0 42 42.34 | 41 15 53.7 | 21.07 | 3.3 |
| 7 | 0 42 43.27 | 41 15 56.5 | 21.62 | 1.5 |
| 8 | 0 42 43.86 | 41 16 01.1 | 21.49 | 2.1 |
| 9 | 0 42 45.15 | 41 16 05.4 | 21.28 | 2.4 |
| 10 | 0 42 46.66 | 41 16 09.7 | 21.12 | 2.2 |
| 12 | 0 42 47.50 | 41 16 21.3 | 20.70 | 3.0 |
| 13 | 0 42 47.25 | 41 16 28.7 | 21.48 | 2.1 |
| 14 | 0 42 46.88 | 41 16 55.7 | 22.28 | 1.4 |
| 15 | 0 42 46.35 | 41 17 02.0 | 21.43 | 1.0 |
| 16 | 0 42 40.91 | 41 16 11.7 | 21.83 | 3.8 |
| 17 | 0 42 39.74 | 41 15 49.2 | 20.71 | 2.8 |
| 18 | 0 42 39.72 | 41 15 36.6 | 20.88 | 2.2 |
| 20 | 0 42 43.05 | 41 15 36.8 | 21.63 | 2.0 |
| 21 | 0 42 45.15 | 41 15 23.6 | 21.11 | 3.5 |
| 23 | 0 42 48.89 | 41 16 55.5 | 21.34 | 2.9 |
| 24 | 0 42 53.31 | 41 16 27.9 | 21.28 | 3.0 |
| 25 | 0 42 54.60 | 41 16 24.3 | 21.73 | 2.8 |
| 26 | 0 42 55.44 | 41 16 24.4 | 21.17 | 3.0 |
| 28 | 0 42 52.06 | 41 17 24.5 | 20.65 | 3.2 |
| 29 | 0 42 53.48 | 41 17 33.9 | 21.01 | 3.8 |
| 30 | 0 42 55.40 | 41 17 20.8 | 20.70 | 2.1 |
| 32 | 0 42 53.32 | 41 18 17.1 | 20.79 | 3.3 |
| 35 | 0 42 38.27 | 41 15 33.8 | 21.35 | 3.4 |
| 36 | 0 42 37.38 | 41 15 51.2 | 20.94 | 2.3 |
| 37 | 0 42 37.21 | 41 16 26.7 | 22.05 | 3.0 |
| 38 | 0 42 37.72 | 41 16 43.3 | 21.37 | 1.8 |
| 39 | 0 42 36.40 | 41 16 57.4 | 21.76 | 3.2 |
| 40 | 0 42 36.02 | 41 16 34.4 | 21.51 | 2.8 |
| 41 | 0 42 33.21 | 41 16 49.4 | 20.65 | 3.6 |
| 42 | 0 42 32.74 | 41 16 32.7 | 20.43 | 3.7 |
| 43 | 0 42 31.00 | 41 16 25.3 | 21.20 | 2.6 |
| 44 | 0 42 31.45 | 41 16 14.7 | 21.99 | 2.6 |
| 45 | 0 42 32.50 | 41 15 58.5 | 20.59 | 2.9 |
| 51 | 0 42 34.13 | 41 15 04.8 | 21.02 | 3.6 |
| 52 | 0 42 34.69 | 41 14 44.8 | 21.64 | 2.5 |
| 53 | 0 42 35.25 | 41 14 46.2 | 20.40 | 3.3 |
| 54 | 0 42 37.08 | 41 14 35.5 | 20.61 | 4.0 |
| 55 | 0 42 38.38 | 41 14 34.6 | 21.34 | 3.3 |
| 56 | 0 42 40.69 | 41 14 10.0 | 20.97 | 2.8 |
| 57 | 0 42 42.10 | 41 14 09.5 | 21.10 | 3.3 |
| 58 | 0 42 43.84 | 41 14 50.7 | 21.13 | 1.7 |
| 59 | 0 42 46.04 | 41 15 16.6 | 21.60 | 2.2 |
| 60 | 0 42 47.50 | 41 15 05.2 | 21.49 | 1.8 |
| 61 | 0 42 46.71 | 41 14 21.4 | 20.93 | 3.3 |
| 62 | 0 42 48.89 | 41 15 24.0 | 21.09 | 3.2 |
| 63 | 0 42 49.33 | 41 14 56.7 | 21.76 | 3.8 |
| 64 | 0 42 52.69 | 41 14 15.7 | 20.78 | 3.7 |
| 65 | 0 42 39.39 | 41 14 17.6 | 22.07 | 4.2 |
| 66 | 0 42 40.07 | 41 14 38.3 | 21.97 | 1.2 |
| 70 | 0 42 38.96 | 41 14 56.5 | 21.83 | 1.9 |
| 71 | 0 42 37.49 | 41 14 35.0 | 22.00 | 1.4 |
| 72 | 0 42 46.34 | 41 15 46.3 | 21.40 | 4.2 |
| 74 | 0 42 44.88 | 41 15 21.0 | 21.71 | 1.9 |
| 76 | 0 42 54.56 | 41 15 37.6 | 21.91 | 2.5 |
| 77 | 0 42 54.56 | 41 15 21.9 | 21.96 | 3.1 |
| 78 | 0 42 50.89 | 41 14 47.6 | 21.93 | 0.9 |
| 79 | 0 42 48.62 | 41 14 26.3 | 22.27 | 1.1 |
| 80 | 0 42 57.30 | 41 17 25.5 | 20.98 | 3.2 |
| 81 | 0 42 43.38 | 41 16 57.5 | 22.53 | 1.8 |
| 82 | 0 42 39.76 | 41 17 03.3 | 22.48 | 1.3 |
| 83 | 0 42 41.35 | 41 17 49.5 | 22.30 | 3.7 |
| 87 | 0 42 38.04 | 41 16 52.8 | 22.11 | 1.3 |
| 99 | 0 42 42.43 | 41 13 56.5 | 22.10 | 1.2 |
| 102 | 0 42 39.51 | 41 18 31.4 | 22.62 | 1.6 |
| 103 | 0 42 40.16 | 41 18 41.9 | 22.63 | 1.3 |
| 112 | 0 42 49.63 | 41 18 41.0 | 22.76 | 2.2 |
| 120 | 0 42 56.07 | 41 17 32.6 | 22.22 | 1.2 |
| 136 | 0 42 57.16 | 41 16 59.2 | 22.11 | 2.0 |
| 137 | 0 42 50.10 | 41 15 26.7 | 22.26 | 1.1 |
| 139 | 0 42 43.07 | 41 14 09.3 | 22.53 | 0.9 |
| 141 | 0 42 41.34 | 41 14 07.4 | 22.08 | 2.8 |
| 142 | 0 42 32.86 | 41 15 58.2 | 21.88 | 2.6 |
| 143 | 0 42 38.36 | 41 14 27.7 | 22.53 | 2.8 |
| 160 | 0 42 40.21 | 41 13 51.0 | 22.82 | 1.8 |
| 164 | 0 42 49.26 | 41 13 53.6 | 22.24 | 3.0 |
| 165 | 0 42 47.56 | 41 14 59.8 | 22.66 | 2.4 |
| 166 | 0 42 49.00 | 41 14 42.7 | 22.61 | 2.1 |
| 171 | 0 42 56.89 | 41 14 08.8 | 23.32 | 2.5 |
| 174 | 0 42 42.14 | 41 14 22.7 | 22.57 | 3.4 |
| 175 | 0 42 55.76 | 41 16 16.1 | 22.12 | 2.5 |
| 176 | 0 42 54.19 | 41 15 28.0 | 23.05 | 1.3 |
| 181 | 0 42 40.33 | 41 14 10.0 | 21.97 | 2.8 |
| 189 | 0 42 57.36 | 41 17 14.8 | 22.87 | 1.0 |
| 190 | 0 42 55.31 | 41 18 15.0 | 22.67 | 1.4 |
| 191 | 0 42 56.91 | 41 18 14.4 | 23.11 | 2.9 |
| 316 | 0 42 44.23 | 41 16 03.7 | 21.04 | 2.9 |
| 323 | 0 42 45.24 | 41 15 29.6 | 22.15 | 1.2 |
| 328 | 0 42 49.34 | 41 16 12.3 | 22.29 | 0.7 |
| 330 | 0 42 49.58 | 41 16 50.6 | 22.29 | 1.0 |
| 420 | 0 42 30.29 | 41 14 07.7 | 23.35 | 0.5 |
| 421 | 0 42 30.71 | 41 17 53.3 | 23.38 | 3.4 |
| 423 | 0 42 31.33 | 41 14 25.9 | 23.37 | 2.1 |
| 424 | 0 42 31.95 | 41 17 32.4 | 23.14 | 2.5 |
| 427 | 0 42 34.09 | 41 16 48.4 | 23.73 | 0.6 |
| 428 | 0 42 34.10 | 41 16 31.2 | 22.67 | 1.8 |
| 431 | 0 42 35.19 | 41 17 27.9 | 23.04 | 0.6 |
| 433 | 0 42 35.78 | 41 13 50.3 | 22.72 | 1.6 |
| 434 | 0 42 35.68 | 41 18 23.3 | 23.44 | 0.4 |
| 440 | 0 42 38.67 | 41 14 09.9 | 23.09 | 1.2 |
| 441 | 0 42 38.96 | 41 13 59.7 | 23.71 | 0.1 |
| 442 | 0 42 39.99 | 41 16 20.0 | 23.43 | 0.6 |
| 443 | 0 42 40.03 | 41 15 52.3 | 23.03 | 3.0 |
| 445 | 0 42 40.56 | 41 17 24.7 | 23.03 | 1.9 |
| 447 | 0 42 41.26 | 41 18 21.0 | 23.21 | 1.9 |
| 449 | 0 42 41.51 | 41 15 01.5 | 22.65 | 2.3 |
| 453 | 0 42 44.45 | 41 18 13.0 | 23.34 | 0.5 |
| 454 | 0 42 45.79 | 41 16 01.5 | 22.62 | 1.1 |
| 455 | 0 42 45.97 | 41 18 24.8 | 22.92 | 1.6 |
| 460 | 0 42 48.12 | 41 17 33.9 | 22.94 | 2.9 |
| 462 | 0 42 51.31 | 41 15 56.6 | 21.94 | 3.2 |
| 464 | 0 42 50.53 | 41 18 35.6 | 23.60 | 1.5 |
| 465 | 0 42 50.74 | 41 17 36.1 | 24.31 | 3.3 |
| 466 | 0 42 51.71 | 41 16 04.7 | 23.41 | 0.8 |
| 467 | 0 42 51.94 | 41 17 05.4 | 23.81 | 4.0 |
| 468 | 0 42 52.22 | 41 15 53.3 | 23.22 | 1.2 |
| 471 | 0 42 53.00 | 41 17 15.9 | 24.50 | 0.5 |
| 472 | 0 42 53.69 | 41 13 59.8 | 23.25 | 1.5 |
| 473 | 0 42 53.90 | 41 17 02.4 | 23.06 | 0.4 |
| 474 | 0 42 54.07 | 41 15 04.3 | 23.29 | 0.7 |
| 476 | 0 42 54.21 | 41 14 17.6 | 22.83 | 3.2 |
| 477 | 0 42 55.03 | 41 17 02.4 | 22.86 | 1.7 |
| 478 | 0 42 55.23 | 41 17 12.1 | 22.09 | 0.8 |
| 570 | 0 42 55.60 | 41 16 23.8 | 22.12 | 2.4 |
| 571 | 0 42 43.02 | 41 15 32.2 | 22.29 | 1.1 |
| 572 | 0 42 42.92 | 41 16 16.3 | 22.33 | 1.6 |
| 573 | 0 42 44.79 | 41 16 59.3 | 22.39 | 1.5 |
| 574 | 0 42 44.97 | 41 16 04.1 | 22.44 | 1.5 |
| 575 | 0 42 46.27 | 41 15 23.0 | 22.46 | 1.5 |
| 576 | 0 42 42.90 | 41 15 20.2 | 22.52 | 1.8 |
| 577 | 0 42 43.10 | 41 16 40.7 | 22.72 | 1.5 |
| 578 | 0 42 48.69 | 41 16 09.6 | 22.72 | 2.5 |
| 579 | 0 42 37.99 | 41 16 02.4 | 22.75 | 3.3 |
| 580 | 0 42 54.22 | 41 17 58.1 | 22.75 | 1.9 |
| 581 | 0 42 44.38 | 41 15 05.3 | 22.75 | 3.2 |
| 582 | 0 42 47.56 | 41 18 51.3 | 22.85 | 1.8 |
| 583 | 0 42 47.69 | 41 17 24.3 | 22.89 | 2.5 |
| 584 | 0 42 41.70 | 41 14 28.4 | 22.91 | 1.8 |
| 585 | 0 42 43.84 | 41 17 00.1 | 22.97 | 0.8 |
| 586 | 0 42 42.12 | 41 15 35.6 | 22.99 | 0.7 |
| 587 | 0 42 51.06 | 41 17 06.0 | 23.01 | 2.3 |
| 588 | 0 42 35.38 | 41 14 44.4 | 23.03 | 1.8 |
| 589 | 0 42 44.55 | 41 18 50.2 | 23.04 | 0.4 |
| 590 | 0 42 43.30 | 41 17 13.1 | 23.06 | 0.6 |
| 591 | 0 42 54.35 | 41 14 59.6 | 23.06 | 3.0 |
| 592 | 0 42 45.98 | 41 14 26.4 | 23.06 | 1.1 |
| 593 | 0 42 33.98 | 41 15 02.8 | 23.06 | 1.0 |
| 594 | 0 42 43.29 | 41 16 52.5 | 23.07 | 4.7 |
| 595 | 0 42 47.24 | 41 15 51.2 | 23.07 | 0.8 |
| 596 | 0 42 40.15 | 41 15 22.3 | 23.08 | 1.5 |
| 597 | 0 42 41.55 | 41 15 58.2 | 23.09 | 1.1 |
| 598 | 0 42 45.49 | 41 15 31.8 | 23.10 | 1.2 |
| 599 | 0 42 47.02 | 41 17 07.0 | 23.10 | 2.2 |
| 600 | 0 42 49.30 | 41 17 29.7 | 23.15 | |
| 601 | 0 42 43.21 | 41 14 41.2 | 23.16 | 1.3 |
| 602 | 0 42 49.77 | 41 16 25.0 | 23.16 | 1.2 |
| 603 | 0 42 54.58 | 41 17 16.1 | 23.17 | 2.2 |
| 604 | 0 42 31.84 | 41 16 03.3 | 23.18 | 2.6 |
| 605 | 0 42 35.95 | 41 14 10.7 | 23.19 | 0.5 |
| 606 | 0 42 49.44 | 41 16 31.9 | 23.22 | 1.4 |
| 607 | 0 42 44.08 | 41 15 51.3 | 23.23 | 0.4 |
| 608 | 0 42 48.24 | 41 18 57.8 | 23.23 | 1.8 |
| 609 | 0 42 39.09 | 41 16 34.4 | 23.23 | 1.8 |
| 610 | 0 42 42.32 | 41 16 24.7 | 23.23 | 1.0 |
| 611 | 0 42 43.80 | 41 15 39.3 | 23.26 | 0.7 |
| 612 | 0 42 46.69 | 41 14 57.2 | 23.26 | 2.3 |
| 613 | 0 42 38.97 | 41 15 48.1 | 23.27 | 1.8 |
| 614 | 0 42 47.97 | 41 14 59.0 | 23.29 | 0.5 |
| 615 | 0 42 42.06 | 41 15 37.5 | 23.29 | 0.8 |
| 616 | 0 42 46.67 | 41 18 20.4 | 23.31 | 0.7 |
| 617 | 0 42 41.50 | 41 16 20.0 | 23.32 | 0.8 |
| 618 | 0 42 45.35 | 41 18 44.0 | 23.32 | 2.2 |
| 619 | 0 42 54.68 | 41 18 56.0 | 23.33 | 1.8 |
| 620 | 0 42 40.49 | 41 15 01.5 | 23.33 | 0.7 |
| 621 | 0 42 40.27 | 41 15 44.3 | 23.34 | 1.9 |
| 622 | 0 42 42.63 | 41 16 06.0 | 23.34 | 0.3 |
| 623 | 0 42 40.68 | 41 16 15.9 | 23.35 | 3.8 |
| 624 | 0 42 35.19 | 41 15 03.2 | 23.35 | 0.5 |
| 625 | 0 42 55.03 | 41 17 41.4 | 23.37 | 0.4 |
| 626 | 0 42 39.69 | 41 15 57.6 | 23.37 | 2.7 |
| 627 | 0 42 47.36 | 41 15 46.1 | 23.38 | 0.5 |
| 628 | 0 42 52.01 | 41 18 07.9 | 23.39 | 4.0 |
| 629 | 0 42 44.51 | 41 18 52.0 | 23.39 | |
| 630 | 0 42 45.88 | 41 18 46.0 | 23.40 | 1.8 |
| 631 | 0 42 40.07 | 41 15 07.9 | 23.41 | 1.3 |
| 632 | 0 42 38.45 | 41 18 52.5 | 23.42 | 0.7 |
| 633 | 0 42 45.78 | 41 17 35.2 | 23.42 | 0.4 |
| 634 | 0 42 51.44 | 41 15 51.3 | 23.45 | 1.7 |
| 635 | 0 42 43.93 | 41 18 38.5 | 23.47 | 3.1 |
| 636 | 0 42 37.50 | 41 18 00.4 | 23.51 | 1.5 |
| 637 | 0 42 51.49 | 41 16 19.8 | 23.51 | 2.4 |
| 638 | 0 42 35.98 | 41 15 27.0 | 23.51 | 1.1 |
| 639 | 0 42 40.85 | 41 15 18.5 | 23.53 | 1.1 |
| 640 | 0 42 49.15 | 41 17 25.6 | 23.54 | |
| 641 | 0 42 33.00 | 41 14 34.4 | 23.55 | 1.5 |
| 642 | 0 42 42.12 | 41 18 46.0 | 23.55 | 1.7 |
| 643 | 0 42 42.07 | 41 14 40.6 | 23.56 | 1.6 |
| 644 | 0 42 40.16 | 41 15 32.9 | 23.57 | 0.8 |
| 645 | 0 42 45.65 | 41 14 21.0 | 23.58 | 2.2 |
| 646 | 0 42 35.42 | 41 15 45.5 | 23.60 | 1.0 |
| 647 | 0 42 32.24 | 41 16 44.3 | 23.60 | 1.0 |
| 648 | 0 42 51.43 | 41 18 39.9 | 23.60 | 0.2 |
| 649 | 0 42 51.76 | 41 17 45.1 | 23.65 | 0.2 |
| 650 | 0 42 31.73 | 41 14 41.5 | 23.65 | 2.0 |
| 651 | 0 42 45.07 | 41 17 10.4 | 23.68 | 0.6 |
| 652 | 0 42 40.06 | 41 14 05.5 | 23.68 | 0.8 |
| 653 | 0 42 51.83 | 41 14 25.0 | 23.71 | 3.4 |
| 654 | 0 42 46.56 | 41 15 32.8 | 23.74 | 0.1 |
| 655 | 0 42 43.67 | 41 18 07.7 | 23.75 | 1.4 |
| 656 | 0 42 53.32 | 41 18 27.3 | 23.75 | 0.7 |
| 657 | 0 42 51.87 | 41 15 16.8 | 23.75 | 1.8 |
| 658 | 0 42 47.82 | 41 15 41.9 | 23.77 | 1.4 |
| 659 | 0 42 43.89 | 41 17 32.7 | 23.77 | 1.8 |
| 660 | 0 42 51.72 | 41 18 15.2 | 23.78 | 5.4 |
| 661 | 0 42 35.22 | 41 15 52.9 | 23.79 | 0.5 |
| 662 | 0 42 48.44 | 41 13 57.2 | 23.79 | 1.6 |
| 663 | 0 42 47.93 | 41 14 42.7 | 23.79 | 1.5 |
| 664 | 0 42 43.46 | 41 15 08.6 | 23.80 | 0.6 |
| 665 | 0 42 31.10 | 41 13 50.7 | 23.80 | 1.2 |
| 666 | 0 42 46.13 | 41 18 40.0 | 23.80 | 1.7 |
| 667 | 0 42 41.77 | 41 16 38.2 | 23.81 | 1.8 |
| 668 | 0 42 55.11 | 41 14 29.8 | 23.82 | 0.3 |
| 669 | 0 42 47.04 | 41 15 22.5 | 23.83 | 1.3 |
| 670 | 0 42 47.79 | 41 18 50.8 | 23.84 | 1.8 |
| 671 | 0 42 55.00 | 41 14 27.1 | 23.85 | 1.0 |
| 672 | 0 42 37.29 | 41 16 55.9 | 23.90 | 1.2 |
| 673 | 0 42 45.51 | 41 17 37.0 | 23.92 | 1.9 |
| 674 | 0 42 39.01 | 41 16 36.5 | 23.93 | 0.7 |
| 675 | 0 42 37.85 | 41 15 24.6 | 23.93 | 0.5 |
| 676 | 0 42 51.77 | 41 16 31.4 | 23.94 | 3.1 |
| 677 | 0 42 47.44 | 41 18 38.0 | 23.94 | 1.0 |
| 678 | 0 42 44.47 | 41 17 14.1 | 23.95 | |
| 679 | 0 42 53.00 | 41 16 37.2 | 23.96 | 2.7 |
| 680 | 0 42 52.10 | 41 16 35.6 | 23.96 | 2.1 |
| 681 | 0 42 36.74 | 41 16 18.9 | 23.97 | 1.5 |
| 682 | 0 42 55.61 | 41 16 18.9 | 23.97 | |
| 683 | 0 42 51.74 | 41 15 51.6 | 23.97 | 1.9 |
| 684 | 0 42 36.17 | 41 15 15.4 | 23.99 | |
| 685 | 0 42 50.50 | 41 17 52.9 | 24.01 | 0.9 |
| 686 | 0 42 47.39 | 41 14 27.0 | 24.02 | 1.1 |
| 687 | 0 42 52.45 | 41 16 14.2 | 24.02 | 0.4 |
| 688 | 0 42 48.71 | 41 14 14.9 | 24.02 | 0.9 |
| 689 | 0 42 34.98 | 41 13 54.2 | 24.03 | 1.5 |
| 690 | 0 42 44.33 | 41 14 22.6 | 24.04 | 1.2 |
| 691 | 0 42 33.61 | 41 14 35.7 | 24.05 | 0.5 |
| 692 | 0 42 34.89 | 41 14 32.0 | 24.05 | 1.5 |
| 693 | 0 42 39.31 | 41 14 29.3 | 24.05 | 0.2 |
| 694 | 0 42 39.46 | 41 16 07.2 | 24.06 | 2.0 |
| 695 | 0 42 43.24 | 41 17 53.8 | 24.07 | 1.2 |
| 696 | 0 42 51.94 | 41 18 22.9 | 24.07 | 1.7 |
| 697 | 0 42 56.33 | 41 14 27.3 | 24.07 | 1.1 |
| 698 | 0 42 50.79 | 41 18 17.1 | 24.08 | 1.1 |
| 699 | 0 42 39.11 | 41 18 33.4 | 24.09 | 2.1 |
| 700 | 0 42 56.92 | 41 16 42.8 | 24.09 | 1.8 |
| 701 | 0 42 52.74 | 41 17 50.0 | 24.11 | 1.4 |
| 702 | 0 42 32.61 | 41 15 15.6 | 24.11 | 3.0 |
| 703 | 0 42 31.29 | 41 15 01.0 | 24.11 | 0.5 |
| 704 | 0 42 33.78 | 41 15 37.4 | 24.11 | |
| 705 | 0 42 43.85 | 41 17 47.1 | 24.12 | |
| 706 | 0 42 47.33 | 41 18 03.3 | 24.12 | 1.0 |
| 707 | 0 42 39.76 | 41 16 41.3 | 24.14 | 0.1 |
| 708 | 0 42 31.48 | 41 15 58.8 | 24.15 | 0.6 |
| 709 | 0 42 43.03 | 41 18 09.7 | 24.16 | 1.1 |
| 710 | 0 42 41.40 | 41 14 53.7 | 24.16 | 0.2 |
| 711 | 0 42 50.45 | 41 18 08.2 | 24.17 | 1.3 |
| 712 | 0 42 36.88 | 41 14 19.5 | 24.18 | 0.7 |
| 713 | 0 42 39.56 | 41 18 54.9 | 24.19 | 0.6 |
| 714 | 0 42 38.13 | 41 15 09.3 | 24.20 | 0.6 |
| 715 | 0 42 52.58 | 41 17 07.8 | 24.20 | 0.6 |
| 716 | 0 42 33.31 | 41 16 07.1 | 24.20 | 0.8 |
| 717 | 0 42 33.49 | 41 18 02.8 | 24.21 | 1.5 |
| 718 | 0 42 46.46 | 41 14 24.7 | 24.22 | 0.7 |
| 719 | 0 42 37.27 | 41 15 41.0 | 24.22 | 2.2 |
| 720 | 0 42 55.89 | 41 15 18.3 | 24.23 | 0.6 |
| 721 | 0 42 47.50 | 41 14 03.4 | 24.27 | 0.5 |
| 722 | 0 42 36.13 | 41 17 20.0 | 24.29 | 0.5 |
| 723 | 0 42 35.86 | 41 17 52.1 | 24.30 | 1.7 |
| 724 | 0 42 37.21 | 41 16 47.9 | 24.30 | 0.8 |
| 725 | 0 42 34.61 | 41 18 31.5 | 24.33 | 0.1 |
| 726 | 0 42 46.62 | 41 17 23.9 | 24.34 | 0.7 |
| 727 | 0 42 54.05 | 41 16 59.7 | 24.41 | 2.4 |
| 728 | 0 42 30.01 | 41 16 35.5 | 24.45 | 2.0 |
| 729 | 0 42 38.48 | 41 18 07.8 | 24.45 | 1.3 |
| 730 | 0 42 36.76 | 41 17 42.4 | 24.48 | 1.2 |
| 731 | 0 42 53.53 | 41 17 16.0 | 24.53 | 0.7 |
| 732 | 0 42 48.46 | 41 18 21.8 | 24.53 | 0.7 |
| 733 | 0 42 31.72 | 41 15 51.1 | 24.55 | 0.7 |
| 734 | 0 42 35.18 | 41 14 22.5 | 24.55 | 0.6 |
| 735 | 0 42 35.06 | 41 17 07.5 | 24.73 | 2.0 |
| 736 | 0 42 55.97 | 41 14 41.1 | 24.76 | 1.9 |
| 737 | 0 42 53.04 | 41 17 21.3 | 24.79 | 0.7 |
| 738 | 0 42 32.66 | 41 18 48.7 | 24.82 | 0.8 |
| 739 | 0 42 34.34 | 41 18 40.3 | 24.83 | 1.9 |
| 740 | 0 42 30.25 | 41 18 55.2 | 24.88 | 1.0 |
| 741 | 0 42 34.27 | 41 18 23.7 | 24.88 | 0.5 |
| 742 | 0 42 56.70 | 41 17 55.9 | 24.93 | 2.3 |
| ID | Sample | |||
|---|---|---|---|---|
| 1 | 7 36 20.63 | 65 39 04.2 | 23.30 | S |
| 2 | 7 36 37.38 | 65 36 52.0 | 23.39 | S |
| 3 | 7 37 12.54 | 65 33 20.6 | 23.41 | S |
| 4 | 7 36 51.71 | 65 35 01.1 | 23.56 | |
| 5 | 7 36 57.62 | 65 34 58.2 | 23.60 | S |
| 6 | 7 35 48.67 | 65 35 06.0 | 23.68 | S |
| 7 | 7 36 37.23 | 65 34 21.6 | 23.71 | S |
| 8 | 7 36 36.66 | 65 31 28.1 | 23.73 | S |
| 9 | 7 36 58.06 | 65 36 16.7 | 23.77 | S |
| 10 | 7 37 05.22 | 65 34 04.4 | 23.78 | S |
| 11 | 7 36 23.15 | 65 34 58.6 | 23.79 | S |
| 12 | 7 36 57.97 | 65 34 28.7 | 23.84 | S |
| 13 | 7 36 03.43 | 65 40 31.2 | 23.85 | S |
| 14 | 7 36 05.00 | 65 36 13.6 | 23.88 | S |
| 15 | 7 36 30.93 | 65 37 36.0 | 23.89 | S |
| 16 | 7 37 01.62 | 65 35 32.4 | 23.90 | S |
| 17 | 7 36 03.72 | 65 38 29.5 | 23.91 | S |
| 18 | 7 36 39.47 | 65 35 00.2 | 23.93 | S |
| 19 | 7 36 39.47 | 65 36 51.7 | 23.98 | S |
| 20 | 7 36 19.46 | 65 35 33.3 | 23.98 | S |
| 21 | 7 36 08.88 | 65 36 59.4 | 24.02 | S |
| 22 | 7 36 52.60 | 65 34 31.2 | 24.11 | |
| 23 | 7 36 19.32 | 65 33 05.4 | 24.15 | |
| 24 | 7 37 29.69 | 65 32 13.2 | 24.19 | |
| 25 | 7 36 49.78 | 65 37 11.0 | 24.21 | |
| 26 | 7 37 45.77 | 65 31 52.6 | 24.23 | |
| 27 | 7 37 20.06 | 65 40 26.3 | 24.42 | |
| 28 | 7 35 37.31 | 65 38 49.0 | 24.46 | |
| 29 | 7 37 29.64 | 65 31 19.2 | 24.48 | |
| 30 | 7 37 12.34 | 65 33 10.4 | 24.50 | |
| 31 | 7 36 48.42 | 65 36 58.0 | 24.51 | |
| 32 | 7 35 51.93 | 65 40 00.8 | 24.74 | |
| 33 | 7 36 17.08 | 65 37 00.8 | 24.80 | |
| 34 | 7 36 03.76 | 65 42 28.9 | 24.91 | |
| 35 | 7 36 12.87 | 65 39 21.5 | 24.93 | |
| 36 | 7 37 23.18 | 65 37 28.3 | 25.21 | |
| 37 | 7 37 43.87 | 65 35 08.2 | 25.47 | |
| 38 | 7 36 41.22 | 65 40 41.0 | 25.68 | |
| 39 | 7 36 59.74 | 65 29 37.7 | 25.68 | |
| 40 | 7 37 18.75 | 65 30 01.9 | 25.72 |
| ID | Sample | |||
|---|---|---|---|---|
| 1 | 10 05 09.71 | -7 44 05.0 | 25.29 | |
| 2 | 10 05 14.54 | -7 41 52.8 | 25.40 | S |
| 3 | 10 05 13.61 | -7 43 53.7 | 25.40 | |
| 4 | 10 05 08.09 | -7 44 03.7 | 25.58 | S |
| 5 | 10 05 14.49 | -7 42 34.4 | 25.68 | |
| 6 | 10 05 18.25 | -7 40 04.5 | 25.69 | S |
| 7 | 10 05 14.50 | -7 42 18.2 | 25.73 | |
| 8 | 10 05 10.99 | -7 43 27.2 | 25.73 | |
| 9 | 10 05 09.65 | -7 44 39.7 | 25.79 | S |
| 10 | 10 05 09.35 | -7 42 14.5 | 25.81 | S |
| 11 | 10 05 08.95 | -7 44 37.0 | 25.83 | S |
| 12 | 10 05 16.44 | -7 41 19.3 | 25.84 | S |
| 13 | 10 05 18.59 | -7 42 15.2 | 25.89 | |
| 14 | 10 05 21.25 | -7 40 38.8 | 25.93 | S |
| 15 | 10 05 06.88 | -7 44 44.0 | 25.94 | S |
| 16 | 10 05 06.41 | -7 40 47.9 | 25.96 | S |
| 17 | 10 05 05.04 | -7 45 39.6 | 25.97 | S |
| 18 | 10 05 11.59 | -7 44 20.2 | 25.99 | S |
| 19 | 10 05 19.56 | -7 42 25.9 | 26.00 | S |
| 20 | 10 05 06.28 | -7 41 57.4 | 26.03 | S |
| 21 | 10 05 09.19 | -7 44 14.9 | 26.04 | |
| 22 | 10 05 15.94 | -7 40 58.3 | 26.05 | S |
| 23 | 10 05 21.25 | -7 42 42.1 | 26.06 | S |
| 24 | 10 05 08.89 | -7 44 24.4 | 26.06 | S |
| 25 | 10 05 18.78 | -7 42 28.0 | 26.07 | S |
| 26 | 10 05 07.07 | -7 43 21.5 | 26.07 | S |
| 27 | 10 05 07.85 | -7 41 01.2 | 26.07 | S |
| 28 | 10 05 05.41 | -7 43 46.8 | 26.08 | S |
| 29 | 10 05 08.90 | -7 42 46.1 | 26.09 | S |
| 30 | 10 05 21.06 | -7 40 05.9 | 26.10 | S |
| 31 | 10 05 19.13 | -7 42 09.1 | 26.11 | S |
| 32 | 10 05 19.37 | -7 41 44.9 | 26.14 | S |
| 33 | 10 05 11.63 | -7 44 28.7 | 26.16 | S |
| 34 | 10 05 14.37 | -7 41 01.2 | 26.16 | S |
| 35 | 10 05 20.02 | -7 41 06.4 | 26.16 | S |
| 36 | 10 05 19.88 | -7 41 32.5 | 26.20 | S |
| 37 | 10 05 18.03 | -7 42 36.5 | 26.20 | |
| 38 | 10 05 18.55 | -7 45 21.5 | 26.22 | |
| 39 | 10 05 11.53 | -7 41 02.6 | 26.22 | |
| 40 | 10 05 08.50 | -7 43 26.4 | 26.27 | |
| 41 | 10 05 13.43 | -7 44 46.5 | 26.28 | |
| 42 | 10 05 05.64 | -7 40 48.8 | 26.30 | |
| 43 | 10 05 08.92 | -7 44 20.9 | 26.31 | |
| 44 | 10 05 12.27 | -7 44 37.2 | 26.32 | |
| 45 | 10 05 05.17 | -7 43 26.4 | 26.33 | |
| 46 | 10 05 19.24 | -7 42 01.4 | 26.35 | |
| 47 | 10 05 22.26 | -7 40 28.5 | 26.36 | |
| 48 | 10 05 07.92 | -7 44 58.1 | 26.40 | |
| 49 | 10 05 15.99 | -7 40 16.9 | 26.42 | |
| 50 | 10 05 18.60 | -7 41 53.0 | 26.43 | |
| 51 | 10 05 11.97 | -7 40 47.2 | 26.47 | |
| 52 | 10 05 22.59 | -7 45 20.4 | 26.53 | |
| 53 | 10 05 17.84 | -7 45 00.1 | 26.53 | |
| 54 | 10 05 05.66 | -7 45 59.1 | 26.56 | |
| 55 | 10 05 15.85 | -7 44 36.7 | 26.63 | |
| 56 | 10 05 23.05 | -7 40 14.8 | 26.63 | |
| 57 | 10 05 18.17 | -7 41 51.7 | 26.64 | |
| 58 | 10 05 07.36 | -7 45 36.2 | 26.66 | |
| 59 | 10 05 10.24 | -7 45 55.4 | 26.67 | |
| 60 | 10 05 17.05 | -7 41 21.6 | 26.68 | |
| 61 | 10 05 14.16 | -7 44 21.7 | 26.94 | |
| 62 | 10 05 18.59 | -7 44 37.8 | 27.28 |
| ID | Sample | |||
|---|---|---|---|---|
| 1 | 10 44 00.33 | 11 43 30.1 | 25.67 | S |
| 2 | 10 43 56.28 | 11 44 19.7 | 25.71 | S |
| 3 | 10 44 04.80 | 11 41 37.7 | 25.94 | S |
| 4 | 10 44 01.19 | 11 43 21.2 | 25.95 | S |
| 5 | 10 43 53.53 | 11 41 54.7 | 26.00 | S |
| 6 | 10 43 55.88 | 11 43 20.5 | 26.06 | S |
| 7 | 10 44 06.13 | 11 45 32.6 | 26.07 | S |
| 8 | 10 43 44.31 | 11 43 38.1 | 26.14 | S |
| 9 | 10 43 50.72 | 11 39 23.9 | 26.18 | S |
| 10 | 10 43 47.11 | 11 44 25.2 | 26.21 | S |
| 11 | 10 43 53.06 | 11 40 38.0 | 26.23 | S |
| 12 | 10 43 58.18 | 11 41 31.7 | 26.29 | S |
| 13 | 10 44 03.55 | 11 40 57.8 | 26.35 | |
| 14 | 10 43 51.56 | 11 39 22.3 | 26.35 | |
| 15 | 10 43 50.90 | 11 43 23.3 | 26.37 | |
| 16 | 10 44 04.85 | 11 40 03.5 | 26.40 | |
| 17 | 10 43 56.90 | 11 39 55.5 | 26.46 | |
| 18 | 10 43 54.20 | 11 40 39.9 | 26.48 | |
| 19 | 10 43 46.86 | 11 41 56.4 | 26.51 | |
| 20 | 10 44 06.16 | 11 40 58.6 | 26.61 |
| ID | Sample | |||
|---|---|---|---|---|
| 1 | 11 20 27.08 | 12 58 58.9 | 25.65 | S |
| 2 | 11 20 04.26 | 13 03 32.3 | 25.66 | S |
| 3 | 11 20 25.09 | 13 00 35.0 | 25.68 | S |
| 4 | 11 20 10.82 | 13 01 16.6 | 25.70 | S |
| 5 | 11 20 09.80 | 13 04 37.9 | 25.71 | S |
| 6 | 11 20 10.24 | 13 01 23.6 | 25.72 | S |
| 7 | 11 20 25.32 | 12 58 14.5 | 25.75 | S |
| 8 | 11 20 17.49 | 12 55 11.9 | 25.77 | S |
| 9 | 11 20 08.70 | 12 59 42.5 | 25.79 | S |
| 10 | 11 20 19.23 | 13 04 56.7 | 25.80 | S |
| 11 | 11 20 06.58 | 12 56 14.3 | 25.82 | S |
| 12 | 11 20 25.75 | 12 56 41.4 | 25.84 | S |
| 13 | 11 20 10.92 | 12 56 55.1 | 25.85 | S |
| 14 | 11 20 25.78 | 12 57 49.9 | 25.86 | S |
| 15 | 11 20 10.03 | 13 00 40.1 | 25.86 | S |
| 16 | 11 20 16.81 | 13 03 36.7 | 25.87 | S |
| 17 | 11 20 08.53 | 12 57 26.9 | 25.88 | S |
| 18 | 11 20 06.88 | 13 02 40.2 | 25.88 | S |
| 19 | 11 20 24.43 | 12 59 38.8 | 25.89 | S |
| 20 | 11 20 13.84 | 12:55 27.7 | 25.89 | S |
| 21 | 11 20 09.72 | 13 02 42.8 | 25.91 | S |
| 22 | 11 20 16.73 | 13 01 47.5 | 25.94 | |
| 23 | 11 20 25.92 | 12 56 27.6 | 25.96 | S |
| 24 | 11 20 19.05 | 13 01 52.8 | 25.98 | S |
| 25 | 11 20 16.88 | 12 55 14.2 | 25.99 | S |
| 26 | 11 20 17.01 | 13 03 33.7 | 26.00 | S |
| 27 | 11 20 07.55 | 12 57 30.0 | 26.01 | S |
| 28 | 11 20 14.58 | 12 54 43.0 | 26.03 | S |
| 29 | 11 20 21.14 | 12 57 27.8 | 26.03 | S |
| 30 | 11 20 35.41 | 12 59 35.6 | 26.04 | S |
| 31 | 11 20 04.35 | 13 00 27.7 | 26.05 | S |
| 32 | 11 20 20.65 | 13 00 23.4 | 26.05 | |
| 33 | 11 20 06.15 | 13 01 59.7 | 26.07 | S |
| 34 | 11 20 16.40 | 13 02 56.4 | 26.07 | S |
| 35 | 11 20 18.27 | 12 57 06.8 | 26.10 | S |
| 36 | 11 20 22.19 | 12 55 05.3 | 26.11 | S |
| 37 | 11 20 12.62 | 13 04 35.9 | 26.13 | S |
| 38 | 11 20 06.83 | 13 02 52.7 | 26.14 | S |
| 39 | 11 20 08.10 | 12 59 48.4 | 26.15 | |
| 40 | 11 20 08.35 | 13 02 20.0 | 26.18 | S |
| 41 | 11 19 57.12 | 13 03 00.6 | 26.18 | S |
| 42 | 11 19 51.29 | 12 57 13.2 | 26.20 | S |
| 43 | 11 20 22.39 | 12 56 09.4 | 26.20 | S |
| 44 | 11 20 20.02 | 13 05 10.4 | 26.22 | |
| 45 | 11 20 20.04 | 13 04 06.1 | 26.22 | |
| 46 | 11 20 19.72 | 13 02 34.3 | 26.22 | |
| 47 | 11 20 09.30 | 12 57 45.9 | 26.23 | |
| 48 | 11 20 14.30 | 13 02 49.7 | 26.27 | |
| 49 | 11 20 12.97 | 12 56 12.3 | 26.29 | |
| 50 | 11 20 08.13 | 13 04 00.7 | 26.30 | |
| 51 | 11 20 18.53 | 13 02 08.5 | 26.31 | |
| 52 | 11 20 10.54 | 13 02 07.5 | 26.32 | |
| 53 | 11 20 09.68 | 12 57 05.9 | 26.36 | |
| 54 | 11 19 59.11 | 12 58 36.5 | 26.37 | |
| 55 | 11 20 10.18 | 12 56 09.5 | 26.40 | |
| 56 | 11 20 19.79 | 12 55 18.3 | 26.41 | |
| 57 | 11 20 20.27 | 13 04 10.8 | 26.42 | |
| 58 | 11 20 13.86 | 12 56 39.6 | 26.43 | |
| 65 | 11 20 05.15 | 13 04 30.8 | 26.45 | |
| 60 | 11 20 20.60 | 13 01 36.6 | 26.45 | |
| 61 | 11 20 25.85 | 12 58 25.8 | 26.45 | |
| 62 | 11 20 15.08 | 12 56 09.6 | 26.50 | |
| 63 | 11 20 05.54 | 13 05 02.3 | 26.53 | |
| 64 | 11 20 09.23 | 13 04 35.6 | 26.54 | |
| 65 | 11 20 05.53 | 13 02 01.9 | 26.63 | |
| 66 | 11 20 30.61 | 12 55 47.6 | 26.66 | |
| 67 | 11 20 08.79 | 12 55 36.7 | 26.68 | |
| 68 | 11 19 58.19 | 13 03 58.8 | 26.69 | |
| 69 | 11 20 24.33 | 12 59 48.8 | 26.70 | |
| 70 | 11 20 20.56 | 13 00 57.9 | 26.73 | |
| 71 | 11 20 19.31 | 13 02 14.4 | 26.73 | |
| 72 | 11 20 20.10 | 12 54 41.2 | 26.77 | |
| 73 | 11 20 00.15 | 13 00 29.3 | 27.04 |
| ID | Sample | |||
|---|---|---|---|---|
| 1 | 12 19 08.60 | 47 14 14.0 | 25.03 | S |
| 2 | 12 18 33.59 | 47 20 36.2 | 25.06 | S |
| 3 | 12 18 46.93 | 47 19 45.5 | 25.15 | S |
| 4 | 12 18 50.73 | 47 20 01.4 | 25.17 | S |
| 5 | 12 18 29.91 | 47 21 35.4 | 25.20 | S |
| 6 | 12 18 45.97 | 47 20 15.5 | 25.29 | S |
| 7 | 12 18 42.40 | 47 21 57.2 | 25.29 | S |
| 8 | 12 18 59.21 | 47 20 44.5 | 25.30 | S |
| 9 | 12 18 47.00 | 47 19 47.8 | 25.30 | S |
| 10 | 12 19 12.17 | 47 16 26.9 | 25.31 | S |
| 11 | 12 18 51.86 | 47 21 43.6 | 25.33 | S |
| 12 | 12 19 04.54 | 47 18 46.8 | 25.34 | S |
| 13 | 12 18 34.94 | 47 20 59.1 | 25.34 | S |
| 14 | 12 18 46.18 | 47 21 08.1 | 25.36 | S |
| 15 | 12 18 33.86 | 47 19 36.3 | 25.37 | S |
| 16 | 12 18 54.99 | 47 21 18.2 | 25.37 | S |
| 17 | 12 18 44.11 | 47 22 00.5 | 25.37 | S |
| 18 | 12 19 14.20 | 47 13 46.2 | 25.39 | S |
| 19 | 12 18 42.41 | 47 21 57.3 | 25.39 | S |
| 20 | 12 18 48.22 | 47 17 42.3 | 25.40 | S |
| 21 | 12 19 15.42 | 47 16 51.9 | 25.40 | S |
| 22 | 12 19 10.77 | 47 16 51.5 | 25.41 | S |
| 23 | 12 19 17.25 | 47 15 29.0 | 25.43 | S |
| 24 | 12 19 13.12 | 47 15 57.1 | 25.44 | S |
| 25 | 12 18 54.81 | 47 13 51.7 | 25.55 | S |
| 26 | 12 19 03.19 | 47 13 52.1 | 25.56 | S |
| 27 | 12 18 29.11 | 47 21 47.0 | 25.56 | S |
| 28 | 12 18 44.42 | 47 22 12.9 | 25.58 | S |
| 29 | 12 18 44.10 | 47 21 47.3 | 25.60 | |
| 30 | 12 18 31.22 | 47 20 23.5 | 25.60 | |
| 31 | 12 19 02.52 | 47 14 14.0 | 25.62 | |
| 32 | 12 19 17.96 | 47 14 15.6 | 25.62 | |
| 33 | 12 19 07.97 | 47 16 15.3 | 25.63 | |
| 34 | 12 19 11.66 | 47 16 58.2 | 25.65 | |
| 35 | 12 19 09.35 | 47 14 17.4 | 25.66 | |
| 36 | 12 18 51.26 | 47 16 46.3 | 25.66 | |
| 37 | 12 18 53.02 | 47 16 11.6 | 25.66 | |
| 38 | 12 19 12.95 | 47 20 15.1 | 25.68 | |
| 39 | 12 18 44.09 | 47 19 06.8 | 25.68 | |
| 40 | 12 18 48.94 | 47 21 49.2 | 25.69 | |
| 41 | 12 19 12.50 | 47 17 08.0 | 25.70 | |
| 42 | 12 18 51.61 | 47 20 03.6 | 25.72 | |
| 43 | 12 18 52.63 | 47 15 07.1 | 25.73 | |
| 44 | 12 19 01.34 | 47 20 21.4 | 25.74 | |
| 45 | 12 18 47.79 | 47 19 33.2 | 25.75 | |
| 46 | 12 18 58.47 | 47 15 02.0 | 25.75 | |
| 47 | 12 18 43.63 | 47 21 54.1 | 25.77 | |
| 48 | 12 18 50.12 | 47 15 44.8 | 25.80 | |
| 49 | 12 18 40.53 | 47 16 46.5 | 25.85 | |
| 50 | 12 19 02.91 | 47 15 04.3 | 25.86 | |
| 51 | 12 19 06.06 | 47 19 11.6 | 25.87 | |
| 52 | 12 18 45.15 | 47 19 17.9 | 25.88 | |
| 53 | 12 18 49.90 | 47 22 00.2 | 25.91 | |
| 54 | 12 18 43.63 | 47 19 00.5 | 26.01 | |
| 55 | 12 19 05.16 | 47 20 43.5 | 26.03 | |
| 56 | 12 18 54.65 | 47 21 30.5 | 26.04 | |
| 57 | 12 18 54.80 | 47 20 59.1 | 26.14 | |
| 58 | 12 19 18.80 | 47 16 20.1 | 26.16 |
| ID | Sample | |||
|---|---|---|---|---|
| 1 | 15 06 15.87 | 55 46 18.9 | 26.35 | S |
| 2 | 15 06 21.38 | 55 46 36.5 | 26.39 | S |
| 3 | 15 06 17.88 | 55 46 09.3 | 26.54 | S |
| 4 | 15 06 17.94 | 55 47 04.9 | 26.56 | S |
| 5 | 15 06 40.23 | 55 44 07.4 | 26.56 | S |
| 6 | 15 06 27.54 | 55 46 46.4 | 26.60 | S |
| 7 | 15 06 20.40 | 55 46 24.8 | 26.64 | S |
| 8 | 15 06 20.19 | 55 46 16.8 | 26.65 | S |
| 9 | 15 06 22.68 | 55 45 48.2 | 26.68 | S |
| 10 | 15 06 23.10 | 55 46 50.2 | 26.70 | S |
| 11 | 15 06 26.07 | 55 45 21.6 | 26.89 | |
| 12 | 15 06 36.51 | 55 44 12.8 | 26.93 | |
| 13 | 15 06 16.73 | 55 44 37.9 | 26.99 | |
| 14 | 15 06 42.02 | 55 44 11.3 | 27.05 | |
| 15 | 15 06 22.97 | 55 45 17.4 | 27.07 | |
| 16 | 15 06 41.55 | 55 46 56.7 | 27.11 | |
| 17 | 15 06 32.42 | 55 44 15.7 | 26.42 | |
| 18 | 15 06 41.75 | 55 45 39.1 | 27.45 | |
| 19 | 15 06 17.43 | 55 44 50.6 | 27.60 | |
| 20 | 15 06 36.79 | 55 44 44.4 | 26.72 | |
| 21 | 15 06 35.31 | 55 43 39.0 | 26.74 | |
| 22 | 15 06 22.47 | 55 45 18.0 | 27.76 | |
| 23 | 15 06 40.72 | 55 45 34.2 | 27.88 | |
| 24 | 15 06 40.62 | 55 45 29.1 | 27.89 |
| Galaxy | Cepheid DistanceaaThe SMC Cepheid distance is taken from Udalski et al. (1999) assuming . All other Cepheid distances are from Freedman et al. (2001) without any correction for metallicity. | Observed | bbOxygen abundances are taken from Ferrarese et al. (2000a). | ccExpected metallicity shift in based on the models of Dopita, Jacoby, & Vassiliadis (1992). | PNLF Reference | |
|---|---|---|---|---|---|---|
| LMC | 0.075 | 8.50 | 0.06 | Jacoby, Walker, & Ciardullo (1990) | ||
| SMC | 0.037 | 8.03 | 0.48 | Jacoby, Walker, & Ciardullo (1990) | ||
| NGC 224 | 0.062 | 8.98 | Ciardullo et al. (1989) | |||
| NGC 300 | 0.013 | 8.35 | 0.15 | Soffner et al. (1996) | ||
| NGC 598 | 0.041 | 8.82 | Magrini et al. (2000) | |||
| NGC 2403 | 0.040 | 8.80 | This paper | |||
| NGC 3031 | 0.080 | 8.75 | Jacoby et al. (1989) | |||
| NGC 3351 | 0.028 | 9.24 | This paper | |||
| NGC 3368 | 0.025 | 9.20 | Feldmeier, Ciardullo, & Jacoby (1997) | |||
| NGC 3627 | 0.032 | 9.25 | This paper | |||
| NGC 4258 | 0.016 | 8.85 | This paper | |||
| NGC 5253 | 0.056 | 8.15 | 0.33 | Phillips et al. (1992) | ||
| NGC 5457 | 0.009 | 8.50 | 0.06 | Feldmeier, Ciardullo, & Jacoby (1997) |
| Galaxy | PNLF Reference | ||||
|---|---|---|---|---|---|
| NGC 224 | 0.062 | Ciardullo et al. (1989) | |||
| NGC 891 | 0.065 | Ciardullo, Jacoby, & Harris (1991) | |||
| NGC 1023 | 0.061 | Ciardullo, Jacoby, & Harris (1991) | |||
| NGC 1316 | 0.021 | McMillan, Ciardullo, & Jacoby (1993) | |||
| NGC 1399 | 0.012 | McMillan, Ciardullo, & Jacoby (1993) | |||
| NGC 1404 | 0.011 | McMillan, Ciardullo, & Jacoby (1993) | |||
| NGC 3031 | 0.080 | Jacoby et al. (1989) | |||
| NGC 3115 | 0.047 | This paper | |||
| NGC 3368 | 0.025 | Feldmeier, Ciardullo, & Jacoby (1997) | |||
| NGC 3377 | 0.034 | Ciardullo, Jacoby, & Ford (1989) | |||
| NGC 3379 | 0.024 | Ciardullo, Jacoby, & Ford (1989) | |||
| NGC 3384 | 0.027 | Ciardullo, Jacoby, & Ford (1989) | |||
| NGC 4258 | 0.016 | This paper | |||
| NGC 4278 | 0.030 | Jacoby, Ciardullo, & Harris (1996) | |||
| NGC 4374 | 0.042 | Jacoby, Ciardullo, & Ford (1990) | |||
| NGC 4382 | 0.030 | Jacoby, Ciardullo, & Ford (1990) | |||
| NGC 4406 | 0.029 | Jacoby, Ciardullo, & Ford (1990) | |||
| NGC 4472 | 0.022 | Jacoby, Ciardullo, & Ford (1990) | |||
| NGC 4486 | 0.023 | Ciardullo et al. (1998) | |||
| NGC 4494 | 0.021 | Jacoby, Ciardullo, & Harris (1996) | |||
| NGC 4565 | 0.015 | Jacoby, Ciardullo, & Harris (1996) | |||
| NGC 4594 | 0.051 | Ford et al. (1996) | |||
| NGC 4649 | 0.026 | Jacoby, Ciardullo, & Ford (1990) | |||
| NGC 4697 | 0.029 | Méndez et al. (2001) | |||
| NGC 5102 | 0.055 | McMillan, Ciardullo, & Jacoby (1994) | |||
| NGC 5128 | 0.115 | Hui et al. (1993) | |||
| NGC 5194/95 | 0.036 | Feldmeier, Ciardullo, & Jacoby (1997) | |||
| NGC 5866 | 0.013 | This paper |