An FeLoBAL Binary Quasar111Some of the data presented here were obtained at the W. M. Keck Observatory, which is operated as a scientific partnership among the California Institute of Technology, the University of California and the National Aeronautics and Space Administration. The Keck Observatory was made possible by the financial support of the W.M. Keck Foundation.
Abstract
In an ongoing infrared imaging survey of quasars at Keck Observatory, we have discovered that the quasar SDSS J233646.2-010732.6 comprises two point sources with a separation of 167. Resolved spectra show that one component is a standard quasar with a blue continuum and broad emission lines; the other is a broad absorption line (BAL) quasar, specifically, a BAL QSO with prominent absorption from Mg II and metastable Fe II, making it a member of the “FeLoBAL” class. The number of known FeLoBALs has recently grown dramatically from a single example to more than a dozen, including a gravitationally lensed example and the binary member presented here, suggesting that this formerly rare object may be fairly common. Additionally, the presence of this BAL quasar in a relatively small separation binary adds to the growing evidence that the BAL phenomenon is not due to viewing a normal quasar at a specific orientation, but rather that it is an evolutionary phase in the life of many, if not all, quasars, and is particularly associated with conditions found in interacting systems.
1 Introduction
The current tally of gravitationally lensed quasars now stands at nearly 70 (Kochanek et al. 2002). The various searches which have contributed to this total have naturally also discovered examples of the apparently rarer phenomenon of binary quasars, of which only systems have been documented (Mortlock, Webster, & Francis 1999; Kochanek et al. 2002). While the gravitationally lensed quasars have been intensively studied, binary quasars have not received nearly as much attention, even though binary quasars may provide invaluable insight into various aspects of the quasar phenomenon. Of particular importance are the cases where the pair members exhibit strikingly different characteristics, perhaps making it possible to deduce what aspects of the AGN environment are responsible for presently little-understood quasar behavior such as radio-loudness, broad or narrow absorption lines, or very red colors. In addition, physically close binaries also supply limits, statistically at least, on the timescales involved because once within galaxy radius (kpc), dynamical considerations limit the binary lifetimes (Mortlock et al. 1999).
In an ongoing infrared imaging survey of quasars at Keck Observatory, we have discovered that SDSS J233646.2-010732.6 (hereafter SDSS 2336-0107) is a double with a separation of 167. Resolved spectra show that component A is a standard quasar with a blue continuum and broad emission lines. Component B is a broad absorption line (BAL) quasar, specifically, a BAL QSO with prominent absorption from Mg II and metastable Fe II, making it a member of the “FeLoBAL” class (Becker et al. 1997; 2000). The number of known FeLoBALs has increased dramatically in the last five years (Becker et al. 2000; Menou et al. 2001; Hall et al. 2002), including a gravitationally lensed example (Lacy et al. 2002) and the binary discussed here, suggesting that this type of object, once thought to be rare, may in fact be fairly common and simply overlooked in most quasar surveys. The presence of this BAL quasar in a relatively small separation binary adds to the mounting evidence that the BAL phenomenon is not simply due to viewing a normal quasar at a specific orientation, but rather that BALs are an evolutionary phase in the life of many, if not all, quasars, and is associated with conditions found in interacting systems. We adopt , , and .
2 Observations
SDSS 2336-0107 was first identified by the Sloan Digital Sky Survey (SDSS; York et al. 2000) using an early version of the quasar target selection algorithm (Richards et al. 2002), as a quasar with z=1.285 and having modest broad absorption features (Schneider et al. 2002). It was also earmarked as an “extended” quasar in the SDSS images, meaning that it was slightly resolved. Quasars at are unresolved in SDSS images, so the extended nature made it a target in our imaging survey for lensed quasars at Keck Observatory.
2.1 Infrared Imaging
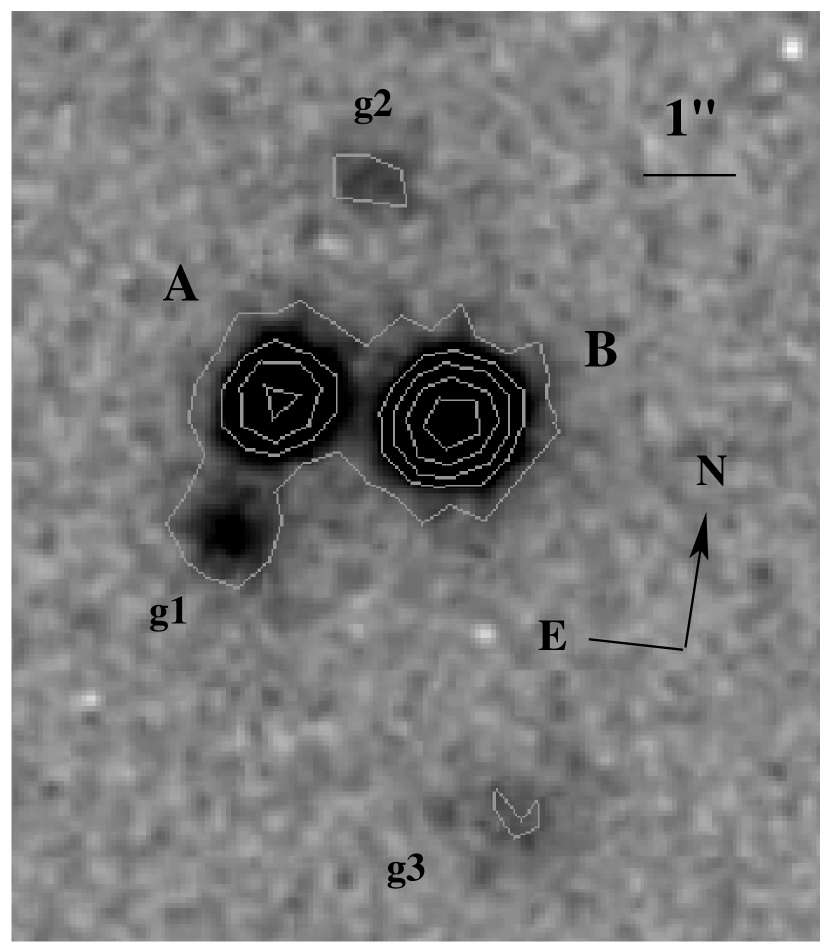
On 2001 October 30, we obtained deep imaging of SDSS 2336-0107, totaling 350s in the band using the Near Infrared Camera (NIRC, Matthews & Soifer 1994) on the Keck I 10m telescope in 06 seeing. The image scale is 015 per pixel. The reduced image reveals the double nature of SDSS 2336-0107 (Figure 1) and three galaxies (g1, g2, and g3) in the field. Photometry of the two components was measured with daophot/iraf222The Image Reduction and Analysis Facilities package is distributed by NOAO, which is operated by AURA, Inc., under contract to the National Science Foundation, using a bright standard star as a PSF model. The short exposure standard star PSF clearly differed from the PSF of the longer exposure, dithered images of the binary quasar, so we also used Component B as a PSF model, even though the wings of the PSF cannot be determined easily in this way. In both cases, the residuals after subtraction suggest that the shapes of two components are not quite identical and that there is extended diffuse light at around A, perhaps indicating that the data are just beginning to detect the host galaxies of one or both. The separation of the two components is determined to be 1673 in and 1681 in .
2.2 Optical Imaging
The SDSS images were obtained in relatively poor seeing, ranging from 25 in to 16 in . Despite the seeing, the images prove adequate for photometry of the two components using daophot/iraf, a nearby bright star serving as the PSF model and photometric zeropoint. In , the PSF fits yield relatively small photometric errors; the separations range from 15 to 17, averaging , consistent to a fraction of an SDSS pixel (0396) with the separation measured in the NIRC images, lending credibility to the extracted photometry. The redder Component B is not reliably detected in , but an upper limited is derived from the residuals after subtracting a single PSF at the location of component A. Table 1 lists the optical and IR photometry, corrected for Galactic reddening (Schlegel, Finkbeiner, & Davis 1998).
2.3 Echelle Spectroscopy
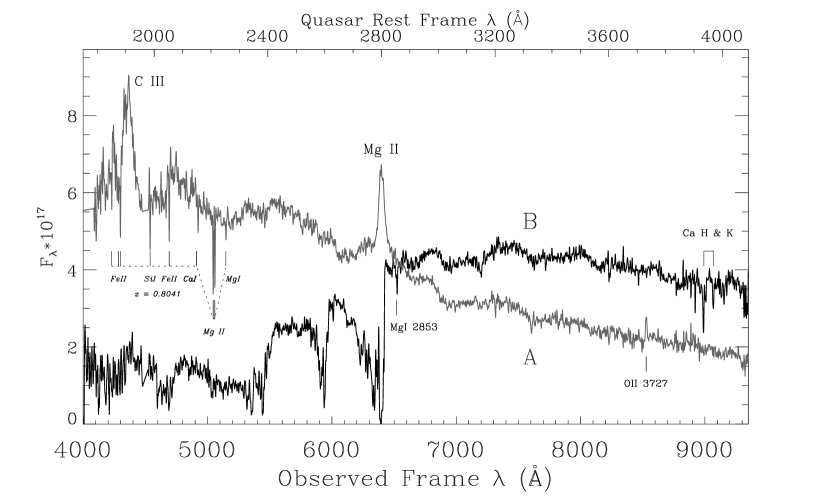
We obtained resolved spectra of the two components of SDSS 2336-0107 in 2002 January, using the Echelle Spectrograph and Imager (ESI; Epps & Miller 1998) on the Keck II telescope. The seeing was again 06. The ESI has a dispersion of 0.15Å to 0.3Å per pixel over a wavelength range of 4000 to 10500Å, and the 1″ slit used for these observations projects to 6.5 pixels. The 900 s exposure was obtained at an airmass of 1.33, with the slit aligned at the position angle of the components, 958. The spectra show that Component A is a standard quasar with broad emission lines while B is found to be a BAL quasar, totally lacking any emission features (Figure 2). The shape of the overall spectral energy distributions have been corrected to agree with the photometry from the SDSS images.
The redshift of component A is from Mg II, and from C III]; as C III] can be contaminated by Fe III, Si III], and Al III emission, we adopt the Mg II redshift. The redshift of component B is difficult to measure accurately because of the lack of emission features and the broad nature of the absorption. If we assume that the absorption feature at 6418.8Å, which is somewhat broad and flat-bottomed, is due to the red half the the Mg II doublet at 2803.5, the redshift is 1.2895. There is also a narrow absorption line at 6525.0Å which, ascribed to Mg I 2853.0, gives , consistent with and perhaps more accurate than the Mg II estimate. Adopting this as the redshift of component B yields an apparent velocity difference between A and B of only . Component B also has absorption features consistent with Ca H & K at a redshift of 1.2843 (Figure 2).
The ESI spectrum of component A reveals a Mg II Fe II intervening absorption system at , perhaps due to one of the faint galaxies which appear in the -band image (Figure 1). There is also absorption from what may be Si I 2515 and Ca I 2722. The brighter galaxy (g1) is 125 to the east of A while the fainter (g2) is 230 to the west, corresponding to physical impact parameters of 9.4 and 17.4 kpc, respectively.
Also weakly detected in the spectrum of component A is [O II] in emission at a wavelength corresponding to (Figure 2), within 400 of the emission features. This feature is in a region between bright sky lines and also appears on a shorter ESI exposure of SDSS 2336-0107 taken two nights previous to the data presented here, so its reality is beyond doubt. Though noisy, the [O II] feature does appear to be broadened by a few hundred , well in excess of the instrumental resolution.
3 Discussion
Combining the redshifts with the SDSS and NIRC photometry, the absolute magnitudes of the two components can be computed in the quasar restframe as and . While not exceptionally bright, both components are luminous enough to qualify as bona fide quasars. The possibility that SDSS 2336-0107 is gravitationally lensed is immediately ruled out by the strikingly different spectra (Figure 2) and the short time delay between the two paths. The analytic formula of Witt, Mao, & Keeton (2000) yields time delay estimates of a few months to a year for any reasonable lensing geometry. The nearly identical redshifts and tiny velocity difference, however, makes it a definite binary quasar. For our adopted cosmology, the apparent separation of 167 translates to a physical separation of kpc, making SDSS 2336-0107 the smallest separation binary ever found in ground-based imaging and the second smallest ever. The smallest is LBQS 0103-2753 (Junkkarinen et al. 2001), a 03 (2.3 kpc) separation binary found serendipitously during an ultraviolet spectroscopy survey of BAL systems using HST and STIS. In LBQS 0103-2753, the brighter component is a standard high ionization BAL (HiBAL) quasar.
3.1 Implications for the BAL phenomenon
The two binary quasars with the smallest physical separations both contain a BAL member. Although this could be simply small number statistics, it is natural to speculate that the BAL features are somehow induced by the small distances between the AGN. Mass transfer onto one of the black holes would naturally result in a tidally interacting pair of galaxies where the AGNs had reached relatively small separations of less than a galactic radius. This is further evidence supporting the view that BAL features are a short-lived evolutionary phase during the life of a quasar (Becker et al. 2000; Gregg et al. 2000), rather than the result of viewing an AGN along a particular line of sight. Additional support of this argument comes from Canalizo & Stockton (2001) who show that all four of the known low ionization BAL (LoBAL) quasars with are in systems which exhibit tidal tails or evidence of merging, suggesting a strong link between these phenomena and the presence of BAL spectral features. The orientation picture cannot so easily account for the occurrence of BAL features in the two smallest separation binary quasars or all four low redshift LoBAL examples, except as by chance.
If the merger/accretion origin of BALs is correct, the material directly responsible for the BAL spectral features is almost certainly within tens of parsecs of the AGN and not within reach of ground-based imaging resolution, yet mergers and tidal debris will occur over kiloparsec scales. It is then somewhat counter-intuitive that it is the standard quasar component (A) of SDSS J2336-0107 which is sandwiched by the galaxies g1 and g2 in the NIRC image (Figure 1) and which exhibits the narrow [O II] in its spectrum (Figure 2). The image hints at a light bridge between g1 and component A, perhaps a real physical connection. The weak [O II] feature of component A is certainly consistent with this picture, indicating some level of star formation, quite expected for an intensely interacting system. Some or all of the [O II] could come from the material in the region between g1 and A; the 1″ ESI slit would have entirely missed g1, though. The intervening Mg II system in the spectrum of A (Figure 2) could arise from g2 at an intervening location; direct spectroscopy of the galaxies in this field are required to sort out the physical relationships. The seeing and S/N are not good enough to explore the region directly between the two components more fully, but space-based imaging would reveal details of the expected tidal interactions which may be driving the BAL behavior. If the two quasars are in the nuclei of two large galaxies separated by only kpc, tidal effects should be strongly pronounced.
3.2 Implications for the FeLoBAL population
Figure 3 plots the photometry of the two components, through , highlighting the contrasting color difference. Component B, the BAL, is in fact brighter in the redder bands, by magnitude in and . For comparison, we plot photometry synthesized from the SDSS quasar composite (Vanden Berk, et al. 2001) after redshifting to z=1.2855. The synthetic magnitudes have been adjusted so that equals that of Component A. The excess flux in in the composite may be due to host starlight contribution in the low redshift quasar spectra which contribute to the composite in this wavelength region. The even larger excess in the BAL component is probably a combination of starlight and “back warming” from dust extinction. There is evidence that FeLoBALs are heavily reddened (Hall et al. 1997; Najita, Dey, & Brotherton 2000) and may be associated with young galaxies and star formation (Egami et al. 1996).
Perhaps the most intriguing finding is that Component B is an FeLoBAL, a quasar with low ioniziation broad absorption from Mg II plus broad and narrow absorption from metastable states of Fe II. In Figure 4, the spectrum of Component B is compared to two other FeLoBALs, J1556+3517 (Becker et al. 1997) and the original of the class, Q0059-2735 (Hazard et al. 1987). The spectrum of SDSS 2336-0107 B exhibits strong Fe II at and 2750Å. The broad Mg II absorption depresses the spectrum blueward to at least 2630Å, or -18,000 in the quasar restframe. While not quite as red as J1556+3517, SDSS 2336-0107 B has essentially no emission lines whatsoever.
There is now one FeLoBAL quasar (SDSS 2336-0107) known among the 15 binary QSO systems and one FeLoBAL (J1004+1229; Lacy et al. 2002) among the known gravitationally lensed quasars. These statistics argue strongly that FeLoBALs must be much more common than their presently cataloged population suggests. Lacy et al. (2002) discuss the details of red quasar luminosity functions and lensing probabilities, but not with regard to FeLoBALs in particular. With 1 FeLoBAL in lensed quasars and one among 40 quasars in binary systems, the simplest explanation is that from 1% to a few percent of quasars are FeLoBALs, or alternatively, that the FeLoBALs phase lasts for a similar percentage of the total quasar lifetime. The very red spectral energy distribution and weak or completely absent broad emission lines (Figure 1) makes these objects extremely difficult to find, especially at redshifts where the Mg II absorption edge moves into the band. An IR-selected sample of quasars is needed to better gauge the frequency of FeLoBAL numbers, but evidence is mounting (Becker et al. 1997; Lacy et al. 2002; Hall et al. 2002) that they are much more common than suspected even just a few years ago when the rather blue example of Q0059-2735 was the only one known (Hazard et al. 1987).
4 Conclusions
A deep imaging survey of BAL quasars and a control sample of non-BAL quasars, from the ground or space, is needed to document the frequency of each in systems that show tidal interactions, which would be a more comprehensive version of the work done by Canalizo & Stockton (2001). If BAL-ness is explained simply by viewing an ordinary quasar along a line of sight which skims the “dusty torus” (Weymann et al. 1991), then the two populations should appear with equal frequency in merging or interacting systems. If BAL features are produced by conditions created in mergers, and orientation plays less or no role, then they will be more common in chaotic systems with tidal tails and other signs of host galaxy interactions. Dynamical modeling of the tidal effects may help constrain the timescales of various quasar phases.
FeLoBALs may be a common feature of the AGN landscape, especially if there are Seyfert-type luminosity class analogs to the brighter objects now being unearthed. If FeLoBALs are indeed common, then infrared sky surveys which reach deeper than 2MASS, such as those being undertaken with SIRTF, will turn up numerous examples along with other extreme BAL phenomena in quasar and galaxy luminosity objects. The FeLoBAL-like Hawaii 167 (Cowie et al. 1994) was discovered in just such a survey. Such surveys are needed to provide more accurate estimates of the extremely red quasar population, especially at redshifts above 2.5 where such objects are essentially invisible in the optical.
References
- (1)
- (2) Becker, R. H., Gregg, M. D., Hook, I. M., McMahon, R. G., White, R. L., & Helfand, D. J. 1997, ApJL, 479, L93
- (3)
- (4) Becker, R. H., White, R. L., Gregg, M. D., Brotherton, M. S., Laurent-Muehleisen, S. A., & Arav, N. 2000, ApJ, 538, 72
- (5)
- (6) Canalizo, G. & Stockton, A. 2001, ApJ, 555, 719
- (7)
- (8) Cowie, L.L., Songaila, A., Hu, E.M., Egami, E., Huang, J.-S., Pickles, A.J, Ridgway, S.E., Wainscoat, R.J., & Weymann, R.J. 1994, ApJ, 432, L83
- (9)
- (10) Egami, E., Iwamuro, F., Maihara, T., Oya, S., & Cowie, L. L. 1996, AJ, 112, 73
- (11)
- (12) Epps, H. W. & Miller, J. S. 1998, Proc. SPIE 3355, Optical Astronomical Instrumentation, edited by Sandro D’Odorico, p. 48
- (13)
- (14) Gregg, M. D., Becker, R. H., Brotherton, M. S., Laurent-Muehleisen, S. A., Lacy, M., & White, R. L. 2000, ApJ, 544, 142
- (15)
- (16) Hall, P. B., Martini, P., DePoy, D. L., & Gatley, I. 1997, ApJL, 484, L17
- (17)
- (18) Hall, P. B., et al. 2002, ApJS, 141, 267
- (19)
- (20) Hazard, C., McMahon, R.G., Webb, J.K., & Morton, D.C. 1987, ApJ, 323, 263
- (21)
- (22) Junkkarinen, V., Shields, G. A., Beaver, E. A., Burbidge, E. M., Cohen, R. D., Hamann, F., & Lyons, R. W. 2001, ApJ, 549 L155
- (23)
- (24) Kochanek, C. S., et al. 2002, http://cfa-www.harvard.edu/castles
- (25)
- (26) Lacy, M., Gregg, M. D., Becker, R. H., White, R. L., Glikman, E., Helfand, D., & Winn, J. N. 2002, AJ, in press, astro-ph/0203065
- (27)
- (28) Matthews, K., & Soifer, B. T. 1994, in Infrared Astronomy with Arrays: the Next Generation, ed. I. McLean (Dordrecht: Kluwer), 239
- (29)
- (30) Menou, K., et al. 2001, ApJ, 561, 645
- (31)
- (32) Mortlock, D. J., Webster, R. L., & Francis, P. J. 1999, MNRAS, 309, 836
- (33)
- (34) Najita, J., Dey, A., Brotherton, M. 2000, AJ, 120, 2859
- (35)
- (36) Richards, G. T. et al. 2002, AJ, 123, 2945
- (37)
- (38) Schlegel, D.J, Finkbeiner, D.P., & Davis, M. 1998, ApJ, 500, 525
- (39)
- (40) Schneider, D. P. et al. 2002, AJ, 123, 567
- (41)
- (42) Vanden Berk, D. E., et al. 2001, AJ, 122, 549
- (43)
- (44) Weymann, R. J., Morris, S. L., Foltz, C. B., & Hewett, P. C. 1991, ApJ, 373, 23
- (45)
- (46) Witt, H. J., Mao, S., & Keeton, C. R. 2000, ApJ, 544, 98
- (47)
- (48) York, D. G. 2000, AJ, 120, 1579
| Name | (J2000) | Gal. | aaJ and K photometry have been corrected to the AB magnitude system using zeropoint offsets of 0.908 and 1.842 magnitudes, determined from a model of Vega. | aaJ and K photometry have been corrected to the AB magnitude system using zeropoint offsets of 0.908 and 1.842 magnitudes, determined from a model of Vega. | bbComputed in quasar rest frame | |||||||
|---|---|---|---|---|---|---|---|---|---|---|---|---|
| Component A | 0.114 | 1.2853 | 19.75 | 19.65 | 19.35 | 19.26 | 19.12 | 18.19 | 17.22 | -23.77 | ||
| Component B | 0.114 | 1.2871 | 21.37 | 19.71 | 18.94 | 18.68 | 17.24 | 16.23 | -24.72 |