Properties of Low Surface Brightness Galaxies and Normal Spirals in the Near-IR
Abstract
We present results for and near-IR imaging data on a large sample of 88 galaxies drawn from the catalogue of Impey et al. (1996). The galaxies span a wide range in optical and IR surface brightness and morphology (although they were drawn from a catalog constructed to identify low surface brightness galaxies, hereafter LSBGs). They were also selected to include very low and high HI mass galaxies in order to ensure that they span a wide range of evolutionary states.
The near-IR data unveils many features of LSBGs not seen before in the optical. First, a high fraction of the observed LSBGs are very luminous in the near-IR, indicating that they have a well developed old stellar population, and that older LSBGs are more frequent in the universe than data from optical bands suggested. Second, the near-IR morphologies are often quite different than seen in the optical. Many diffuse LSBGs that are apparently bulgeless when observed in blue bands, instead exhibit nuclei in and bands. Third, we find significant trends between the near-IR morphologies of the galaxies and their ratio of HI mass to near-IR luminosity. Fourth, we find no trend in disk surface brightness with absolute magnitude, but significant correlations when the bulge surface brightness is used. Finally, we find that the formation of a bulge requires a galaxy to have a total baryonic mass above .
A wide variety of other correlations are explored for the sample. We consider correlations among morphologies, surface brightnesses, near-IR colors, absolute magnitudes, and HI masses. In addition, using previous results by Bell and de Jong (2001), we convert the galaxies’ near-IR luminosities to stellar masses, using color-dependent stellar mass-to-light ratios. This allows us to consider correlations among more fundamental physical quantities such as the HI mass, the stellar mass, the total baryonic mass, the gas mass fraction, the mass surface density, and the metallicity (via the highly metal sensitive color index ).
We find that the strongest of our correlations are with the ratio of HI mass to total baryonic mass, MHI/Mbaryonic, which tracks the evolutionary state of the galaxies as they convert gas into stars, and which ranges from 0.05 up to nearly 1 for the galaxies in our sample. We find strong systematic trends in how the metallicity sensitive color becomes redder with decreasing MHI/Mbaryonic, as would be expected for “closed box” models of chemical enrichment. However, the increased scatter with increasing gas mass fraction and decreasing galaxy mass suggests that gas infall is increasingly significant in the gas rich lower mass systems. We argue that the overall range in color argues for at least a factor of 20 change in the mean stellar metallicity across the mass range spanned by our sample. We also see strong trends between MHI/Mbaryonic and central surface density, suggesting that increased star formation efficiency with increasing gas surface density strongly drives the conversion of gas into stars.
1 Introduction
Low surface brightness galaxies (LSBGs) have been a subject of increasing interest in the last two decades. Although an initial study by Freeman (1970) suggested that the central surface brightnesses of disk galaxies in the Hubble sequence (Sa-Sb-Sc) fell within a rather narrow range, Disney (1976) pointed out that the lack of low surface brightness galaxies may in fact be a selection effect due to the difficulty in discovering galaxies of very low surface brightness, as had previously been recognized by Zwicky (1957). Indeed, many surveys have since turned up large numbers of LSB galaxies. In practice, “low surface brightness” has come to mean galaxies whose central surface brightness is fainter than 22.0 mag arcsec-2 in the band-pass (i.e. more than outside of the narrow range defined by Freeman (1970) of -mag/arcsec2). However, while many galaxies have been found below the “Freeman value” of surface brightness, disk galaxies with surface brightnesses that are significantly higher than those of normal spirals do not appear to exist. This is shown most clearly in Courteau (1996), who find that there is a rather well-defined upper cut-off at a central surface brightness in of mag arcsec-2.
It was originally thought that all galaxies with a low surface brightness were early or late-type dwarfs (van den Bergh, 1959). However, radial velocity observations by Fisher and Tully (1975) showed that some galaxies with low surface brightness are actually quite large and luminous (McGaugh, 1992; Bothun, Impey and McGaugh, 1997), for example LSBGs like Malin 1 type. Indeed, most surveys have revealed LSBGs with disk scale lengths comparable to the Milky Way (although these angular diameter limited surveys are strongly biased toward finding the physically largest galaxies).
Based upon surveys to date, LSBGs do seem to have different properties than those of brighter galaxies (possibly indicating different evolutionary histories). The observed trends suggest that LSBGs are in large part a continuous extension of the population of normal disk galaxies, reaching to higher angular momenta and lower masses (Dalcanton, Spergel and Summers, 1997). Previous studies (Longmore et al., 1982) showed that LSBGs are much more gas rich (in terms of ) and bluer than “normal” late type galaxies (McGaugh, 1992; de Blok, van der Hulst and Bothun, 1995; Sprayberry et al., 1995). When combined with their observed low gaseous metallicity (McGaugh, 1994; de Blok & McGaugh, 1997), the evidence suggest that LSBGs have had a historically low star formation rate and are relatively unevolved systems compared to the bulk of normal spirals. HI observations (van der Hulst et al., 1993; de Blok, McGaugh and van der Hulst, 1996) show that LSBGs have extended disks with low gas surface densities and high M/L ratios, further confirming the unevolved nature of LSBGs. Even external influences seem to have had little effect in speeding up the evolution of LSBGs (McGaugh and de Blok, 1997).
Despite the tremendous progress in this field, there are still significant uncertainties in many of the above results. First, while the data suggests a young stellar age for LSBGs overall, the spread in the integrated optical colors of LSBGs is large, suggesting that they may actually have traveled along diverse evolutionary paths. In particular, because of the low surface brightness of the underlying population, only a small fraction of the total number of stars is needed to make the colors significantly blue, and thus a small change in the star formation rate can drastically change the apparent mean age of the stellar population as inferred from optical observations. Second, while emission line measurements have revealed the metallicity of the current gas phase, they have not measured the metallicity of the underlying stellar population. Given the large gas reservoirs observed in LSBGs and the possibility of substantial late time gas infall, it is not clear that the current gas phase metallicity is closely related to the actual metallicity of the stars. Third, the total stellar mass in these galaxies (and their contribution to dynamics) is rather uncertain, given the large uncertainties in the stellar mass-to-light ratio at optical wavelengths. Finally, recent modeling of LSBGs predict that from the assumption that blue LSBGs are currently undergoing a period of enhanced star formation, there should exist a population of red, non-bursting, quiescent LSBGs (Gerritsen and de Blok, 1998; Beijersbergen, de Blok and van der Hulst, 1999; Bell et al., 2000; van den Hoek et al., 2000). These galaxies should then also be metal-poor and gas-rich, and share many of the properties of the LSBGs observed in the optical.
In all of these areas, we can greatly improve the observational constraints by undertaking a systematic study of the properties of LSBGs and normal spirals in the near-IR. Combined near-IR and (eventually) optical observations are a perfect probe to help to clarify the true stellar masses of LSBGs, to disentangle the roles played by the age and metallicity, and to understand their place in the continuum with normal high surface brightness (HSB) spirals.
We expect that contrary to initial impressions, LSBGs should be readily detectable in the near-IR. Although much of the data suggests that the mean stellar population of LSBGs are probably young, we know from the very red integrated colors of some LSBGs (such as the giant Malin-type objects) that many LSBGs contain a significant old population of stars, and were therefore not formed recently. This old population should dominate the near-IR (which is a good tracer of red giant and lower mass stars) and thus should be detectable with NIR observations. We also should be able to easily identify LSBGs with bulges, as these are among the reddest members of the LSBG population McGaugh (1992). There are also indications that the most massive LSBGs, such as the super-giant galaxies Malin 1 and Malin 2, are redder than the majority of LSBGs, with luminosities that are comparable to those of normal spirals. Thus, near-IR observations should be particularly sensitive to the most massive end of the LSBG population.
While valuable, previous studies of the IR properties of galaxies in the low surface brightness regime have been limited due to the difficulty of the observations. Knezek and Wroten (1994) observed a preliminary sample of LSBGs in , and , but the sample was very small and biased toward massive galaxies. Bergvall et al. (1999) have observed 14 blue LSBGs in , and and combined with optical photometry, arriving to the result that many properties of LSBGs observed in the optical are reproduced in the near-IR. In particular, they observe the same morphologies in and , measuring weak optical/near-IR color gradients, a fact which they interpret as a low dust content.
Near-IR observations have also been used to probe the stellar population differences between LSBGs and normal spirals. Bell et al. (2000) undertook a combined optical and IR study of 26 LSBGs, including 5 from his earlier thesis work in Bell et al. (1999), and examples of both normal blue LSBGs and the rarer class of red LSBGs. They compare LSBG average ages and metallicities with their physical parameters and find that blue LSBGs are well described by models with low, roughly constant star formation rates, whereas red LSBGs are better described by a “faded disc” scenario. Among the larger population, strong correlations are seen between an LSBG’s star formation history and its -band surface brightness, -band absolute magnitude and gas fraction. These correlations are consistent with a scenario in which the star formation history of an LSBG primarily correlates with its surface density and its metallicity correlates with both its mass and its surface density. Another larger study involving IR data of spiral galaxies was made by de Jong (1996), but included only a very small number of true LSBGs.
The lack of much previous work, and the availability of relatively large IR array detectors, both open the possibility to systematically observe a large sample of LSBGs and normal spirals in the near-IR, to derive fundamental parameters related to the origin of these galaxies and to their relation to normal galaxies. Based upon the large expected rewards and the limited existing data, a systematic near-IR study of LSBGs is needed in order to complement existing optical data. We undertake such a study in this paper, which is organized as follows. In §2 we present the sample used in this work. §3 briefly describes our observations, data reductions, photometric calibrations, galaxy photometry, and surface photometry. In §4 we analyze and discuss the most important results, including galaxy photometry, central surface brightnesses and scale lengths, the relationship between HI-mass and near-IR luminosities, and the relationship between stellar mass-luminosity ratios and baryonic mass. Finally, we conclude in §5.
2 Sample
All galaxies were initially selected from the catalogue of large angular size low surface brightness galaxies compiled by Impey et al. (1996) from the APM plates, consisting of 516 LSBGs with effective radius larger than arcsec. Some constraints were applied to optimize the galaxies’ observability and their intrinsic stellar and gas content. First, a surface brightness cut was applied to ensure detectability at the 40-inch Swope telescope and at the 100-inch du Pont telescope, both located at Las Campanas Observatory (LCO). The corresponding central surface brightness cut-off was set to mag arcsec-2 for the galaxies observed with the 40-inch telescope, and to mag arcsec-2 for the galaxies observed with the 100-inch telescope. These limits are set considering (1) the corresponding limiting magnitudes for the 40-inch and the 100-inch telescopes both equipped with a NICMOS3 HgCdTe array: 19.0 mag and 20.5 mag, respectively, and (2) the observed average color for LSBGs (Tully and Verheijen, 1997). We applied additional selection criteria in declination, , in order to observe galaxies from LCO. We then randomly sampled from the resulting catalog to generate a sample which would be observable during the one year of allotted telescope time. Finally, we restricted the sample to two ranges in HI mass, selecting galaxies with either log (sample A) or log (sample B). This last selection criterion allows us to capture LSBGs in the maximum range of evolutionary states (i.e. high and low gas-to-star ratios) and total masses.
There are 112 galaxies from the Impey et al. (1996) catalogue satisfying the above constraints. Of these, 65 galaxies were observed with the 40-inch telescope and 47 galaxies with the 100-inch telescope.
In order to have an optimal wavelength baseline, we observed all galaxies through both the and near-infrared filters (the latter defined by Persson et al. (1998)). Due to the critical importance of accurate surface brightness measurements, and given the low surface brightness of these galaxies, we chose not to use the band. The strong and variable OH emission which dominates the sky background at is not easy to remove, and could significantly affect the apparent surface brightness of the galaxies. In addition, prominent fringing appears in the band, putting additional hurdles to deriving the correct surface brightness flux. The band, on the other hand, is stable during time scales of minutes, and the bands is stable enough typically for time scales shorter than 5 minutes, when the outside temperature is below 15∘C (Galaz, 2000). Unlike many earlier near-IR studies of nearby galaxies, we have sufficient sky background in our images to do a reasonable job of sky subtraction. Most galaxies are much smaller than the arcmin FOV of both telescopes, with just a few having extents larger than 1.5 arcmin in the band.
3 Observations and Reductions
All galaxies were observed by GG and EZ during photometric nights at LCO, using the 40-inch Swope telescope and the 100-inch du Pont telescope. Seven runs of 3 to 7 nights were allocated for this project. Observations started on February 23rd 1999 and finished on October 23rd 1999. A NICMOS3 HgCdTe array was used in both telescopes, but with different pixel scales: 0.60 arcsec/pix at the 40-inch, and 0.348 arcsec/pix at the 100-inch. The corresponding FOV were and . Observation procedures were the same as used in Galaz (2000), and consist of a sequence of short dithered exposures for all the scientific targets, including the standard stars. Due to the low surface brightness which characterizes these galaxies, exposure times were calculated based on the known blue surface brightness, extrapolated to the and band, and corrected for the additional contribution of the thermal noise and sky emission. Typical total exposure times were between 20 min and 45 min in and between 40 min and 75 min in .
Considering the low surface brightness of galaxies, special care was taken with flat-fielding, in order to avoid undesirable artificial spatial fluctuations. A large series of dome-flats were taken for each run, as well as sky-flats every sunset. Additionally, the raw images of each night were used to construct super-flats, by combining dithered images, using a median sky value obtained after a sigma clipping algorithm to discard cosmic rays, bad pixels, and any residual contribution from the galaxies themselves. Usually, no fewer than 80 images per filter were used to construct nightly super-flats, and only images where the galaxies were small compared the chip size were included in the image stack. Afterward, dome-flats, sky-flats and super-flats were compared. The largest differences between sky and dome-flats were .
For image reduction, we used a modified version of DIMSUM111DIMSUM is the Deep Infrared Mosaicing Software package developed by Peter Eisenhardt, Mark Dickinson, Adam Stanford, and John Ward.. The reduction procedure is completely analogous to that described in Galaz (2000), to which the reader can refer for details. Out of the 112 original selected LSBGs, we successfully observed 88; 39 from sample A (low HI mass) and 49 from sample B (high HI mass).
3.1 Calibrations
In order to derive color information we calibrated our magnitudes system using the standard star system defined by Persson et al. (1998). For the standard star photometry IRAF’s222IRAF is distributed by the National Optical Astronomy Observatories, which are operated by the Association of Universities for Research in Astronomy, Inc., under cooperative agreement with the National Science Foundation. “DAOPHOT” software was used. We adopted a 10 arcsec aperture radius for all the standard stars, which corresponds to the same aperture used by Persson et al. (1998). Typical seeing was 1.0 arcsec. No less than 6 standards were measured each night, which allow us to derive calibrated and magnitudes. The transformation equations were
| (1) | |||||
| (2) |
where capitals denote standard magnitudes, small characters denote instrumental magnitudes, and are the zero points, and are the color terms, and and are the extinction coefficients in and in respectively. is the mean airmass of the observation.
We have computed the transformation parameters of equations (1) and (2) using “photcal”, included in IRAF. When measuring the above coefficients, color terms and zero points were initially computed independently for each night, verifying that they changed by only a small amount (less than 5%) from night to night; because these terms depend only upon the telescope/mirror-instrument-filter combination, they should be constant over each run. We then adopted a single color term and zero point for the entire run (based upon the night-to-night average), and re-computed the extinction coefficients for each night separately. The values obtained were very close to the expected values and in (Persson et al., 1998). The resulting average values typical of all our runs are shown in Table 1. The typical color term is relatively small, and given the observed values of (between 0.10 and 0.80), the contribution of this term is in , and therefore may be marginally important when computing the spatial distribution of colors through a given galaxy.
3.2 Galaxy Photometry
Given the heterogeneous luminosity profiles of the LSBGs, several different techniques were initially explored to optimize measurement of the apparent magnitudes: (1) circular apparent magnitudes, using DAOPHOT and the growth curve method, (2) total magnitudes within elliptical apertures, computed using SExtractor (Bertin and Arnouts, 1996). SExtractor also computes isophotal areas which allow one to compute mean surface brightness within a specified isophote level. A comparison between these two techniques allows us to conclude that a more robust measurement of the flux is obtained with SExtractor magnitudes, given the elongated shape of many of the LSBGs in the sample (see Figures Properties of Low Surface Brightness Galaxies and Normal Spirals in the Near-IR and Properties of Low Surface Brightness Galaxies and Normal Spirals in the Near-IR). In LSBGs with small ellipticities, DAOPHOT and SExtractor magnitudes differ by . In what follows, we use only magnitudes computed with SExtractor on elliptical apertures. Magnitudes were determined within an isophotal level set by the quality of the data, at a 3 level above the sky; the resulting sizes of the elliptical apertures are listed in Table 2. The major uncertainty arises from the sky level, with a mode of % in and % in . We have attempted to compare our derived magnitudes with those from the 2MASS survey, but found no overlap in the galaxies studied.
Table 2 shows the and magnitude and color, for the observed LSBGs. The heliocentric radial velocity from the 21-cm line, the size of the elliptical aperture used for photometry, and the HI mass content from Impey et al. (1996) are also shown. The absolute magnitudes in Table 2 were computed as
| (3) |
where is the apparent magnitude, is the Hubble constant expressed in km sec-1 Mpc-1 (we use km sec-1 Mpc-1 in this paper), and is the Virgocentric peculiar velocity in km/s. Throughout this paper we use km/s, as quoted by Kraan-Korteweg (1986); Giovanelli et al. (1998). This corrective term is important for galaxies with km/s. It is worth noting that this correction does not depend on passband, and therefore does not affect colors. Equation 3 is a good approximation up to a recessional velocity km sec-1, where cosmological corrections become important and the parameter must be taken into account (from Table 2 we see that our largest velocity is km sec-1). In equation 3 we have neglected -corrections. At the LSBGs redshifts -corrections are smaller than our photometric errors, and therefore are negligible. Note also that heliocentric radial velocity is measured from the HI emission (Table 2), slightly different from the optical heliocentric radial velocity. However, differences are smaller than 100 km/sec, and therefore changes in absolute magnitudes are no larger than 0.05 mag.
As can be seen from Table 2, LSBGs do not necessarily have faint absolute magnitudes in the near-IR. Instead, some of them appear to be as bright in the near-IR as normal high surface brightness galaxies. This immediately suggests that they do have a significant population of old stars.
3.3 Measuring Central Surface Brightnesses and Scale Lengths
Measurements of surface brightness and scale lengths give critical information on the light density and physical size of galaxies. We now use surface brightness fitting to measure the central surface brightness (as an indicator of the central light concentration) and scale length of both the disk and bulge components of the galaxies in our sample. The reader must recall that the surface brightness difference we measure for the same extended source located at different redshifts is given by
| (4) |
where is expressed in mag arcsec-2. In our case, our smallest radial velocity is 850 km sec-1 (), and our farthest galaxy is located at km sec-1 (). This implies that the surface brightness difference for an object with a given surface brightness at , but measured at is, at most, mag arcsec-2. However, at level around the average redshift, we have km sec-1 and km sec-1, which yields mag arcsec-2, which is inside the magnitude error bars. Therefore our surface magnitude estimates are not strongly modified by the range of distance included in the sample.
We adopt the same approach as given by Beijersbergen, de Blok and van der Hulst (1999), and fit our data to the following parametric profile
| (5) |
or in terms of magnitudes per square arc-second
| (6) |
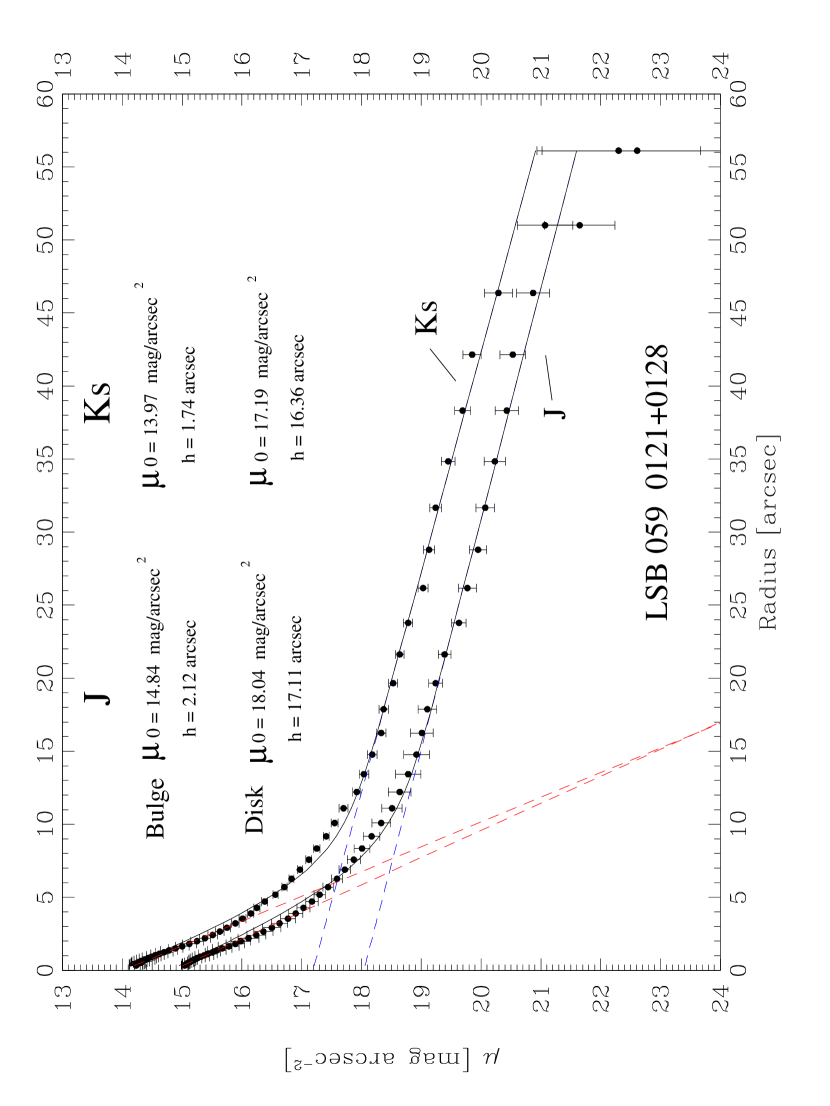
In equations 5 and 6 and are the central surface brightness, the latter measured in mag arcsec-2. The parameter is the scale length, measured in arcsec and transformed to physical units (kpc). Similar to Beijersbergen, de Blok and van der Hulst (1999), we initially fit bulges using de Vaucouleurs profiles (de Vaucouleurs, 1948). However, the profile was not a good match to the bulge light profile, and poor fitting results were obtained. Following Beijersbergen, de Blok and van der Hulst (1999), we then switched to fitting the bulge with an exponential light profile as well, yielding much better fits. An example bulge and disk fit is presented in Figure Properties of Low Surface Brightness Galaxies and Normal Spirals in the Near-IR. The double exponential profile provides an adequate fit to the data over a large range in radius, though slight deviations suggest that an intermediate Sérsic profile for the bulge might provide a slightly improved fit. We find that most of the galaxies require a bulge component in the near-IR (i.e. they show substantial curvature in the inner parts of a vs plot), but some do not and represent completely disk dominated galaxies.
4 Results and Discussion
4.1 Morphologies and Surface Brightnesses
A mosaic with reduced and combined images is shown in Figures Properties of Low Surface Brightness Galaxies and Normal Spirals in the Near-IR (sample A, low HI mass LSBGs) and Properties of Low Surface Brightness Galaxies and Normal Spirals in the Near-IR (sample B, high HI mass LSBGs). Typical image sizes are arcmin. Both Figures Properties of Low Surface Brightness Galaxies and Normal Spirals in the Near-IR and Properties of Low Surface Brightness Galaxies and Normal Spirals in the Near-IR and our surface brightness decompositions reveal a number of significant results for the morphologies and surface brightnesses of our sample.
First, many of the LSBGs classified as late types based upon the optical band image instead show a dramatic bulge in the near-IR (confirming the presence of prominent near-IR bulges noted by Beijersbergen, de Blok and van der Hulst (1999)). This result differs from that obtained by Bergvall et al. (1999) and Bell et al. (2000), who found similar morphologies in the and bands, but for a much smaller sample of galaxies. Examples of galaxies with different optical and near-IR morphologies (such as in the presence of a bulge in the near-IR) are the cases of LSBG #100 and LSBG #336 (for example, their images in Figure Properties of Low Surface Brightness Galaxies and Normal Spirals in the Near-IR). The fact that some LSBGs have high surface brightness bulges ( mag arcsec-2) has been commented by Beijersbergen, de Blok and van der Hulst (1999), who noted that many LSBGs could be regarded as high surface brightness bulges embedded in low surface brightness disks. Our results support such a hypothesis. In other words, while some galaxies have been classified as LSBGs on the basis of their disk properties, they are not low surface brightness overall. This difference is particularly striking in the near-IR, where the surface brightness more closely reflects the stellar surface density. Moreover, as discussed by Impey et al. (1996), many of the galaxies in the catalog from which our sample are drawn are not true LSBGs at all, and are instead indistinguishable from normal spirals in the optical. We find a similar result for our near-IR data.
Second, in Figure Properties of Low Surface Brightness Galaxies and Normal Spirals in the Near-IR we plot the infrared luminosity of the galaxies vs the central surface brightness of the disk component. The figure shows that there is no correlation between these quantities and that almost all of the absolute magnitude vs surface brightness parameter space is covered. The upper left part of the distribution (large, luminous but LSB galaxies) is as populated as the the lower right part of the distribution (small, quite compact galaxies). In our sample there is no bias against large and faint, nor small but luminous galaxies. We also observe in Figure Properties of Low Surface Brightness Galaxies and Normal Spirals in the Near-IR a sharp cutoff towards bright surface brightnesses (at mag arcsec-2). This cutoff represents a real physical cutoff (i.e. nature does not make disks with higher surface brightnesses), rather than a selection effect propagating from an optical surface brightness cutoff in the band. If it were the latter, then we would not expect the surface brightness of the cutoff to be constant with the near-IR absolute magnitude, given the strong dependence of the optical to near-IR color with galaxy luminosity. This physical cutoff further supports our belief that our sample does contain examples of galaxies with normal disk surface brightnesses, in addition to examples with disk surface brightnesses over 3.5 magnitudes fainter, thus giving us a true continuum of galaxies from normal disks to extremely low surface brightness systems.
Third, we have also included in Figure Properties of Low Surface Brightness Galaxies and Normal Spirals in the Near-IR a plot of the dependence of the bulge central surface brightness on the near-IR absolute magnitude. Unlike for the disks, we do see a correlation when overall surface brightness is considered (with a Spearman test suggesting that less than a 10% chance that they are uncorrelated for the low HI mass subsample). In addition, while Figure Properties of Low Surface Brightness Galaxies and Normal Spirals in the Near-IR shows a cutoff at bright surface brightnesses for the disk component, the bulges in these same galaxies extend to much higher surface brightnesses (with a possible, but less sharp cutoff at mag arcsec-2). For a comparison with the optical see Figure 4a from O’Neil, Bothun and Schombert (2000).
Fourth, we compare the sizes (in kpc) and surface brightnesses of the bulge (left) and disk (right) components in Figure Properties of Low Surface Brightness Galaxies and Normal Spirals in the Near-IR. It is apparent that LSBGs of the high HI mass subsample B (open circles) have brighter bulge surface brightnesses but similar bulge sizes, compared with LSBGs of the low HI mass subsample A (filled circles). A different trend, however, is observed for disks (right panel). In this case, galaxies of sample A have systematically smaller disk scale lengths with respect to those of sample B, but with little change in typical surface brightness. Therefore, galaxies of sample B have large disks and very high surface brightness bulges. Those galaxies with lower HI masses have small disks, and bulges that are structurally similar to those of the high HI mass sample, but that have very low surface brightness. The same behavior can be seen in the band (however we have better signal-to-noise in ).
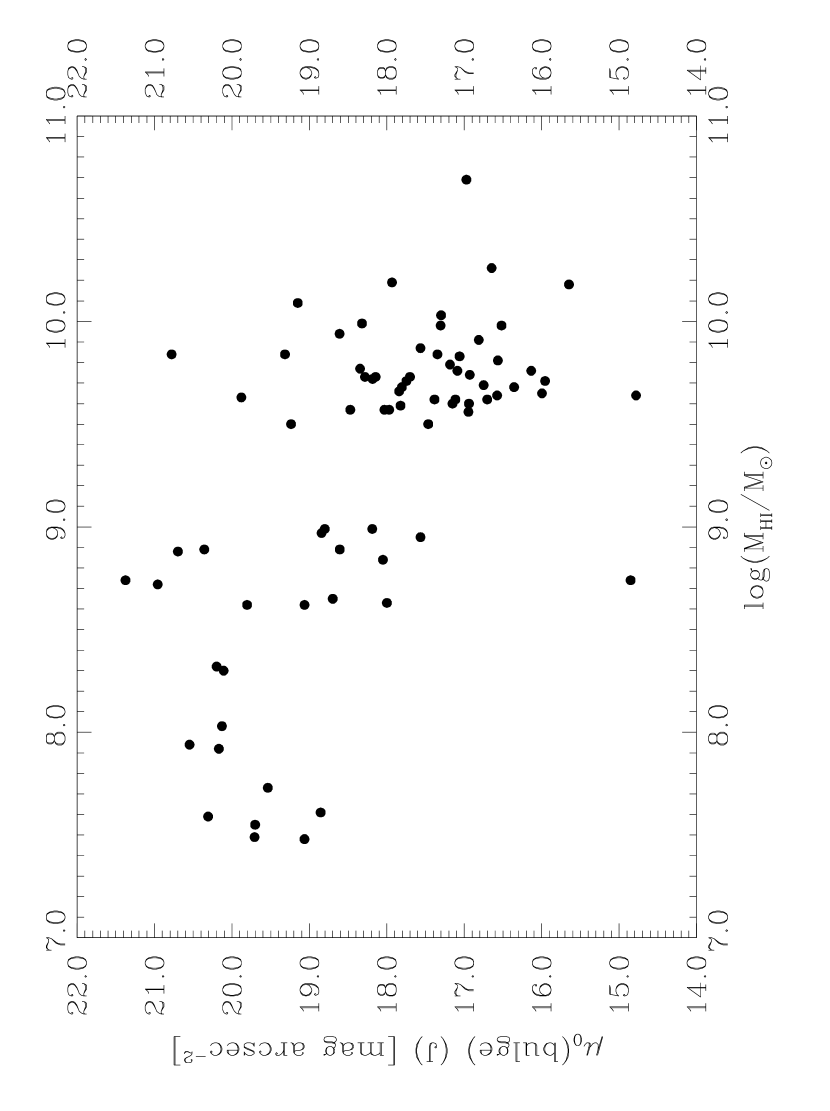
Rather than just comparing our two samples against each other, we can also compare morphology with HI content directly, by examining the bulge and disk structural parameters derived above as a function of HI mass. In Figure Properties of Low Surface Brightness Galaxies and Normal Spirals in the Near-IR the relationship is shown for the bulge and for the disk central surface brightness, in the left and the right hand panels, respectively. It is clear that the galaxies with low HI masses are almost entirely lacking in high surface brightness bulges, leading to a much smaller dispersion among the bulge central surface brightnesses. In contrast to the trends in bulge central surface brightness, there are no strong trends seen in the disk surface brightnesses. Instead, there is a very large dispersion among the disk properties, independently of the gas mass of the galaxies.
Note that in all the above analyses using the near-IR bands, we are sampling nearly the same stellar populations both in the bulge and in the disk, namely red giants and old stellar populations. Thus, the relative sizes and surface brightnesses reflect true differences in the distribution of stellar density. Note also that these measurements of the current stellar content are not a priori related to the remaining HI content after star formation. However, the strong trends seen in Figure Properties of Low Surface Brightness Galaxies and Normal Spirals in the Near-IR and Figure Properties of Low Surface Brightness Galaxies and Normal Spirals in the Near-IR strongly suggest that the stellar surface density of a galaxy is indeed tightly coupled to the amount of neutral gas the galaxy currently has, though probably indirectly through the total galaxy mass, as we now demonstrate below.
4.2 Comparison between HI content and near-IR properties
In the above analyses we have begun to consider how some properties vary as a function of the total HI mass. However, it is possible (if not likely) that the HI mass is not the sole controlling quantity driving these trends. It is quite possible that the HI mass (MHI) correlates closely with the overall galaxy mass – i.e. that “bigger” galaxies have more of everything.
In order to begin examining this possibility, Figure Properties of Low Surface Brightness Galaxies and Normal Spirals in the Near-IR shows the strong correlation we observe between the HI mass and the near-IR absolute magnitudes. Indeed, to first order, galaxies which have more stars (as measured by the near-IR luminosity) have more HI. Note that there are magnitudes between the most HI massive galaxies and the less massive ones. Recall the striking fact that this correlation (which is well defined in both and ) is between the mass of the HI gas, and the near-IR luminosity of the stellar populations; a priori there should not be a correlation between the mass in stars a galaxy has formed and the amount of gas it has left.
In Figure Properties of Low Surface Brightness Galaxies and Normal Spirals in the Near-IR, straight lines represent constant values of the ratio of gas mass to stellar luminosity for MHI/L = 0.01 (long-dashed line), 0.1 (solid line), 1.0 (dotted line), and 10.0 (dashed line). Note that most LSBGs of our total sample have MHI/L 1.0 both in and , with an average of MHI/L and large scatter. While the scatter is over an order of magnitude in relative proportion of stars and gas, it is much smaller than the overall range of 8 orders of magnitude in overall gas mass, and thus does not wipe out the correlation between HI mass and total stellar luminosity. The overall trend in Figure Properties of Low Surface Brightness Galaxies and Normal Spirals in the Near-IR suggests that the division between our samples A and B is largely one mass, albeit with a wide range of gas mass to stellar luminosity ratios.
We may further examine our sample for trends in how the gas mass to stellar luminosity ratio varies as a function of the overall galaxy luminosity. Figure Properties of Low Surface Brightness Galaxies and Normal Spirals in the Near-IR shows the logarithmic gas mass to stellar luminosity ratio as a function of and absolute magnitudes (where we have adopted and ). Although there is considerable scatter, the lower luminosity galaxies have a higher fractional gas content, on average. The straight lines in Figure Properties of Low Surface Brightness Galaxies and Normal Spirals in the Near-IR are least square fits, giving slopes of in and in .
The gas mass to stellar luminosity ratio as a function of the absolute magnitude (Figure Properties of Low Surface Brightness Galaxies and Normal Spirals in the Near-IR) indicates the relative importance of gas and stars in the total baryonic mass budget (albeit indirectly). Galaxies with high in the near-IR have been historically less efficient at converting their gas into stars, due to either young mean age (i.e. a late start), low star-formation efficiency, large late-time gas infall, fewer past episodes of HI-stripping, or some combination of the above. The fact that we see some correlation between and the galaxies’ luminosities suggest that overall there are indeed trends between galaxies’ star formation histories and their stellar mass. However, the large scatter suggests that it is not a perfect one-to-one relationship. We will address these issues in more detail in subsequent sections, where we attempt to reduce the scatter by calculating the actual stellar mass, rather than using the near-IR luminosity as a substitute.
Another possible quantity which correlates with MHI is the galaxy morphology. The study of morphological types shows a modest correlation with HI content. Within our sample, a set of LSBGs with similar HI masses have morphological types spanning the entire Hubble sequence from dIm to Sa. However, despite the large scatter, a mean trend does exist for morphological types over the whole HI mass interval. Galaxies of sample A (with low HI masses and, via Figure Properties of Low Surface Brightness Galaxies and Normal Spirals in the Near-IR, low stellar luminosities) exhibit morphological types of dIm, Sm, Sd, and only a few earlier type Sc and Sb. Only three cases are Sa. In contrast, LSBGs of sample B are much earlier type, and are classified in general as Sc, Sb and Sa, although some cases of Sm are also present (see Figures Properties of Low Surface Brightness Galaxies and Normal Spirals in the Near-IR and Properties of Low Surface Brightness Galaxies and Normal Spirals in the Near-IR, and text below).
Much stronger trends are seen between the morphology of the galaxies and their gas mass to stellar luminosity ratio. Figures Properties of Low Surface Brightness Galaxies and Normal Spirals in the Near-IR and Properties of Low Surface Brightness Galaxies and Normal Spirals in the Near-IR show images of the galaxies sorted by their MHI/L values. The range in goes from MHI/L = 0.028 - 0.128 in Figure Properties of Low Surface Brightness Galaxies and Normal Spirals in the Near-IR (from LSBG #036 with log() = 8.74, to LSBG # 437 with log() = 7.92), and continues up to MHI/L = 1.475 in Figure Properties of Low Surface Brightness Galaxies and Normal Spirals in the Near-IR (galaxy LSBG #446 with log() = 9.63). It is apparent in these two Figures that as MHI/L becomes larger, galaxies extend to much later Hubble types, beyond the text-book Hubble sequence. Galaxies with small MHI/L are earlier Sa/Sb/Sc types, while galaxies with large tend to be Irr galaxies, suffer from tidal distortions, plumes and other peculiarities.
4.3 Stellar mass-luminosity ratios
In previous sections we have considered trends as a function of the HI mass to stellar luminosity. This ratio gives a measure of the evolutionary state of the galaxies, indicating how far the galaxy has proceeded along the path of converting gas into stars. However, the infrared stellar luminosity is only an approximate indicator of the stellar mass. We may obtain clearer and more physically meaningful results by using stellar population synthesis codes to translate the stellar luminosities into estimates of the actual stellar masses, allowing us to make a direct comparison between the gaseous and stellar mass.
To convert from IR luminosity to stellar mass, we may take advantage of the work of Bell and de Jong (2001), which demonstrated that although the stellar mass-to-light ratio varies by up to a factor of 2 in the near-IR, there are clear trends between the stellar M/L and color. Using spectrophotometric spiral galaxy evolution codes, Bell and de Jong (2001) showed that one can use the colors of galaxies to derive their relative stellar mass-to-light ratios (under the assumption of a universal spiral galaxy initial mass function). They also showed that uncertainties in the dust-reddening estimates do not strongly affect the final derived stellar masses of a stellar population.
For testing whether the variations of M/L with color are robust to different stellar population synthesis models, we have used Bell and de Jong (2001)’s relations between the stellar M/L and the and colors, to derive the relationship between M/L and our color333Differences between and are less than mags.. Three different models are tested, which are (1) an instantaneous burst with a Scalo IMF, from recent Bruzual & Charlot models (Liu, Charlot and Graham, 2000), (2) a recent version of PEGASE444PEGASE is “Projet d’Etude des GAlaxies par Sinthèse Evolutive. models (Fioc and Rocca-Volmerange, 1997, 2001) with an IMF slope of , and a model with a formation epoch with bursts, adopting a Salpeter IMF. All models have solar metallicity. The key point is that M/L vs color slopes do not depend on the IMF, which only affects the zero point. The stellar masses do not vary more than 7% between the two models. We have also used sub-solar metallicities and again the variation in the stellar masses are , and consistent with the variations between models. In what follows, we adopt the Salpeter model (using Table 1 from Bell and de Jong (2001)) and obtain coefficients for M/L as a function of color555Bell and de Jong (2001) note that these relations have been calibrated for maximal disks, and may be slight overestimates if the disks are submaximal.. With the adopted relationship between stellar mass to light ratio and color, we can compute the actual baryonic masses from the derived stellar masses () and the HI mass as . We are implicitly assuming that the mass contribution from molecular, ionized, and metallic gas is negligible for our sample.
Figure Properties of Low Surface Brightness Galaxies and Normal Spirals in the Near-IR shows the gas-to-star mass fraction as a function of stellar mass, after computing the stellar masses as described above. Figure Properties of Low Surface Brightness Galaxies and Normal Spirals in the Near-IR clearly shows that LSBGs with larger stellar masses tend to have smaller gas fractions, and LSBGs with small star masses have larger gas fractions.
We have also included in Figure Properties of Low Surface Brightness Galaxies and Normal Spirals in the Near-IR diagonal lines representing constant HI mass; dashed line for M☉ (close to our lowest HI mass), solid line for 9.0 M☉ (upper limit of our sample A), dotted line for 9.5 M☉ (lower limit for our sample B), and long-dashed line for 10.0 M☉ (close to our largest HI mass). These lines can be used for assessing the importance of selection criteria. For example, there seems to be a lower limit for the mass fraction HI-to-stars at . However, these LSBGs can exist but their HI would not be detectable, and thus they may not be present in the subsample of galaxies with measured HI fluxes that we selected from the Impey et al. (1996) catalogue.
Figure Properties of Low Surface Brightness Galaxies and Normal Spirals in the Near-IR also confirms our conclusions (1) that low HI mass does not imply that a galaxy has “used up” its gas reservoir and converted it entirely to stars (given the existence of galaxies with low and high ) and (2) that likewise high HI mass does not imply that a galaxy has only begun to convert HI into stars (given the large numbers of galaxies with large HI masses but large stellar masses as well). In other words, both high HI mass galaxies and low HI mass galaxies have a large range of stellar masses (with low HI mass galaxies having stellar masses between and M☉, and high HI mass galaxies having stellar masses between and M☉), and thus selecting on HI alone is not sufficient to identify galaxies which are gas-rich or gas-poor.
We have also plotted similar relations as in Figure Properties of Low Surface Brightness Galaxies and Normal Spirals in the Near-IR, but using the ratio of the HI mass to the total baryonic mass (), shown in Figure Properties of Low Surface Brightness Galaxies and Normal Spirals in the Near-IR. Note that the ratio MHI/Mbaryonic has an upper limit, when all the baryonic mass is concentrated in the gas (ratio = 1). We see again that increasing baryonic mass implies that a galaxy has converted a much larger fraction of its baryonic mass into stars. We have also included in Figure Properties of Low Surface Brightness Galaxies and Normal Spirals in the Near-IR the locus separating galaxies according to their dominant component, stars or gas. Again, note that “star-dominated” LSBGs can still have large quantities of HI, and similarly, “HI-dominated” LSBGs can have a small HI-mass if the overall baryonic mass is small. The extreme galaxy at M M☉ is LSBG 224 which, even with a large HI content (), has a baryonic mass represented almost exclusively by the stars. It is clearly a prominent Sa galaxy (see Figure Properties of Low Surface Brightness Galaxies and Normal Spirals in the Near-IR). In general, all of the star-dominated LSBGs are Sa/Sb galaxies, whereas the HI-dominated LSBGs have morphologies ranging from spirals to distorted or fuzzy irregulars. Among the most gas rich systems we find the most irregular and fuzzy LSBGs (HI-rich galaxies) in our sample. Note that, although the number of galaxies from sample A and B is roughly similar, most of the galaxies lie below the dotted horizontal line, and therefore are star dominated ones.
If we investigate these morphological trends further, we discover that both the stellar mass and the stellar-to-HI mass fraction are related closely to surface brightness. Figure Properties of Low Surface Brightness Galaxies and Normal Spirals in the Near-IR shows the bulge central surface brightness as a function of the ratio MHI/Mbaryonic, and as a function of the total baryonic mass. The ratio MHI/Mbaryonic increases with decreasing surface brightness, showing that at higher bulge surface brightnesses, galaxies have produced a much larger fraction of stars over their lifetime. It may be that the formation of a bulge creates an extremely efficient epoch of star formation, as gas is driven to very high central densities. Given the observed correlations between gas density and star formation rate (Kennicutt, 1998), then we would expect that galaxies with the highest stellar densities (i.e. the high surface brightness bulges) had the highest past star formation rates, and thus the lowest current gas fractions. In other words, all galaxies are “born” at the locus of MHI/M, and then travel downwards and to the left in Figure Properties of Low Surface Brightness Galaxies and Normal Spirals in the Near-IR to MHI/M, at a rate which depends in large part upon the central surface density of the gas. The end result is a lack of high surface brightness galaxies with large gas mass fractions, and low surface brightness galaxies with low gas mass fractions (e.g. the region around mag arcsec-2 and MHI/M).
We may explore these ideas more directly by converting the observed surface brightnesses to stellar surface densities, using the color-dependent stellar mass to light ratios calculated above. In Figure Properties of Low Surface Brightness Galaxies and Normal Spirals in the Near-IR we have plotted the color and gas to baryonic mass ratio as a function of the central stellar surface density of the bulge (in M☉/pc2). We see a very strong trend (correlation coefficient of 0.22) towards lower gas fractions with increasing central surface densities, as expected for increased star formation efficiency at higher surface densities. The scatter is also reduced over Figure Properties of Low Surface Brightness Galaxies and Normal Spirals in the Near-IR. In addition, we see a trend towards redder colors with increasing surface density, but we will defer a discussion of this effect until §4.4 below.
While the increase in MHI/Mbaryonic is a steady function of the bulge surface brightness, an equally striking trend is found with the the total baryonic mass. Figure Properties of Low Surface Brightness Galaxies and Normal Spirals in the Near-IR shows that the formation of a high surface brightness bulge is a very sharp function of the overall baryonic mass. Galaxies with baryonic masses of less than M simply do not form bulges (using mag arcsec-2, marked by a dash-dotted vertical line in Figure Properties of Low Surface Brightness Galaxies and Normal Spirals in the Near-IR, as the demarcation of galaxies which do not have bulges significant enough to be detectable in the near-IR, i.e. those which cannot be distinguished clearly from the disk)666For the galaxies with mag arcsec-2, we find mostly irregular morphologies, with a larger tendency toward showing spiral morphologies when dominated by stars (i.e. low MHI/Mstars)..
The floor in the baryonic mass suggests that there is a tight coupling between the mass of the galaxy and the conditions necessary for bulge formation. We can envision such a correlation arising as follows. Assuming that there is no large scale segregation between baryons and dark matter, then the baryonic mass of the galaxy should be directly proportional to the total mass of the galaxy (Mtotal/M, for and ). Because the total mass of a galaxy is closely coupled to several astrophysical timescales for galaxy formation (such as the epoch of first collapse, or the end of an epoch of merging), one might expect to see a correlation between tracers of these quantities and the baryonic mass. In many scenarios, the bulge forms via a by-product of early merging in the galaxy, or via the collapse of low angular momentum material in the galaxy – both of which probably depend closely on the above timescales. Thus, it may be that future models of galaxy formation can use this observed floor for bulge formation as a critical test.
The final question arises as to whether or not selection effects play a role in shaping the trends in Figure Properties of Low Surface Brightness Galaxies and Normal Spirals in the Near-IR. For example, the lack of galaxies with high surface brightness bulges in the near-IR and low baryonic masses (i.e. the dashed oval) may be due to the fact that our sample was drawn from a catalog of low surface brightness galaxies. Such a catalog would be biased against bright bulges, unless accompanied by a low surface brightness disk, which would increase the overall mass of the galaxy, possibly pushing it up above the floor. However, we suspect that the floor in Figure Properties of Low Surface Brightness Galaxies and Normal Spirals in the Near-IR is real, for several reasons. First of all, the existence of large numbers of galaxies with mag arcsec-2 suggests that the sample by no means excludes galaxies of high near-IR surface brightness galaxies. Indeed, an analysis by Sprayberry et al. (1996) shows that the original Impey et al. (1996) sample includes a large fraction of high optical surface brightness galaxies, indistinguishable from “normal” spirals. Second, if the addition of a low surface brightness disk were necessary for inclusion in the original Impey catalog, there is no reason why the lower left of the plot should not be populated with low mass galaxies that would otherwise have dropped off the bottom of the plot. Finally, the observational selection effects would be most apparent in a plot of purely observational quantities (for example, vs ), but in such a plot, we see the plane is evenly populated (e.g. Figure Properties of Low Surface Brightness Galaxies and Normal Spirals in the Near-IR), and we can identify no steps in the process of converting from to Mbaryonic that would lead to the creation of an artificial floor in the baryonic mass associated with high surface brightness bulges.
We stress that the fact that no gas poor but low surface brightness galaxies with very low values of MHI/Mbaryonic and faint surface brightness appear in the Figure ( mag arcsec-2 and MHI/M), which could be a combined effect of our initial selection on surface brightness and gas content ( mag arcsec-2), even though we have not imposed a low cut for the HI mass. We know that large galaxies with bright total magnitudes but extremely low surface brightness and large disk scale lengths do exist, like Malin 1 (with , mag arcsec-2 and , Matthews, van Driel and Monnier-Ragaigne (2001)) and are placed at such a locus in the diagram, where spirals with faint bulges and large stellar masses lie. However, Figure Properties of Low Surface Brightness Galaxies and Normal Spirals in the Near-IR suggests that these galaxies are rare.
4.4 The interplay between color and mass content
In the previous section we have explored trends involving MHI/Mbaryonic as an indicator of the evolutionary state of a galaxy. If a galaxy steadily transforms its initial reservoir of gas into stars, then as MHI/Mbaryonic decreases, the mean metallicity of the stellar population should increase as well. In this section we explore metallicity trends within our sample, after demonstrating that the near-IR color is an excellent indicator of the mean stellar metallicity.
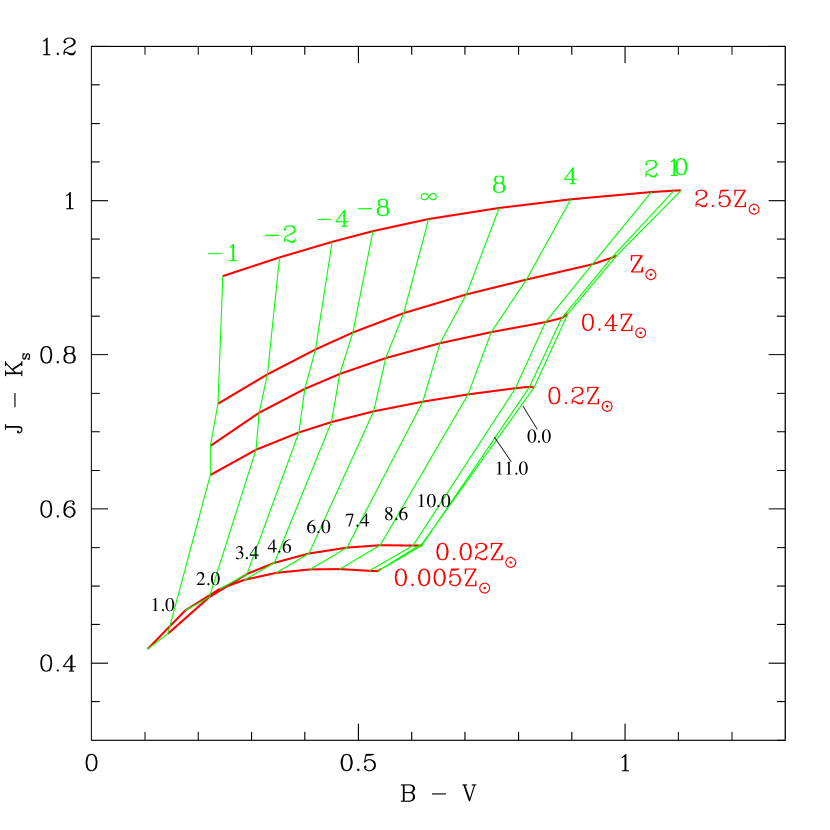
Within optical wavelengths, the variations in the broad band colors of galaxies are thought to be primarily driven by changes either in the mean age of the stellar population or in the dust content (Bell and de Jong, 2001). However, in the near-IR the situation is quite different. First of all, reddening due to dust is negligible in all but the most extreme starburst galaxies. Secondly, and most importantly for this analysis, changes in the near-IR color of a galaxy are driven almost entirely by the mean metallicity of the galaxy; in the near-IR, the light from a galaxy is dominated by stars on the red giant branch, the location of which shifts to redder or bluer colors depending on metallicity. To demonstrate this effect, in Figure Properties of Low Surface Brightness Galaxies and Normal Spirals in the Near-IR we plot stellar population synthesis models from Bruzual & Charlot (Liu, Charlot and Graham, 2000) of the color as a function of , for different metallicities and exponentially declining or increasing star-formation rates (i.e. with different mean stellar ages), assuming that star-formation started 12 Gyr ago. The color index is clearly very metal sensitive, and relatively age insensitive; see Bell et al. (2000). At a single stellar metallicity, the change in with mean stellar age is never more than , even when the mean age of the stellar population changes by 11 Gyr. This implies that whenever one witnesses a change of more than then one must be witnessing a significant change in stellar metallicity. We now apply these results to observations of the color distribution within our sample.
In Figure Properties of Low Surface Brightness Galaxies and Normal Spirals in the Near-IR we show color-magnitude diagrams for galaxies appearing in Table 2. The plot clearly shows that LSBGs span a wide range in IR color (), immediately suggesting a wide range in the stellar metallicities of the galaxies. As argued above, the largest possible shift in color due to age changes alone () is far too small to explain the full range of colors seen in our data. In other words, although changes in mean stellar age may contribute to the range in color, they cannot be responsible for all of it.
We may place some limits on the maximum range of metallicity compatible with the observed spread in color by assuming that the mean stellar age is constant (i.e. that all the color changes are due to metallicity alone). Based upon the grids in Figure Properties of Low Surface Brightness Galaxies and Normal Spirals in the Near-IR, a factor of 10 change in the metallicity produces changes in color of roughly . Therefore, our observed range in galaxy colors suggests a maximum change in mean stellar metallicity of more than a factor of 100 across the entire sample. Alternatively, we can calculate a minimum range in metallicity by allowing for the maximum spread in age (). The remaining color difference still implies a minimum range of over a factor of 20 in mean stellar metallicity. These two limiting cases suggests that over the mass range in our sample, we have a range in stellar metallicity covering a factor of .
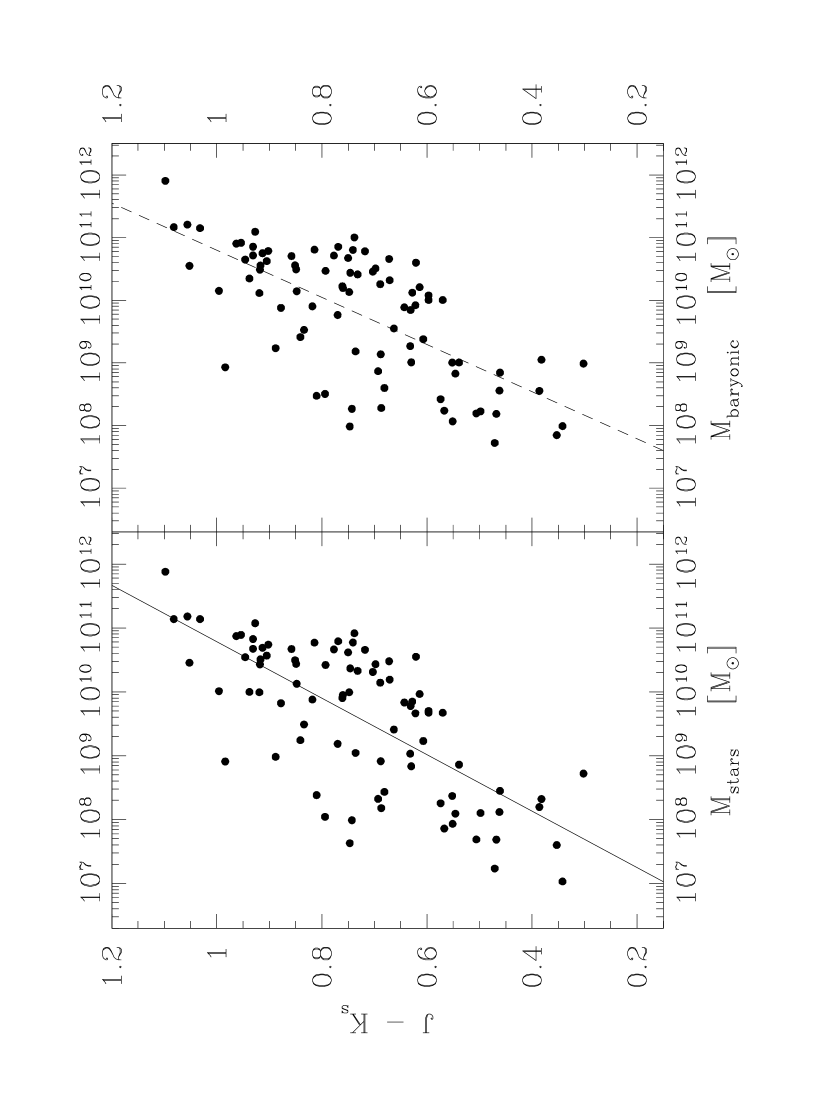
In addition to demonstrating the overall range of near-IR colors, Figure Properties of Low Surface Brightness Galaxies and Normal Spirals in the Near-IR shows a statistically significant trend between the IR color and the stellar luminosity of the galaxy, suggesting a trend between metallicity and stellar mass. (We may also use Figure Properties of Low Surface Brightness Galaxies and Normal Spirals in the Near-IR to compare the typical colors of the low gas-mass and high gas-mass subsamples that the lower HI mass galaxies in sample A are bluer that sample B by magnitudes, on average, immediately suggesting a mass dependent trend in galaxy metallicity, given the trends between HI mass, total stellar mass, and baryonic mass between the two samples). We can explore these trends more explicitly in Figure Properties of Low Surface Brightness Galaxies and Normal Spirals in the Near-IR, where we plot directly as a function of HI mass. As expected there is a systematic trend between the HI mass of a galaxy and its near-IR color. Finally we plot as a function of the stellar mass and of the total baryonic mass in Figure Properties of Low Surface Brightness Galaxies and Normal Spirals in the Near-IR. Again, we see trends in the near-IR color with the stellar and baryonic masses (with a slope of and a rms of 0.12 for the linear fit of color versus logarithmic stellar mass, and with a slope of with a rms of 0.13 for the linear fit with logarithmic total baryonic mass).
The general picture painted by Figures Properties of Low Surface Brightness Galaxies and Normal Spirals in the Near-IR-Properties of Low Surface Brightness Galaxies and Normal Spirals in the Near-IR is one where as the stellar mass, gas mass, and/or total baryonic mass within a sample of galaxies increases, the galaxies becomes redder in , and thus more metal rich on average. However, around all of these relations there is substantial scatter, suggesting that none of these quantities is the principal driver of metallicity.
Both our intuition and our data suggest that the true driver of the metallicity is the gas mass fraction MHI/Mbaryonic, which indicates the degree to which a galaxy has completed its lifetime of star formation. Galaxies that have only just begun to create stars have only begun to enrich their gas reservoirs, and thus should have a low mean stellar metallicity and very blue colors. Likewise, galaxies that have completely converted their gas into stars via several generations of star formation will have greatly enriched the gas from which the last half of the stars formed, leading to much more metal rich stellar populations and redder colors. In Figure Properties of Low Surface Brightness Galaxies and Normal Spirals in the Near-IR we plot the gas mass fraction MHI/Mbaryonic as a function of the metal sensitive color, and overall the behavior is just as expected. Compared to the previous figures, there is a substantial tightening of the relationship, especially towards the more stellar dominated systems (i.e. low values of MHI/Mbaryonic). This suggests that the typical stellar metallicity of a galaxy is indeed largely set by the degree to which it has already converted its gas into stars. We have already seen hints of this effect in Figure Properties of Low Surface Brightness Galaxies and Normal Spirals in the Near-IR, where the color is highly correlated with the central surface density of the galaxy, which in turn sets the efficiency of converting gas into stars and thus the subsequent value of MHI/Mbaryonic.
We may also gain additional insight by considering the scatter in Figure Properties of Low Surface Brightness Galaxies and Normal Spirals in the Near-IR. In a “closed box” model for chemical enrichment, the mean metallicity of the stellar population increases monotonically with decreasing gas mass fraction, leading to a perfect one-to-one relation between the two quantities. If the closed box model is valid on the scale of galaxies, then the relationship between and MHI/Mbaryonic should have zero scatter (modulo the small differences in produced by changes in mean age). For the galaxies in Figure Properties of Low Surface Brightness Galaxies and Normal Spirals in the Near-IR where star formation has proceeded largely to completion (MHI/M), the scatter is comparable to our observational errors, suggesting that evolution could have proceeded roughly along a closed box pathway777The gas poor galaxies are also those with the most substantial bulges, and thus it may be that the closed box approximation is valid for the bulges alone., as also concluded by Bell and de Jong (2001) for normal spirals. In contrast, for more gas rich galaxies, the scatter in is significantly larger than our uncertainties, suggesting that the closed box model is not a good approximation to the gas and metallicity evolution of these systems. Instead, these systems may still be in a phase of sporadic gas infall, as opposed to the more massive star-dominated galaxies where the gas infall seems to have run to completion. Note also that these gas rich galaxies span a much wider range in stellar luminosity (and thus stellar mass) at fixed MHI/Mbaryonic, possibly suggesting a much wider range of mean stellar age, which could contribute to the larger scatter as well.
To facilitate comparison with earlier work in the literature, we have also included in Figure Properties of Low Surface Brightness Galaxies and Normal Spirals in the Near-IR plots of the color as a function of MHI/L, which has traditionally been used as an indicator of the relative fraction of gas and stars. The observed trend toward lower MHI/L and redder colors is observed in both bandpasses, and while it is more obvious in the band, the relationship is still much weaker overall than the trend with MHI/Mbaryonic in Figure Properties of Low Surface Brightness Galaxies and Normal Spirals in the Near-IR. We fit the trend with straight lines, giving a slope of in (which is not significant), but a slope of in , which is. Note that O’Neil, Bothun and Schombert (2000) found no relationship between the gas fraction and the color, due to the large scatter (in that work the gas fraction and color relationship arise from a compilation of different sources of data). Our observed tightening of the relationship reflects Bothun (1982)’s observations that near-IR colors are less scattered than blue colors when plotted against the gas fraction.
We may explore the possible effects of age by considering previous work on the optical colors of LSBG’s. For example, one may compare Figure Properties of Low Surface Brightness Galaxies and Normal Spirals in the Near-IR with Figure 5a presented by O’Neil, Bothun and Schombert (2000), where no correlation exists between the HI mass and the (optical) color. The lack of any correlation between HI mass and the age sensitive color index suggests a stochastic star formation history, as also argued by Schombert, McGaugh & Eder (2001) for LSB dwarfs. The measured colors are luminosity weighted, and thus very small changes in the current star formation rate produce large changes in the luminosity-weighted mean age, and thus in . As quoted by O’Neil, Bothun and Schombert (2000), this clearly suggests the existence of “dormant” populations of LSBGs galaxies, which can have large quantities of HI but low current star formation.
If we take the increased scatter in Figure Properties of Low Surface Brightness Galaxies and Normal Spirals in the Near-IR towards gas rich galaxies as an indication of continuing gas infall, then we may simultaneously have an explanation for the sporadic past star formation history suggested by the optical data, namely gas density dependent star formation thresholds. In this scenario, ongoing gas infall occasionally raises the gas surface density above a critical threshold, triggering a burst of star formation and a strong bluing of the optical colors, whiled simultaneously diluting the metallicity of the gas phase and of subsequent generations of stars. This would yield a larger scatter both in metallicity and in age, leading to the much larger spread in colors. It would also help to explain why many of the optically faint LSBGs in our sample are sufficiently old to have developed significant red giant branch populations, in spite of what appear to be young luminosity weighted ages implied by their typically blue optical colors.
Finally, we note that all of the results above are based upon the color of the entire galaxy. If we were to consider only the disk component, the relationship between gas-to-star mass-luminosity ratio and color would be loosened with the increased scatter being due to the still low S/N which is obtained for the disk photometry in the near-IR.
5 Conclusions
The near-IR photometry of low surface brightness galaxies presented in this paper constitutes one of the largest database published until now. Because of our original selection of galaxies from the Impey et al. (1996) catalog, our sample includes not just a very large number of low surface brightness galaxies, but a number of normal spiral galaxies as well.
The total sample studied provides good indication that an old, red population of low surface brightness galaxies does exist. Many of the LSBGs analyzed exhibit clear bulges and have high surface brightness disks in the near-IR, even though they were originally identified in a catalog of optical LSBGs888These bulge dominated LSBGs also tend to be red, as found by Bell et al. (2000) for the optically selected red LSBGs of O’Neil, et al. (1997). Morphologically, the sample spans the full range of spiral Hubble types, from Sa to Im. While there are broad correlations between the galaxies’ optical and near-IR morphologies, we find several cases of galaxies which appear to be late-type in the optical, but have prominent bulges in the near-IR (e.g. LSBGs # 100, 338, 384, and 446 in Figures Properties of Low Surface Brightness Galaxies and Normal Spirals in the Near-IR and Properties of Low Surface Brightness Galaxies and Normal Spirals in the Near-IR).
In addition to the morphologies, a quantitative analysis of the surface brightness profiles of the galaxies suggests that our sample contains galaxies with disk surface densities comparable to normal spirals, as well as a very high fraction of truly low surface brightness (and/or low surface density) disks. On the bright end, we find that the central surface brightnesses of the disks in our sample show a well defined cutoff brighter than mag arcsec-2 (independent of the -band absolute magnitude). We argue that this cutoff is physical, and reflects the maximum surface density at which disks are stable. On the LSBG end, our sample includes a very high fraction of galaxies that are indeed low surface brightness even in the near-IR, with some reaching roughly 3.5 magnitudes fainter in surface brightness than the bright cutoff. The disks also have sizes that are systematically smaller for lower mass galaxies.
As part of our analysis, we have calculated the total baryonic masses (M) of galaxies in our sample. For Mgas, we have taken the HI mass from the Impey et al. (1996) catalog, and assumed that other gaseous components are negligible. For Mstars, we have used the color-dependent stellar mass-to-light ratios of Bell and de Jong (2001) to translate the observed near-IR luminosity into stellar mass. The mass-to-light ratios also allow us to convert observed surface brightnesses into stellar mass surface densities. The resulting masses and surface densities allow us to consider trends involving fundamental physical quantities (such as the ratio of the gas mass to the total baryonic mass). The total baryonic mass itself is probably a good indicator of the total mass of the galaxies, assuming that baryon and dark matter are evenly mixed on large scales.
Among the masses of the various components, we see strong correlations, many of which follow trends previously identified in the optical (for example, see compilations in Schombert, McGaugh & Eder (2001)). Galaxies with large stellar masses tend to also have high HI masses, higher central surface densities, but small gas mass fractions (i.e. are HI-poor). Likewise, galaxies with small stellar masses tend to have low HI masses but have a larger fraction of their baryonic mass in the gas phase (are HI-rich, as for the LSBGs studied by McGaugh and de Blok (1997)). We note that even galaxies which have formed large masses of stars can still retain large reservoirs of neutral gas, even after rich episodes of star formation.
We find several strong morphological correlations with the masses of the galaxies. There are systematic trends towards more irregular, diffuse morphologies and lower surface densities with increasing gas mass fraction (or alternatively, MHI/L). We also find that the central surface brightness of the bulge component varies strongly with the near-IR luminosity and HI mass, as well as with the stellar and the total baryonic mass (such that the bulges have higher surface brightness for larger values of the listed quantities). Moreover, we find that our sample exhibits a “floor” in the baryonic mass required for bulge formation, at ; we have no galaxies with lower baryonic masses that have formed high surface brightness bulges.
We have also explored how the near-IR color varies within our sample. In order to interpret the colors, we have used stellar population synthesis models to argue that the color is highly metal sensitive, such that redder colors imply higher metallicities. We argue that based upon the range of observed colors our sample spans a factor of more than 20 in metallicity (but less than a factor of 100). We find that galaxies have redder colors with increasing HI mass, stellar mass, and baryonic mass, suggesting that more massive galaxies have in general have more metal enriched stellar populations.
We find very tightest correlations between color and the gas mass fraction MHI/Mbaryonic in particular. These correlations are significantly tighter than previous optically determined trends, even in the redder color (see compilation in Figure 6 of Schombert, McGaugh & Eder (2001)). In a closed box model for chemical evolution, there should be a one-to-one relationship between the metallicity and the gas mass fraction. At small values of MHI/Mbaryonic, this is essentially what we see, in that the observed scatter in the metal-sensitive color is comparable to our observational uncertainties. This suggests that in the gas poor, bulge dominated massive galaxies, chemical evolution has proceeded along the canonical closed box pathway (possibly confined to the bulge, which dominates the luminosity and thus the colors of the galaxy).
We find a different behavior among the gas rich, disk dominated, lower mass galaxies. In these systems there is large scatter around the relationship between color and MHI/Mbaryonic. This suggests that not only is the enrichment of these galaxies on-going (given their high gas mass fraction), but that it is not proceding as expected for a “closed box” model of enrichment. Instead, it is likely that these gas rich systems are continuing to experience episodes of gas infall. These episodes of gas accretion first increase the ratio of gas to stars, and then dilute the metallicity of subsequent generations of stars.
Episodic accretion would also explain the stochastic star formation suggested by analyses of the optical colors of LSBGs (O’Neil, Bothun and Schombert, 2000; Bell and de Jong, 2001) and theoretical calculations (Gerritsen and de Blok, 1998; Jimenez et al., 1998). Temporary increases above a gas surface density threshold for star formation could dramatically increase the star formation rate (Kennicutt, 1998), triggering bursts of star formation and an increased rate of gas consumption. This change in the luminosity-weighted mean stellar age would produce additional scatter in the color, scatter which will be more dramatic in the optical.
Within our sample, we see strong evidence that the star formation efficiency is indeed surface density dependent. We find strong correlations between the gas mass fraction MHI/Mbaryonic and the central stellar surface density (i.e. Mstars/pc2), suggesting that galaxies with the highest initial gas surface density have also had the highest efficiency in turning gas into stars. This link between surface density and star formation efficiency also suggests that the young mean stellar age of LSBGs (as deduced from luminosity-weighted optical colors) results principally from the galaxies being slow to convert gas into stars, rather than from their being slow to assemble (see also Bell et al. (2000), Schombert, McGaugh & Eder (2001), de Blok & van der Hulst (1998)). However, the evidence for on-going gas accretion in lower luminosity galaxies suggests that this second effect does play some role as well.
For future work, we intend to extend the current work with the addition of optical colors from our on-going database of and photometry for the same galaxies presented here, as well as from other bands provided by The Sloan Digital Sky Survey. We shall compute dynamical masses, and current gas phase metallicities using also future spectroscopic data. This will allow us to perform more critical and accurate tests of the ideas presented in this work.
References
- Bergvall et al. (1999) Bergvall, N., Rönnback, J., Masegosa, J., Östlin, G. 1999, A&A, 341, 697
- Bertin and Arnouts (1996) Bertin, E. & Arnouts, S. 1996, A&AS, 117, 393
- Beijersbergen, de Blok and van der Hulst (1999) Beijersbergen, M., de Blok, W., & van der Hulst, J. 1999, A&A, 351, 903
- Bell and de Jong (2001) Bell, E., & de Jong, R. ApJ, 550, 212
- Bell et al. (2000) Bell, E., Barnaby, D., Bower, R. et al. 2000, MNRAS, 312, 470
- Bell & de Jong (2000) Bell, E. & de Jong, R., 2000, MNRAS, 312, 497
- Bell et al. (1999) Bell, E., Bower, R., de Jong, R., Hereld, M., & Rauscher, B. 1999, MNRAS, 302, 55
- de Blok & McGaugh (1997) de Blok, W., & McGaugh, S. 1997 MNRAS, 290, 533
- de Blok & van der Hulst (1998) de Blok, W., & van der Hulst, J., A&A, 335, 421
- de Blok, McGaugh and van der Hulst (1996) de Blok, W., McGaugh, S., & van der Hulst, J. 1996, MNRAS, 283, 18
- de Blok, van der Hulst and Bothun (1995) de Blok, W., van der Hulst, J., & Bothun, D. 1995, MNRAS, 274, 235
- Bothun (1982) Bothun, G. 1982, ApJS, 50, 39
- Bothun et al. (1987) Bothun, G., Impey, C., Malin, D., & Mould, J. 1987, AJ, 94, 23
- Bothun, Impey and McGaugh (1997) Bothun, G., Impey C., & McGaugh, S. 1997, PASP, 109, 745
- Courteau (1996) Courteau, S. 1996, ApJS, 103, 363
- Dalcanton, Spergel and Summers (1997) Dalcanton, J., Spergel, D., & Summers, F. 1997, ApJ, 482, 659
- Disney (1976) Disney, M. 1976, Nature, 263, 573
- Fioc and Rocca-Volmerange (1997) Fioc, M. & Rocca-Volmerange, B. 1997, A&A, 326, 950
- Fioc and Rocca-Volmerange (2001) Fioc, M., & Rocca-Volmerange, B., in preparation
- Fisher and Tully (1975) Fisher, J., & Tully, R. 1975, A&A, 44, 151
- Freeman (1970) Freeman, K. 1970, ApJ, 160, 811 (erratum 1970, ApJ, 161, 802)
- Galaz (2000) Galaz, G. 2000, AJ, 119, 2118
- Gerritsen and de Blok (1998) Gerritsen, P. & de Blok, W. 1998, A&A, 342, 655
- Giovanelli et al. (1998) Giovanelli, R., Haynes, M., Salzer, J., Wegner, G., da Costa, L., & Freudling, W. 1998, AJ, 116, 2632
- Impey and Bothun (1989) Impey, C. & Bothun, G. 1989, ApJ, 341, 89
- Impey et al. (1996) Impey, C., Sprayberry D., Irwin M., & Bothun G. 1996, ApJS, 105, 209
- de Jong (1996) de Jong, R. 1996, A&A, 313, 45
- Jimenez et al. (1998) Jimenez, R., Padoan, P., Matteucci, F., Heavens, A. 1998, MNRAS, 299, 123
- Kennicutt (1998) Kennicutt, R. 1998, ARA&A
- Knezek and Wroten (1994) Knezek, P., & Wroten, J. 1994, AAS, 185, 77.13
- Kraan-Korteweg (1986) Kraan-Korteweg, R. 1986, A&AS, 66, 255
- Liu, Charlot and Graham (2000) Liu, M., Charlot, S., & Graham, J. 2000, ApJ, 543, 644
- Longmore et al. (1982) Longmore, A., Hawarden, T., Goss, W., Mebold, U., & Webster, B. 1982, MNRAS, 200, 325
- Matthews, van Driel and Monnier-Ragaigne (2001) Matthews, L., van Driel, W., & Monnier-Ragaigne, D. 2001, A&A, 365, 1
- McGaugh and de Blok (1997) McGaugh, S., & de Blok, W. 1997, ApJ, 481, 689
- McGaugh (1994) McGaugh, S. 1994, ApJ, 426, 135
- McGaugh (1992) McGaugh, S. 1992, PhD Thesis, Univ. Michigan
- O’Neil, Bothun and Schombert (2000) O’Neil, K., Bothun, G., & Schombert, J. 2000, AJ, 119, 136
- O’Neil, et al. (1997) O’Neil, K., Bothun, G., Schombert, J., Cornell, M., & Impey, C. 1997, AJ, 114, 2448
- Persson et al. (1998) Persson, E., Murphy, D., Krzeminski, W., Roth, M., & Rieke, M. 1998, ApJ, 116, 2475
- Schlegel, Finkbeiner and Davis (1998) Schelegel, D., Finkbeiner, P. & Davis, M. 1998, ApJ, 500, 525
- Schombert, McGaugh & Eder (2001) Schombert, J., McGaugh, S. S., & Eder, J. A. 2001, ApJ, 95, 1389
- Schombert and Bothun (1988) Schombert, J. & Bothun, G. 1988, AJ, 95, 1389
- Sprayberry et al. (1995) Sprayberry, D., Bernstein, G., Impey, C., & Bothun, G. 1995, ApJ, 438, 72
- Sprayberry et al. (1996) Sprayberry, D., Impey, C., & Irwin, M. 1996, ApJ, 463, 535
- Tully et al. (1998) Tully, R., Pierce, M., Huang, J.-S., Saunders, W., Verheijen, M., & Witchalls, P. 1998, AJ, 115, 2264
- Tully and Verheijen (1997) Tully, B. & Verheijen, M. 1997, ApJ, 484, 145
- Tully and Fisher (1977) Tully, R. & Fisher, J. 1977, A&A, 54, 661
- van den Bergh (1959) van den Bergh, S. 1959, Pub. David Dunlap Obs., 2, 159
- van den Bergh (1998) van den Bergh, S. 1998, Galaxy Morphology and Classification (Cambridge University Press)
- van den Hoek et al. (2000) van den Hoek, L., de Blok, W., van der Hulst, J., & de Jong, T. 2000, A&A, 357, 397
- van der Hulst et al. (1993) van der Hulst, Skillman, E., Smith, T., Bothun, G., McGaugh, S., & de Blok, W. 1993, AJ, 106, 548
- de Vaucouleurs (1948) de Vaucouleurs, G. 1948, Ann. d’Astrophys. 11, 247
- Verheijen (1997) Verheijen, M. 1997, Ph.D. thesis, Univ. Groningen
- Zwicky (1957) Zwicky, F. 1957, Morphological Astronomy (Berlin: Springer)
| No. nights | Stars/night | ||||||
|---|---|---|---|---|---|---|---|
| (1) | (2) | (3) | (4) | (5) | (6) | (7) | (8) |
| 40-inch Swope telescope | |||||||
| 5.22 (0.15)(9)(9)The standard deviation for the corresponding averages are included between parenthesis. | 0.21 (0.23) | 5.98 (0.13) | 0.12 (0.25) | 0.12 (0.05) | 0.07 (0.08) | 17 | 9 |
| 100-inch du Pont telescope | |||||||
| 3.42 (0.12) | 0.08 (0.26) | 4.00 (0.14) | 0.07 (0.20) | 0.11 (0.06) | 0.09 (0.08) | 12 | 9 |
| (1)(1)footnotetext: Average zero point for the filter. (2)(2)footnotetext: Average color term for the filter. (3)(3)footnotetext: Average zero point for the filter. (4)(4)footnotetext: Average color term for the filter. (5)(5)footnotetext: Average extinction value for the filter. (6)(6)footnotetext: Average extinction value for the filter. (7)(7)footnotetext: Number of nights considered for computing the average values. (8)(8)footnotetext: Number of standard stars observed per night. | |||||||
| aa Number correlative to the Impey et al. (1996) catalogue. | Namebb Name from the Impey et al. (1996) catalogue. | cc Heliocentric radial velocity in km/sec from the 21-cm HI line (Impey et al., 1996). | MHIdd HI mass expressed as log(MHI/M⊙) (Impey et al., 1996). | Exp. ee Total exposure time in the corresponding filter. | Exp. ee Total exposure time in the corresponding filter. | Ap.ff Average between the major and minor axes of the elliptical aperture used
by SExtractor, in arcsecs. The value corresponds to 3 above sky, in the filter. The same elliptical aperture is used for the image. |
ggCalibrated aperture magnitude. | hhPhotometric error. | ggCalibrated aperture magnitude. | hhPhotometric error. | MJiiAbsolute magnitude computed following equation 3, but considering . | MiiAbsolute magnitude computed following equation 3, but considering . | ||
|---|---|---|---|---|---|---|---|---|---|---|---|---|---|---|
| low HI mass sample (sample A) | ||||||||||||||
| 16 | 0027+0134 | 3436 | 8.65 | 2250.0 | 2750.0 | 20.0 | 13.119 | 0.03 | 12.817 | 0.06 | -20.186 | -20.488 | 0.302 | 0.07 |
| 33 | 0101+0304 | 4379 | 8.92 | 3600.0 | 1250.0 | 22.0 | 14.742 | 0.04 | 13.901 | 0.07 | -19.089 | -19.930 | 0.841 | 0.08 |
| 36 | 0104+0140 | 4708 | 8.74 | 1800.0 | 2500.0 | 12.0 | 12.706 | 0.03 | 11.858 | 0.04 | -21.282 | -22.130 | 0.848 | 0.05 |
| 38 | 0105+0047 | 632 | 7.48 | 2250.0 | 3750.0 | 20.0 | 13.573 | 0.03 | 13.220 | 0.07 | -16.055 | -16.408 | 0.353 | 0.08 |
| 295 | 0124-0043 | 963 | 8.10 | 2760.0 | 3750.0 | 20.0 | 13.513 | 0.02 | 12.832 | 0.04 | -17.029 | -17.710 | 0.681 | 0.04 |
| 100 | 0233+0012 | 2615 | 8.89 | 2250.0 | 4250.0 | 22.0 | 13.362 | 0.02 | 12.730 | 0.04 | -19.350 | -19.982 | 0.632 | 0.04 |
| 146 | 0336+0212 | 3144 | 8.62 | 3600.0 | 5500.0 | 22.0 | 14.362 | 0.05 | 13.901 | 0.08 | -18.750 | -19.211 | 0.461 | 0.09 |
| 200 | 0918-0028 | 3492 | 8.63 | 2250.0 | 3600.0 | 19.2 | 12.622 | 0.03 | 11.804 | 0.03 | -20.718 | -21.536 | 0.818 | 0.04 |
| 201 | 0918+0147 | 4978 | 8.88 | 3000.0 | 3750.0 | 18.0 | 15.854 | 0.06 | 14.966 | 0.09 | -18.256 | -19.144 | 0.888 | 0.10 |
| 249 | 1035+0238 | 5637 | 8.89 | 3000.0 | 4000.0 | 10.0 | 16.088 | 0.06 | 15.536 | 0.09 | -18.291 | -18.843 | 0.552 | 0.10 |
| 253 | 1036+0158 | 710 | 7.62 | 3150.0 | 3500.0 | 22.0 | 13.118 | 0.03 | 12.620 | 0.05 | -16.763 | -17.261 | 0.498 | 0.06 |
| 264 | 1043+0202 | 1018 | 7.73 | 2880.0 | 4450.0 | 8.0 | 15.898 | 0.04 | 15.151 | 0.08 | -14.765 | -15.512 | 0.747 | 0.09 |
| 266 | 1047+0131 | 1604 | 7.94 | 3000.0 | 3750.0 | 13.9 | 15.653 | 0.05 | 14.910 | 0.07 | -15.997 | -16.740 | 0.743 | 0.09 |
| 270 | 1050+0253 | 1037 | 8.02 | 3150.0 | 4000.0 | 17.0 | 14.504 | 0.04 | 14.036 | 0.07 | -16.199 | -16.667 | 0.468 | 0.08 |
| 285 | 1108+0121 | 993 | 8.00 | 3000.0 | 3950.0 | 26.1 | 14.466 | 0.03 | 13.899 | 0.06 | -16.143 | -16.710 | 0.567 | 0.07 |
| 308 | 1156+0254 | 3233 | 8.72 | 4800.0 | 5500.0 | 17.0 | 15.791 | 0.04 | 15.098 | 0.07 | -17.381 | -18.074 | 0.693 | 0.08 |
| 312 | 1158-0101 | 1533 | 8.45 | 1800.0 | 2750.0 | 20.0 | 12.253 | 0.02 | 11.419 | 0.05 | -19.299 | -20.133 | 0.834 | 0.05 |
| 314 | 1205+0058 | 5870 | 8.97 | 2000.0 | 2750.0 | 21.0 | 14.034 | 0.04 | 13.156 | 0.06 | -20.433 | -21.311 | 0.878 | 0.07 |
| 319 | 1209+0305 | 883 | 7.94 | 3360.0 | 4000.0 | 15.0 | 15.350 | 0.05 | 15.008 | 0.08 | -15.004 | -15.346 | 0.342 | 0.09 |
| 329 | 1216+0029 | 867 | 7.55 | 3000.0 | 3750.0 | 70.0 | 15.411 | 0.05 | 14.940 | 0.07 | -14.903 | -15.374 | 0.471 | 0.09 |
| 330 | 1217+0103 | 2056 | 8.62 | 2400.0 | 2750.0 | 20.0 | 13.392 | 0.03 | 12.656 | 0.05 | -18.797 | -19.533 | 0.736 | 0.06 |
| 336 | 1223+0117 | 1473 | 7.59 | 3000.0 | 3750.0 | 15.0 | 14.788 | 0.03 | 14.101 | 0.06 | -16.677 | -17.364 | 0.687 | 0.07 |
| 338 | 1223-0058 | 2018 | 8.32 | 3120.0 | 3750.0 | 10.4 | 16.128 | 0.07 | 15.334 | 0.08 | -16.021 | -16.815 | 0.794 | 0.10 |
| 348 | 1227+0254 | 1635 | 8.36 | 2400.0 | 3750.0 | 15.0 | 14.074 | 0.06 | 13.612 | 0.07 | -17.618 | -18.080 | 0.462 | 0.09 |
| 349 | 1228+0157 | 1105 | 7.75 | 3000.0 | 3650.0 | 20.9 | 14.421 | 0.06 | 13.611 | 0.07 | -16.420 | -17.230 | 0.810 | 0.09 |
| 365 | 1257+0219 | 874 | 7.61 | 3000.0 | 4000.0 | 18.0 | 13.588 | 0.04 | 12.604 | 0.05 | -16.744 | -17.728 | 0.984 | 0.06 |
| 384 | 1326+0109 | 3267 | 8.74 | 3000.0 | 3750.0 | 25.0 | 14.313 | 0.03 | 13.625 | 0.06 | -18.882 | -19.570 | 0.688 | 0.07 |
| 385 | 1327+0148 | 1049 | 7.49 | 2400.0 | 3650.0 | 20.8 | 14.285 | 0.03 | 13.734 | 0.06 | -16.443 | -16.994 | 0.551 | 0.07 |
| 393 | 1350+0022 | 4605 | 8.84 | 3150.0 | 3500.0 | 18.0 | 13.797 | 0.04 | 13.190 | 0.05 | -20.143 | -20.750 | 0.607 | 0.06 |
| 398 | 1353+020 | 4738 | 8.96 | 3000.0 | 3750.0 | 17.5 | 15.088 | 0.06 | 14.706 | 0.06 | -18.914 | -19.296 | 0.382 | 0.08 |
| 400 | 1357-0017 | 4255 | 8.74 | 4800.0 | 5500.0 | 13.0 | 16.210 | 0.06 | 15.664 | 0.09 | -17.559 | -18.105 | 0.546 | 0.10 |
| 424 | 1433+0249 | 1557 | 8.03 | 4800.0 | 5250.0 | 17.0 | 15.273 | 0.05 | 14.767 | 0.08 | -16.313 | -16.819 | 0.506 | 0.09 |
| 433 | 1438+0049 | 2837 | 8.30 | 3000.0 | 5500.0 | 20.0 | 14.463 | 0.04 | 14.077 | 0.08 | -18.426 | -18.812 | 0.386 | 0.09 |
| 435 | 1439+0053 | 1891 | 8.53 | 1680.0 | 2250.0 | 27.8 | 13.291 | 0.02 | 12.661 | 0.06 | -18.717 | -19.347 | 0.630 | 0.06 |
| 437 | 1440-0010 | 1744 | 7.92 | 2400.0 | 3500.0 | 20.8 | 14.349 | 0.04 | 13.775 | 0.06 | -17.483 | -18.057 | 0.574 | 0.07 |
| 436 | 1440-0008 | 1703 | 8.46 | 2250.0 | 3000.0 | 28.0 | 12.639 | 0.03 | 12.100 | 0.07 | -19.141 | -19.680 | 0.539 | 0.08 |
| 468 | 2311-000 | 4392 | 8.95 | 1800.0 | 2750.0 | 20.0 | 12.364 | 0.03 | 11.721 | 0.05 | -21.474 | -22.117 | 0.643 | 0.06 |
| 483 | 2319+0112 | 8816 | 9.73 | 2700.0 | 4000.0 | 20.0 | 13.810 | 0.04 | 13.240 | 0.07 | -21.541 | -22.111 | 0.570 | 0.08 |
| 488 | 2327-0007 | 5207 | 8.99 | 2700.0 | 3750.0 | 30.0 | 12.776 | 0.03 | 12.145 | 0.06 | -21.431 | -22.062 | 0.631 | 0.07 |
| 492 | 2329+0203 | 5176 | 8.99 | 2700.0 | 3750.0 | 20.0 | 13.831 | 0.03 | 13.168 | 0.06 | -20.363 | -21.026 | 0.663 | 0.07 |
| High HI mass sample (sample B) | ||||||||||||||
| 4 | 0013-0034 | 11806 | 10.18 | 1650.0 | 2750.0 | 20.0 | 12.625 | 0.03 | 11.907 | 0.06 | -23.360 | -24.078 | 0.718 | 0.07 |
| 23 | 0050+0005 | 10283 | 9.83 | 800.0 | 3000.0 | 13.0 | 14.300 | 0.03 | 13.540 | 0.06 | -21.385 | -22.145 | 0.760 | 0.07 |
| 30 | 0056+0019 | 5437 | 9.62 | 1800.0 | 2750.0 | 23.0 | 11.915 | 0.02 | 11.169 | 0.05 | -22.386 | -23.132 | 0.746 | 0.05 |
| 59 | 0121+0128 | 5028 | 9.64 | 1350.0 | 1500.0 | 25.0 | 10.726 | 0.02 | 9.985 | 0.05 | -23.405 | -24.146 | 0.741 | 0.05 |
| 126 | 0311+0241 | 9533 | 9.57 | 2250.0 | 2750.0 | 12.0 | 13.986 | 0.04 | 13.238 | 0.07 | -21.534 | -22.282 | 0.748 | 0.08 |
| 165 | 0350+0041 | 11362 | 9.60 | 2250.0 | 3750.0 | 20.0 | 13.156 | 0.03 | 12.298 | 0.05 | -22.746 | -23.604 | 0.858 | 0.06 |
| 196 | 0913+0054 | 11401 | 9.68 | 2700.0 | 2750.0 | 21.0 | 13.050 | 0.04 | 12.096 | 0.05 | -22.859 | -23.813 | 0.954 | 0.06 |
| 207 | 0929+0147 | 17324 | 10.03 | 1800.0 | 2750.0 | 27.0 | 13.855 | 0.05 | 12.105 | 0.06 | -22.962 | -24.712 | 1.750 | 0.08 |
| 213 | 0954+020 | 9592 | 9.59 | 1800.0 | 2750.0 | 24.0 | 13.686 | 0.05 | 12.768 | 0.06 | -21.848 | -22.766 | 0.918 | 0.08 |
| 224 | 1007+0121 | 29213 | 10.69 | 1800.0 | 2750.0 | 24.0 | 13.217 | 0.03 | 12.119 | 0.07 | -24.735 | -25.833 | 1.098 | 0.08 |
| 225 | 1008+0128 | 9915 | 9.87 | 1800.0 | 2750.0 | 24.0 | 13.080 | 0.05 | 12.167 | 0.05 | -22.526 | -23.439 | 0.913 | 0.07 |
| 230 | 1015+0148 | 13660 | 9.84 | 3000.0 | 3750.0 | 12.0 | 14.965 | 0.03 | 13.913 | 0.04 | -21.336 | -22.388 | 1.052 | 0.05 |
| 242 | 1030+0252 | 8825 | 9.65 | 1800.0 | 2750.0 | 16.0 | 12.581 | 0.04 | 11.650 | 0.04 | -22.772 | -23.703 | 0.931 | 0.06 |
| 262 | 1043+0018 | 13966 | 9.50 | 1800.0 | 2750.0 | 10.0 | 13.911 | 0.03 | 13.118 | 0.06 | -22.439 | -23.232 | 0.793 | 0.07 |
| 265 | 1045+0014 | 11644 | 9.57 | 1800.0 | 2500.0 | 12.0 | 13.747 | 0.05 | 12.898 | 0.06 | -22.208 | -23.057 | 0.849 | 0.08 |
| 267 | 1048+0125 | 11560 | 9.62 | 1800.0 | 2750.0 | 18.0 | 12.819 | 0.03 | 11.787 | 0.07 | -23.120 | -24.152 | 1.032 | 0.08 |
| 281 | 1106+0032 | 7639 | 9.69 | 1800.0 | 2750.0 | 10.8 | 12.674 | 0.02 | 11.743 | 0.06 | -22.365 | -23.296 | 0.931 | 0.06 |
| 291 | 1116+0053 | 8059 | 9.56 | 1117.0 | 2750.0 | 18.0 | 13.128 | 0.02 | 12.211 | 0.07 | -22.028 | -22.945 | 0.917 | 0.07 |
| 294 | 1121+0058 | 7784 | 9.68 | 1800.0 | 2750.0 | 24.0 | 12.791 | 0.02 | 11.940 | 0.06 | -22.289 | -23.140 | 0.851 | 0.06 |
| 296 | 1125+0255 | 6842 | 9.81 | 1800.0 | 2000.0 | 25.0 | 12.155 | 0.04 | 11.253 | 0.06 | -22.645 | -23.547 | 0.902 | 0.07 |
| 298 | 1129+0013 | 11899 | 9.99 | 2400.0 | 3000.0 | 14.0 | 13.975 | 0.02 | 13.029 | 0.06 | -22.027 | -22.973 | 0.946 | 0.06 |
| 299 | 1130-0027 | 6688 | 9.50 | 3550.0 | 4900.0 | 14.0 | 14.053 | 0.02 | 13.134 | 0.05 | -20.698 | -21.617 | 0.919 | 0.05 |
| 310 | 1156+0142 | 14131 | 9.77 | 2250.0 | 2850.0 | 19.2 | 13.586 | 0.03 | 12.623 | 0.05 | -22.789 | -23.752 | 0.963 | 0.06 |
| 316 | 1208+0120 | 14100 | 9.72 | 1800.0 | 2750.0 | 18.0 | 14.077 | 0.05 | 13.172 | 0.06 | -22.293 | -23.198 | 0.905 | 0.08 |
| 324 | 1211+0226 | 22259 | 10.19 | 2250.0 | 2750.0 | 17.0 | 14.187 | 0.03 | 13.515 | 0.05 | -23.175 | -23.847 | 0.672 | 0.06 |
| 326 | 1213+0221 | 23252 | 10.09 | 2880.0 | 4500.0 | 5.0 | 16.700 | 0.04 | 15.762 | 0.04 | -20.757 | -21.695 | 0.938 | 0.06 |
| 327 | 1213+0127 | 14976 | 9.76 | 1200.0 | 2000.0 | 12.0 | 13.039 | 0.04 | 12.112 | 0.05 | -23.462 | -24.389 | 0.927 | 0.06 |
| 345 | 1226+0105 | 23655 | 10.26 | 2250.0 | 2750.0 | 17.0 | 13.526 | 0.03 | 12.788 | 0.05 | -23.968 | -24.706 | 0.738 | 0.06 |
| 346 | 1226+0119 | 6958 | 9.62 | 1200.0 | 1500.0 | 15.0 | 12.701 | 0.04 | 12.012 | 0.04 | -22.136 | -22.825 | 0.689 | 0.06 |
| 370 | 1300+0144 | 12264 | 9.98 | 1800.0 | 2500.0 | 25.0 | 13.171 | 0.04 | 12.089 | 0.06 | -22.896 | -23.978 | 1.082 | 0.07 |
| 377 | 1310-0019 | 12040 | 9.84 | 3600.0 | 7500.0 | 17.0 | 14.502 | 0.02 | 13.905 | 0.05 | -21.525 | -22.122 | 0.597 | 0.05 |
| 378 | 1315+0029 | 9497 | 9.94 | 3150.0 | 4000.0 | 16.0 | 14.259 | 0.03 | 13.498 | 0.05 | -21.253 | -22.014 | 0.761 | 0.06 |
| 380 | 1321+0137 | 16954 | 9.64 | 2250.0 | 3750.0 | 17.0 | 13.204 | 0.03 | 12.583 | 0.05 | -23.567 | -24.188 | 0.621 | 0.06 |
| 407 | 1401+0108 | 12901 | 9.66 | 2700.0 | 2750.0 | 17.0 | 13.697 | 0.04 | 12.965 | 0.05 | -22.480 | -23.212 | 0.732 | 0.06 |
| 410 | 1405+0006 | 7518 | 9.73 | 1800.0 | 2750.0 | 17.0 | 13.608 | 0.04 | 13.011 | 0.04 | -21.397 | -21.994 | 0.597 | 0.06 |
| 446 | 1446+0231 | 10261 | 9.63 | 3000.0 | 3750.0 | 10.4 | 16.251 | 0.05 | 15.481 | 0.04 | -19.429 | -20.199 | 0.770 | 0.06 |
| 447 | 1446+0238 | 10281 | 9.73 | 1800.0 | 1500.0 | 17.0 | 13.291 | 0.04 | 12.620 | 0.07 | -22.393 | -23.064 | 0.671 | 0.08 |
| 462 | 2303-0006 | 7468 | 9.71 | 1800.0 | 2750.0 | 30.0 | 12.163 | 0.04 | 11.465 | 0.05 | -22.827 | -23.525 | 0.698 | 0.06 |
| 463 | 2304+0155 | 5244 | 9.57 | 1800.0 | 3750.0 | 25.0 | 13.034 | 0.03 | 12.412 | 0.05 | -21.189 | -21.811 | 0.622 | 0.06 |
| 470 | 2312-0011 | 15380 | 9.98 | 1800.0 | 2750.0 | 18.0 | 13.074 | 0.03 | 12.305 | 0.04 | -23.485 | -24.254 | 0.769 | 0.05 |
| 471 | 2313+0008 | 8667 | 9.76 | 1350.0 | 2750.0 | 22.0 | 12.238 | 0.02 | 11.488 | 0.04 | -23.076 | -23.826 | 0.750 | 0.04 |
| 473 | 2315-0000 | 8938 | 9.71 | 1800.0 | 2750.0 | 22.0 | 12.212 | 0.02 | 11.398 | 0.06 | -23.168 | -23.982 | 0.814 | 0.06 |
| 474 | 2317+0112 | 9046 | 9.74 | 1350.0 | 2500.0 | 22.0 | 12.333 | 0.02 | 11.556 | 0.06 | -23.074 | -23.851 | 0.777 | 0.06 |
| 485 | 2320+0107 | 8868 | 9.84 | 1800.0 | 2750.0 | 18.0 | 13.290 | 0.03 | 12.676 | 0.05 | -22.073 | -22.687 | 0.614 | 0.06 |
| 484 | 2320+0110 | 8951 | 9.91 | 1350.0 | 2500.0 | 15.0 | 12.853 | 0.03 | 12.150 | 0.06 | -22.531 | -23.234 | 0.703 | 0.07 |
| 487 | 2325-0000 | 10147 | 10.00 | 2700.0 | 2500.0 | 18.0 | 12.558 | 0.05 | 11.502 | 0.07 | -23.098 | -24.154 | 1.056 | 0.09 |
| 515 | 2349+0248 | 5324 | 9.79 | 1800.0 | 2750.0 | 22.0 | 12.631 | 0.04 | 12.003 | 0.04 | -21.624 | -22.252 | 0.628 | 0.06 |
| 516 | 2351+0045 | 11279 | 9.59 | 3150.0 | 3000.0 | 20.0 | 15.421 | 0.04 | 14.425 | 0.06 | -20.465 | -21.461 | 0.996 | 0.07 |
Figure captions
Light profiles in the and bands for one LSBGs studied in the sample B. The total light profile is fitted by two exponential profiles, a bulge and a disk components, using equation 6.
Mosaic of sample A (low HI mass sample). The label is correlative with column 1 of Table 2. Figure under request.
Mosaic of sample B (high HI mass sample). The label is correlative with column 1 of Table 2. Figure under request.
absolute magnitude as a function of the disk central surface brightness. Filled circles indicate LSBGs of sample A, and open circles LSBGs of sample B.
Bulge (left) and disk (right) central surface magnitudes as function of the respective scale lengths in kiloparsecs. Filled circles indicate LSBGs with log (sample A), and open circles log (sample B).
Bulge (left) and disk (right) central surface brightness as a function of the HI mass. Note the large dispersion for a given HI mass.
Absolute magnitude as a function of HI mass. Left panel is for and right panel for . Diagonal lines represent constant gas fractions. Log(MHI/L) = 0.01 for long-dashed line, 0.1 for solid line, 1.0 for dotted line, and 10.0 for dashed line.
and absolute magnitudes as a function of the logarithmic gas fraction. The straight lines represent least square fits, giving a slope of for and for .
images of low surface brightness galaxies included in this paper, sorted by the gas fraction MHI/L. Galaxy 036 has a value MHI/L = 0.028, and galaxy 437 MHI/L = 0.128. Most of these LSBGs fall rather well in the Hubble sequence and most of them present clearly a bulge in near-IR passbands. Figure under request.
images of low surface brightness galaxies included in this paper, sorted by the gas fraction MHI/L. Galaxy 225 has a value MHI/L = 0.129, and galaxy 446 MHI/L = 1.475. Most of these LSBGs are Irr types, but some of them are difficult to classify following the Hubble sequence. Most of these LSBGs do not present a bulge in the near-IR passbands. Figure under request.
HI-to-stellar mass ratio and color as a function of the computed stellar mass, which has been computed using results of Bell and de Jong (2001). See text for details and discussion. Diagonal lines represent constant gas mass dashed line for M M☉ ( close to our lowest HI mass), solid line for 9.0 M☉ (upper limit of our sample A), dotted line for 9.5 M☉ (lower limit for our sample B), and long-dashed line for 10.0 M☉ (close to our largest HI mass).
The ratio MHI/Mbaryonic as a function of the baryonic mass (HI mass + stellar mass). Diagonal lines represent constant HI content, as indicated in Figure Properties of Low Surface Brightness Galaxies and Normal Spirals in the Near-IR. Dotted boxes indicate the locus of gas and star dominated LSBGs.
Gas-to-stars mass fraction as a function of the bulge surface brightness. The labels indicate the locus where gas and star dominates and the their bulge brightness. The cutoff at mag arcsec-2 represent the surface magnitude limit where galaxies become to be either gas or star dominated. See text for discussion.
The color and gas to baryonic mass ratio as a function of the bulge stellar surface density (measured in solar masses per sqr-parsec). The dashed lines represent linear fittings: and . The correlation coefficient is 0.22 and 0.15 in the upper and lower panel, respectively.
Color grid for the index as a function of the index, for different stellar formation rates and metallicities. Metallicities range from 0.005Z☉ to 2.5Z☉. Top labels denote different exponential star-formation rates, where denotes a constant star-formation rate. Bottom labels denote mean ages in Gyr. The star-formation started 12 Gyr ago for all bursts.
Near-IR (left) and (right) color-magnitude diagrams for LSBGs presented in this paper. Filled circles indicate galaxies with log (sample A), and open circles galaxies with log (sample B).
colors as a function of the HI mass. There is a clear positive trend in the sense of larger MHI having redder . This trend is not observed in optical colors, as discussed in the text.
Computed stellar and baryonic masses as a function of the color . Straight lines represent linear fittings. Both slopes are very similar, being for the stellar masses (solid line), and for baryonic masses (dashed line).
Gas-to-baryonic mass fraction as a function of the color and absolute magnitude. Note that color become redder for smaller values of MHI/Mbaryonic. Dotted lines enclose the locus of star and HI dominated LSBGs. The scatter could reflect a star formation process using fresh HI during the evolution to redder colors, and so larger metallicity. See text for discussion.
color as a function of the gas fraction computed in the and bands.