2002 \SetConfTitleGalaxy Evolution: Theory and Observations \suppressfulladdresses
Interpreting Offsets from the Tully-Fisher Relation
We have previously demonstrated that Tully-Fisher (TF) residuals correlate with tracers of star formation history (color and emission line equivalent width, EW) for a broad sample of Sa–Sd spiral galaxies (Kannappan, Fabricant, & Franx 2002, KFF). Here we use these correlations to study two other classes of galaxies: (1) galaxies in close pairs, and (2) galaxies at intermediate redshift.
In the close pairs sample of Barton et al. (2001), outliers from the TF relation and the color–TF residual relation can be independently identified based on their rotation curves (RCs): the outliers’ RCs nearly always show either strong asymmetry or severe radial truncation (Figure 1). Such RC abnormalities can affect velocity widths, making it difficult to interpret TF residuals simply in terms of luminosity offsets (star formation). However, if we eliminate the problem galaxies, we find a color–TF residual relation with a slope similar to the slope defined by the Sa–Sd sample of KFF (drawn from the Nearby Field Galaxy Survey, NFGS, Jansen et al. 2000). The close pairs relation extends further into the blue, reflecting recent interactions.

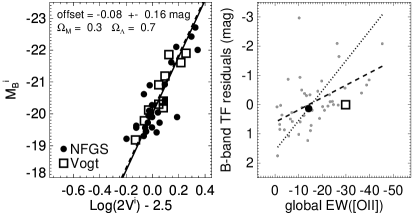
The intermediate- sample of Vogt et al. (1997) represents undisturbed spiral galaxies brighter than M = 19. Defining a similar subsample within the NFGS and standardizing our analysis methods between samples, we find no significant TF zero point evolution from 0.5 to =0 (Figure 2a). However, the emission-line EWs in the Vogt sample are generally much higher than in the NFGS, due to a combination of real evolution and detection bias in emission-line fluxes. Figure 2b shows that in the mean, the Vogt galaxies deviate significantly from the =0 EW–TF residual relation, in the sense that for their EWs, they ought to have a brighter TF zero point. The same effect is seen in the color–TF residual relation. Effectively, the Vogt galaxies are underluminous for their star formation properties. This result suggests that we may be seeing a decrease in stellar mass fraction with lookback time, as less of the gas has had time to form stars.
References
- [1] Barton, Geller, Bromley, van Zee, & Kenyon. 2001, AJ, 121, 625
- [2] Jansen, Franx, Fabricant, & Caldwell. 2000, ApJS, 126, 271
- [3] Kannappan, Fabricant, & Franx. 2002, AJ, 123, 2358
- [4] Vogt, Phillips, Faber, Gallego, Gronwall, Guzman, Illingworth, Koo, & Lowenthal. 1997, ApJ, 479, L121