Discovery of High-Latitude CO in a HI Supershell in NGC 5775
Abstract
We report the discovery of very high latitude molecular gas in the edge-on spiral galaxy, NGC 5775. Emission from both the J=1-0 and 2-1 lines of 12CO is detected up to 4.8 kpc away from the mid-plane of the galaxy. NGC 5775 is known to host a number of HI supershells. The association of the molecular gas (M = 3.1107 M☉) reported here with one of the HI supershells (labeled F2) is clear, which suggests that molecular gas may have survived the process which originally formed the supershell. Alternatively, part of the gas could have been formed in situ at high latitude from shock-compression of pre-existing HI gas. The CO J=2-1/J=1-0 line ratio of 0.3440% is significantly lower than unity, which suggests that the gas is excited subthermally, with gas density a few 102 cm-3. The molecular gas is likely in the form of cloudlets which are confined by magnetic and cosmic rays pressure. The potential energy of the gas at high latitude is found to be 2 1056 ergs and the total (HI + H2) kinetic energy is 9 1053 ergs. Based on the energetics of the supershell, we suggest that most of the energy in the supershell is in the form of potential energy and that the supershell is on the verge of falling and returning the gas to the disk of the galaxy.
1 Introduction
Galactic HI shells and supershells, distinguished by whether their initial energy requirement is less or more than 1053 ergs, were first studied by Heiles (1979, 1984). The large energies found in the supershells ( 1053 ergs) imply that these structures must have a tremendous influence on the structure of the interstellar medium. In addition, supershells that break through the gaseous disk to reach high galactic latitudes may be a source of star formation in the halo. For example, supershells may act as ”chimneys” through which hot gas from the disk funnels to the halo (e.g., the ”chimney model”, Norman & Ikeuchi, 1989). This hot gas may cool and eventually form stars in the halo. Alternatively, the molecular gas in the supershell may reach high-latitude and directly provide raw material for star formation in the halo. Although which of these two scenarios is at work cannot be distinguished easily, the study of molecular gas in supershells still provides an important clue to high-latitude star formation. Molecular gas at high latitude also presents an important aspect in the understanding of the global evolution of the interstellar medium in spiral galaxies. In the Milky Way Galaxy, the study of supershells is hindered by difficulties with distance determination and the resulting confusion. In external galaxies, these problems are minimized.
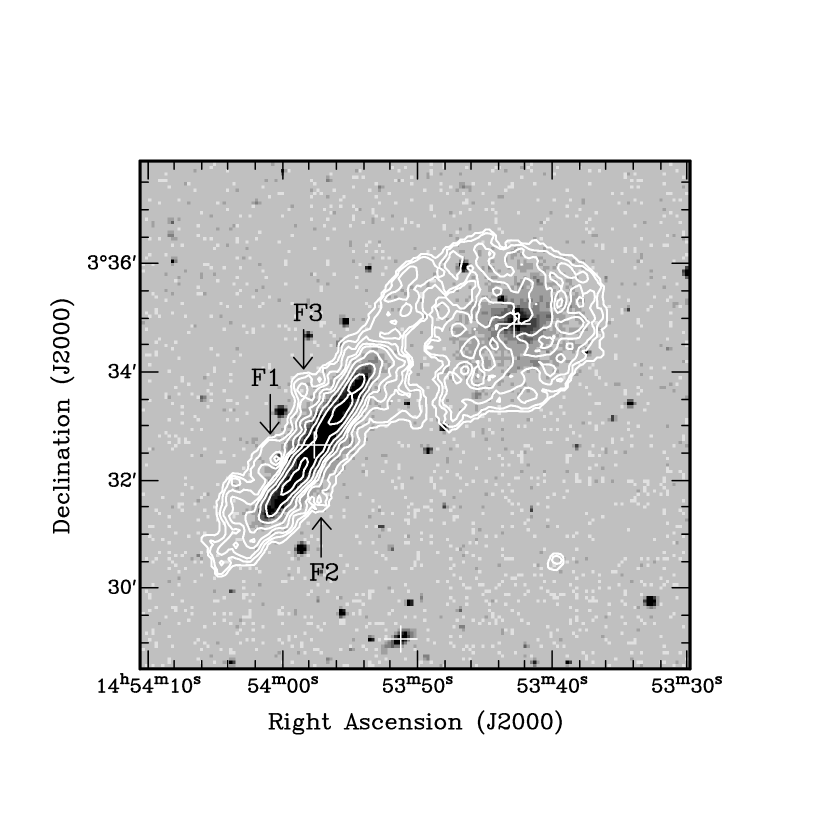
NGC 5775 is an edge-on ( = 86°), infrared-bright (LFIR = 2.61010 L☉) galaxy at a distance of 24.8 Mpc. Irwin (1994) observed this galaxy and its face-on neighbour NGC 5774 in HI using the VLA and provided models for their HI distributions. She showed that the two galaxies may be engaging in an early phase of interaction, with two HI bridges connecting them. Numerous HI arcs and extensions beyond the disk of NGC 5775 are also observed. Six HI supershells were cataloged by Lee (1998). In a multi-wavelength study of NGC 5775, Lee et al. (2001) report spatial correlations of HI, radio continuum, X-rays and far-infrared emission at the positions of the three largest HI supershells, labeled F1 through F3 in Fig. 1.
2 Observations
Observations were performed with the IRAM 30m telescope 111The Institut de RadioAstronomie Millimétrique (IRAM) is cofunded by the Centre National de la Recherche Scientifique, France (CNRS), the Max Planck Gesellschaft, Germany (MPG), and the Instituto Geográfico Nacional, Spain (IGN). on 2000 October, 2001 April and November. The CO J=1-0 line at 115 GHz and J=2-1 line at 230 GHz were observed simultaneously using two dual mixers tuned in single sideband mode. The observations were done in “wobbler” switching mode with a wobbler throw of 240″, resulting in very flat baselines. Relevant observing and spectral parameters are listed in Table 1. Data reduction was carried out using the GILDAS software package. Gaussian fits were obtained in order to find the peak antenna temperatures, central velocities, full-width-half-maximums (FWHMs) and the integrated intensities of the lines. For clarity of presentation, we define the x and y directions to be parallel and perpendicular to the galaxy’s major axis, respectively. All offsets are given in the form (x-offset,y-offset) in units of arcseconds, where the offsets are measured with respect to the observed centre at (J2000) = 14h53m577, (J2000) = 3°32′400. Note that x-offset0 represents the eastward direction and y-offset0 represents the northward direction.
| Parameter | 115 GHz | 230 GHz |
|---|---|---|
| TsysaaTypical system temperature. (K) | 250 | 350 |
| HPBWbbHalf-power-beamwidth. (″) | 21 | 11 |
| BeffccMain beam efficiency. | 0.75 | 0.52 |
| FeffddForward efficiency. | 0.95 | 0.91 |
| Channel Width (kms-1) | 26 | 21 |
| Spectra rms (mK) | 2 | 3 |
3 Results
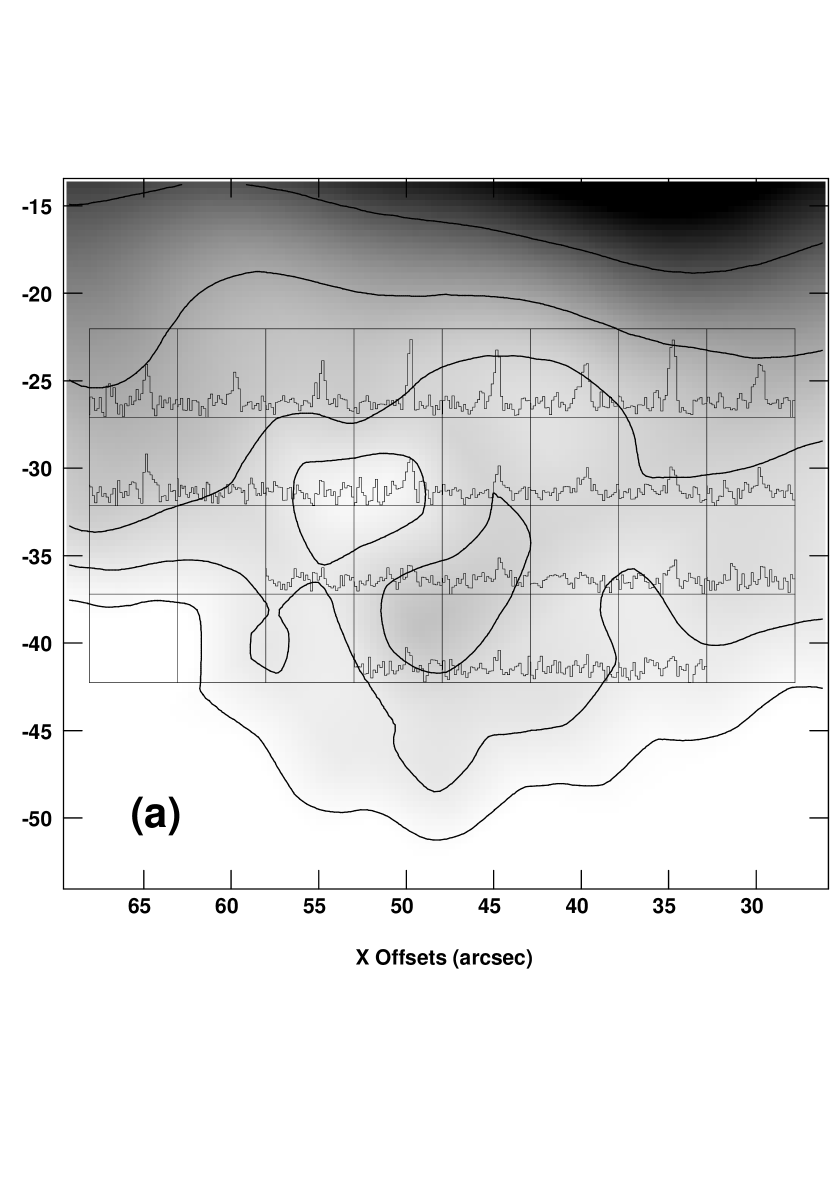
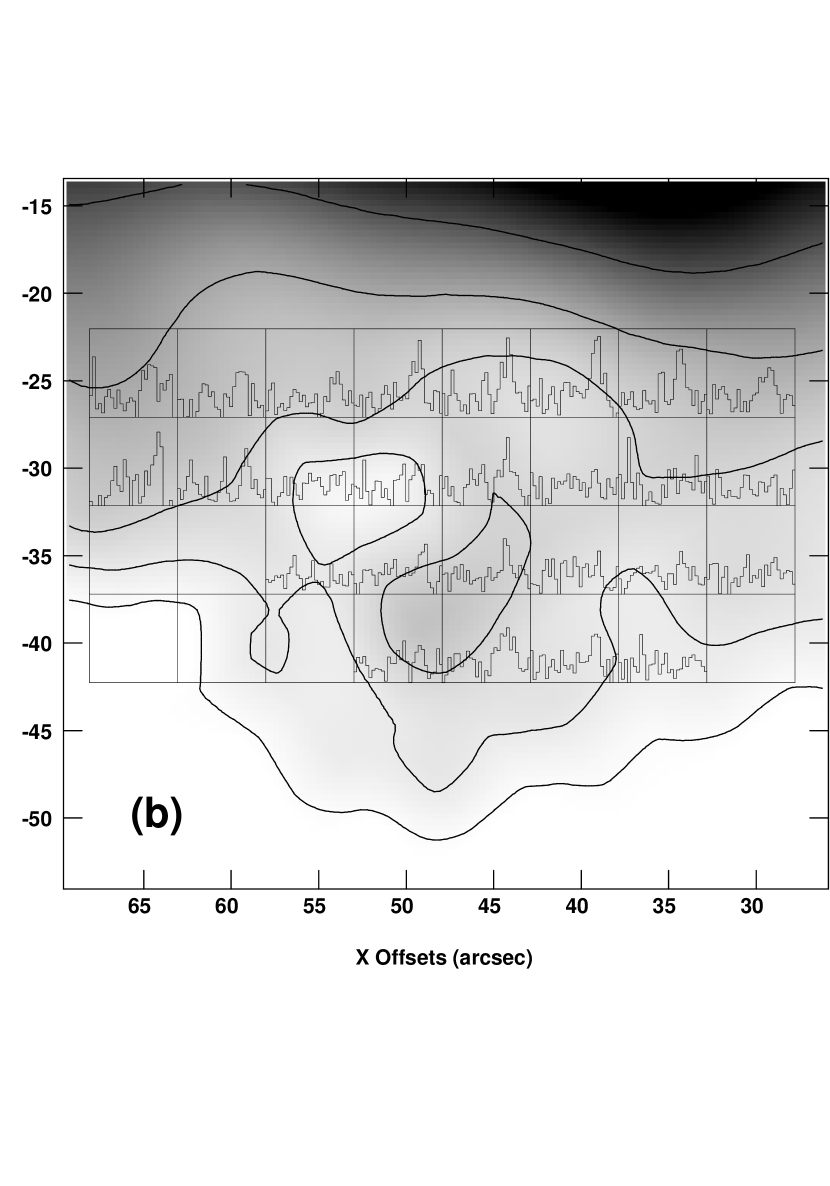
We initially searched for CO emission at a few selected positions in all three HI supershells (see Fig. 1). Although all three showed tentative detections, the spectral lines at F2 are the most obvious. We therefore proceed to map the CO emission in F2. The observed 12CO J=1-0 and J=2-1 spectra are presented in Fig. 2, superimposed on the HI total intensity map. Emission from both CO transitions is detected up to 40 (4.8 kpc) away from the mid-plane of the galaxy. Within the region (35,-25) to (60,-40), roughly the size of the CO J=1-0 beam, the average peak values of TMB for CO J = 1-0 and 2-1 are about 13 mK (3.2 sigma) and 13.5 mK (2.3 sigma), respectively. The fact that there is an absence of CO emission near the HI “hole” at the offset of (55,-30) (see Fig. 2) suggests that the molecular gas mimics the shell-like distribution of the HI feature F2.
Emission from a flared or warped disk may resemble gas at high-latitude when seen in projection. However, in such a case the line-of-sight central velocity of the emission line, which presumably originates from the outer part of the disk, would be much closer to the systemic velocity of the galaxy. We therefore compare the average central velocity and average FWHM of all CO 1-0 spectra in F2 to a spectrum along the major axis. The average central velocity and average FWHM at F2 are 13119 kms-1 and 8323 kms-1, respectively. The uncertainties are the standard deviations of all the spectra and are both smaller than the velocity resolution. At (40,0) (spectrum not shown), the corresponding values are 126 kms-1 and 69 kms-1, respectively. The central velocities comparison shows that the gas in F2 shares the same circular velocity as the major axis gas at the same galactocentric distance and does not originate from the outer disk. The narrow line-widths support this, since gas from the outer disk would have wider spectra. Therefore, we conclude that the gas associated with F2 is indeed at high galactic latitude and not from a flared or warped disk. Detailed analysis of the kinematic structures of the galaxy and the supershell will be forthcoming.
In order to study the molecular gas that truly belongs to the supershell at high latitude, we have to eliminate the contribution of CO from the disk. We assume that the vertical CO distribution of the galaxy can be represented by a single gaussian which peaks at the mid-plane, and that the emission from the supershell at high latitude is superimposed on the wing of the gaussian. The emission from the supershell can then be isolated by subtracting the gaussian model from the observed data. To fit the gaussian, we average the CO integrated intensity map from x-offsets = 30″ to 65″, to increase the signal-to-noise. A gaussian was fitted from y-offset = +20″ to -20″ (hence does not include the high-latitude emission). The results of the fits are good, the residuals being less than 5% of the peak values in both transitions. At the centre of the supershell (y-offset = -32.5″) , the difference in integrated intensities between the data and the model gives the CO emission from the supershell alone. The total (disk contribution plus supershell contribution) integrated intensities within a 21″ beam at the centre of F2 are 1.28 and 1.05 K-kms-1 for the 1-0 and 2-1 transitions, respectively, where the temperatures are in the TMB scale. The uncertainties in these values, taking into account noise, calibration and baseline errors, are about 30%. For proper comparison, the CO J = 2-1 data were smoothed to the resolution of the 1-0 data. After subtracting the disk contribution, the CO 1-0 and 2-1 integrated intensities are given by I10 = 0.89 K-kms-1 and I21 = 0.30 K-kms-1, respectively. The line ratio of the two transitions, I21/I10, is therefore 0.3440%.
For comparison, we obtained the line ratio at mid-plane corresponding to the same galactocentric radius of F2. We use our JCMT CO J = 2-1 integrated intensity (= 17.420% K-kms-1) at the position equivalent to (40,0) (Lee, 1998), and the IRAM 30m CO J = 1-0 integrated intensity (= 20.220% K-kms-1) at the same position. The JCMT beam has the same HPBW as the IRAM 30m beam at these frequencies. The resultant line ratio at the mid-plane is 0.8630%.
The total molecular gas mass in F2 (excluding the disk contribution), obtained using the CO J=1-0 integrated intensity, is found to be M = 3.1107 M☉ within the 21″ beam ( 2.5 kpc in diameter), assuming a CO-H2 conversion factor of 31020 cmK-kms-1 (Young & Scoville, 1991). Since the CO and the HI distributions within F2 agree fairly well, we have probably detected most of the CO emission in the supershell (see Fig. 2).
We have also obtained the HI integrated intensity within a 21″-beam at F2 following the same procedure outlined above. The HI data have been published in Irwin (1994) and in Lee et al. (2001). The HI integrated intensity, after subtracting the disk contribution, is 0.11 Jy/beamkms-1 and the corresponding HI mass is MHI,F2 = 1.6107 M☉, or 50% of M. The total gas mass (HI + H2) in F2 is therefore 4.7107 M☉.
4 Discussion
This paper reports the highest latitude (4.8 kpc) molecular gas detected to date in any galaxy. In our own Galaxy, high-latitude molecular clouds are found in association with the HI shells around two OB associations, the Per OB3 and the Sco OB2 associations (Bhatt, 2000); and in association with a hot bubble between Cepheus and Cassiopeia (Grenier et al., 1989). There are only a few examples of detections of discrete extraplanar molecular gas in external galaxies. In NGC 891, a molecular spur extending to 0.5 kpc above the mid-plane was detected by Handa et al. (1992). Possible formation mechanisms considered for this structure include ejection by a superbubble or the buoyancy force on the gas due to Parker instability. Recently, molecular gas up to 3 kpc above the mid-plane was discovered in the molecular outflow in M 82 (CO detection by Taylor, Walter, & Yun (2001); SiO detection by García-Burillo et al. (2001)). Many of these examples of discrete high-latitude molecular gas are thought to be related to star formation activities in the disk such as stellar wind or supernovae swept-up shells. At the highest latitudes, the molecular gas may represent the component of the shells that broke through the thin disk to reach the halo.
4.1 The Physical Conditions in the Supershell
The line ratio (0.3440%) for the extraplanar gas obtained is significantly lower than the corresponding ratio at the mid-plane. Even taking into account the uncertainty, its highest possible value is less than 0.5. Assuming that the gas is thermalized so that the excitation temperature of all rotational levels is the same, the interpretation of such a low line ratio is that the excitation temperature is low (T 5 K). Although no estimate of the gas or dust temperature in the supershell is currently known, the possibility of shocks, deduced from the trend of radio continuum spectral indices (see Lee et al., 2001), suggests that the gas kinetic temperature may be 5 K due to shock heating. In this case, the gas density must be low ( a few hundred particles per cm3) so that thermalization does not occur. Using a Large Velocity Gradient (LVG) analysis, we find that such a low line ratio is consistent with a gas density n cm-3, although we cannot constrain the gas kinetic temperature. It is noted that the line ratio is expected to be closer to one in shock regions due to the elevated gas kinetic temperature, which tends to populate the upper rotational levels. Better constraints of the physical parameters will have to await data of higher CO transitions.
Given the gas density and gas mass within the 21″ beam, the filling factor of the molecular gas is of order 10-3. That is, the molecular gas must be in the form of small cloudlets. We can estimate whether these cloudlets are in pressure equilibrium with the surrounding environment. The ambient pressure surrounding the cloudlets comes from the magnetic pressure (Pm), cosmic rays pressure (PCR), and the gas pressure. The first two are equal in the case of energy equipartition and are both given by B2/8, where B 3 G is the equipartition magnetic field (Duric, Irwin & Bloemen, 1998). The gas pressure is the combined ionized (Pi) and neutral gas pressure (PHI), each given by P = nkT, where n is the gas number density, k is the Boltzmann constant and T is the kinetic temperature of the gas. We assume the ionized gas is at T = 104 K and the electron density n = 910-4 cm-3 at 4 kpc above midplane (from the electron density distribution given in (Collins et al., 2000)). For the HI gas we use T = 8000 K and density nHI = 210-3 cm-3 at 4 kpc above midplane (from the vertical density distribution given in Irwin (1994)). From these values, we obtain Pm PCR 410-13 erg cm-3, Pi = 210-15 erg cm-3, and PHI = 210-15 erg cm-3. The averaged internal pressure of the molecular gas is Pcloud = 110-12 erg cm-3, using parameters given in the previous paragraph. It seems that the magnetic and cosmic rays pressure combined is sufficient to confine the clouds without internal gravitation.
4.2 Origin of Molecular Gas at High Latitude
Observations of molecular gas at high-latitude are interesting in that they may explain high-latitude star formation. The key question is: how does the molecular gas reach such high latitude? Two possibilities may be considered. First, the molecular gas was formed in the disk and was ejected by the outflow that formed the HI supershell; and second, the molecular gas was formed at high-latitude. Of course, a combination of these is also possible.
The gravitational potential energy (EPE) of a cloud at a height, z, above the galactic plane is calculated by solving the Poisson equation for a disk flattened in one-dimension. We have assumed the galactic value for the stellar scale height and the solar neighbourhood value for the stellar mass density at mid-plane (325 pc and 0.175 M☉pc-3, respectively, from Freeman (1987)) since the corresponding values for NGC 5775 are not known. Including both HI and H2 gas, EPE = 21056 ergs in F2. Note that EPE scales as the square of the stellar scale height so that if the scale height of NGC 5775 is twice that of the Milky Way, EPE will increase by a factor of 4. We estimate the total kinetic energy (EKE) of the gas (HI + H2) to be EKE = 91053 ergs. This includes the kinetic energy from the HI gas in F2, which is found to be 61053 ergs, using MHI,F2 calculated above and assuming the expansion velocity is 62.5 kms-1 (Lee et al., 2001); and the kinetic energy from the H2 gas, which is found to be 41053 ergs. The expansion velocity of the H2 gas is taken to be half the averaged FWHM of all the CO J=1-0 spectra (see § 3) in F2 minus, in quadrature, the expected linewidth from differential rotation within the beam (44 kms-1) and the channel width (26 kms-1), and is equal to 32.5 kms-1. The predicted differential rotation within the beam is calculated using the HI rotation curve model given in Irwin (1994). Assuming that the supershell expands isotropically (a fair assumption based on the near circular morphology of F2), then the line-of-sight expansion velocity observed is a good estimate of the true expansion velocity of the supershell. Therefore, EKE of the supershell is more than two orders of magnitude lower than EPE. The large difference in EPE and EKE suggests that the supershell is being observed at a time when it is about to fall back to the disk so that most of the energy is in the form of potential energy. We can therefore visualize an explosion at the mid-plane that created an expanding bubble of hot gas. In the process, neutral gas (atomic and molecular) is entrained in the ejecta, forming the supershell, reaching large z-height. Under the influence of the gravitational potential, the supershell is now about to plunge back, returning the gas to the star-forming disk. Such a recycling process has been proposed in the galactic fountain model (Bregman, 1980).
Another possibility for the molecular gas to exist at high latitude is that H2 gas can be formed in situ via shock-compression (e.g., Magnani, 1987; Elmegreen, 1988), occurring within HI pre-existing in this region. The effect of a strong shock propagating through the interstellar medium is that dense molecular cloudlets can form due to thermal instability in the shock regions (Koyama & Inutsuka, 2000). The existence of H emission (possibly due to shock-ionization, see Lee et al., 2001) in F2 suggests that at least some of the molecular gas may be formed this way. It is more difficult to explain how the HI come to reside at high-latitude, in view of the large mechanical energy required (equals to EPE). Various mechanisms have been examined in Lee et al. (2001), including supernova explosions and cloud impacts. In any case, this material would likely have originated within NGC 5775 since the mean radial velocity agrees with the orbital velocity of the disk. Finally, assuming typical Galactic dust-to-gas ratio, the high-latitude molecular clouds could be emitting substantial infrared radiation and has indeed been observed at 850m (Brar et al., private communication).
5 Conclusions
This paper reports the detection of high-latitude molecular gas in NGC 5775. The shell-like distribution of the CO emission coincides exactly with that of the HI supershells, suggesting that we have detected the molecular shell associated with the HI supershell. The existence of the molecular shell means that molecules are not destroyed during the ejection of the supershell and is entrained in the expanding flow to reach high latitude. Some of the molecular gas may have been formed in situ, via shock-compression of pre-existing HI gas. The CO J=2-1/1-0 line ratio (0.3440%) suggests that the gas density in the supershell is low and the gas is subthermally excited. The molecular gas is probably in the form of cloudlets which are confined by magnetic and cosmic rays pressure. Based on energetics ground, we proposed that the supershell may be at a stage where it is about to plunge towards the disk of the galaxy, returning the gas to the bulk of the gas reservoir of the galaxy.
References
- Bhatt (2000) Bhatt, H. C. 2000, A&A, 362, 715
- Bregman (1980) Bregman, J. N. 1980, ApJ, 236, 577
- Collins et al. (2000) Collins, J. A., Rand, R. J., Duric, N., & Walterbos, A. M. 2000, ApJ, 536, 645
- Duric, Irwin & Bloemen (1998) Duric, N., Irwin, J. A., & Bloemen, H. 1998, A&A, 331, 428
- Elmegreen (1988) Elmegreen, B. G. 1988, ApJ, 326, 616
- Freeman (1987) Freeman, K. C. 1987, ARA&A, 25, 603
- García-Burillo et al. (2001) García-Burillo, S., Martín-Pintado, J, Fuente, A., and Neri, R. 2001, ApJ, 563, L27
- Grenier et al. (1989) Grenier, I. A., Lebrun, F., Arnaud, M., Dame, T. M., and Thaddeus, P. 1989, ApJ, 347, 231
- Handa et al. (1992) Handa, T., Sofue, Y., Ikeuchi, S., Kawabe, R., and Ishizuki, S. 1992, PASJ, 44, L227
- Heiles (1979) Heiles, C., 1979, ApJ, 229, 533
- Heiles (1984) Heiles, C., 1984, ApJS, 55, 585
- Irwin (1994) Irwin, J. A. 1994, ApJ, 429, 618
- Koyama & Inutsuka (2000) Koyama, H., & Inutsuka, S.-I. 2000, ApJ, 532, 980
- Lee (1998) Lee, S.-W. 1998, Ph.D. Thesis, Queen’s University
- Lee et al. (2001) Lee, S.-W., Irwin, J. A., Dettmar, R.-J., Cunningham, C. T., Golla, G., and Wang, Q. D. 2001, A&A, 377, 759
- Magnani (1987) Magnani, L. 1987, Ph.D. Thesis, University of Maryland
- Norman & Ikeuchi (1989) Norman, C. A., & Ikeuchi, S. 1989, ApJ, 345, 372
- Taylor, Walter, & Yun (2001) Taylor, C. L., Walter, F., & Yun, M. S. 2001, ApJ, 562, L43
- Young & Scoville (1991) Young, J. S., & Scoville, N. Z. 1991, ARA&A, 29, 581