Time delay and lens redshift for the doubly imaged BAL quasar SBS 1520+530††thanks: Based on observations made with the Nordic Optical, operated on the island of La Palma jointly by Denmark, Finland, Iceland, Norway, and Sweden, in the Spanish Observatorio del Roque de los Muchachos of the Instituto de Astrofisica de Canarias and the W. M. Keck Observatory which is operated jointly by the California Institute of Technology, the University of California and the National Aeronautics and Space Administration.
We present optical -band light curves of the gravitationally lensed quasar SBS1520+530 derived from data obtained at the Nordic Optical Telescope. A time delay of days (1) is determined from the light curves. In addition, spectra of SBS1520+530 obtained at the Keck Observatory are spatially deconvolved in order to extract the spectrum of the faint lensing galaxy, free of any contamination by the light from the bright quasar images. This spectrum indicates a lens redshift , in agreement with one of the absorption systems found in the quasar spectra. The best mass model of the system includes a second nearby galaxy and a cluster of galaxies in addition to the main lensing galaxy. Adopting this model and an , cosmology, our time-delay measurement yields a Hubble constant of H (1 error).
Key Words.:
Gravitational lensing – quasars: individual: SBS1520+530 – cosmological parameters1 Introduction
Prompted by the successful optical measurements of time delays in PG 1115+080 (Schechter et al. Sche (1997)), a photometric monitoring campaign of gravitationally lensed quasars has been carried out at the Nordic Optical Telescope (NOT) with the aim of measuring time delays for many gravitationally lensed quasars. This observable is of crucial importance to study the mass distribution in lensing galaxies and to determine using the method proposed by Refsdal (1964).
Two time delays have been measured so far at the NOT: one for the doubly imaged quasar B 1600+434, lensed by an edge-on spiral (Burud et al. Burud (2000)) and another for the two (summed) components RX J0911+0550 (Hjorth et al. Hjorth (2002)). In this paper we will present our third time delay measurement: that of SBS1520+530, a doubly imaged BAL quasar at . SBS 1520+530 was discovered by Chavushyan et al. (Chavushyan (1997)) as a double quasar with angular separation of 1.56″. The lensing galaxy was detected by Crampton et al.(Crampton (1998)) on -band images obtained by using the adaptive optics system of the Canada-France-Hawaii Telescope. The lensing galaxy is also well resolved on optical images obtained at the NOT and deconvolved using the MCS deconvolution algorithm (Magain, Courbin & Sohy Magain (1998)), and on public Hubble Space Telescope near-IR data (Faure et al. Faure (2002)). The redshift of the galaxy however, remains unknown. With the aim of measuring this redshift, we have obtained a spectrum of SBS 1520+530 with ESI at the Keck observatory.
The observations and data reduction of the images are presented in Sect. 2 and 3. The time delay measurement is described in Sect. 4 while the analysis of the spectroscopic data is explained in Sect. 5. This section also includes a discussion on the spectral differences between the two quasar images. Mass models and the estimate of the Hubble constant are discussed in Sect. 6. Finally, Sect. 7 summarises the main results.
2 Observations and Data Reduction
Weekly observations of SBS 1520+530 were carried out at the NOT from February 1999 to May 2001. The detector ALFOSC (AndaLucía Faint Object SpeCtrograph and Camera) with a pixel size of 0188 was used for 95% of the frames obtained. The remaining 5% were obtained with HiRAC (High Resolution Adaptive Camera) or with the stand-by camera StanCam which have pixel sizes of 0107 and 0176 respectively.
The target is relatively bright (I18) and an exposure time of 300 sec in the -band was sufficient to obtain a S/N100 for each quasar image. The seeing varied from 05 to 22 during the two years of observations, 10 being the most frequent value.
Our automated pipeline employing routines in the IRAF/NOAO/CCDRED package was used in order to pre-process the CCD frames in an efficient and homogeneous way.
3 Photometry
The photometry of the blended quasar images was performed by applying the MCS deconvolution algorithm (Magain, Courbin & Sohy Magain (1998)). This algorithm has already been successfully applied to several monitoring data of lensed quasars (e.g., Burud et al. Burud (2000), Burud et al. Burudb (2002)). Its main advantage is its ability to deconvolve all the frames from different epochs simultaneously, hence constraining the astrometry of the two quasar images and the shape of the lensing galaxy using the total S/N of the whole data-set. The intensity of the point sources are allowed to vary from image to image, which produces the light curves.
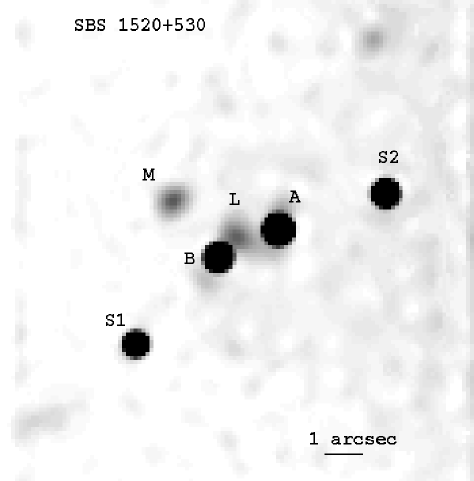
The two quasar components are clearly distinguished on our deconvolved image of SBS1520+530 (see Fig. 1), and the lensing galaxy is resolved. The lensing galaxy can easily be taken into account in order to avoid contamination of the photometry of the quasar images.
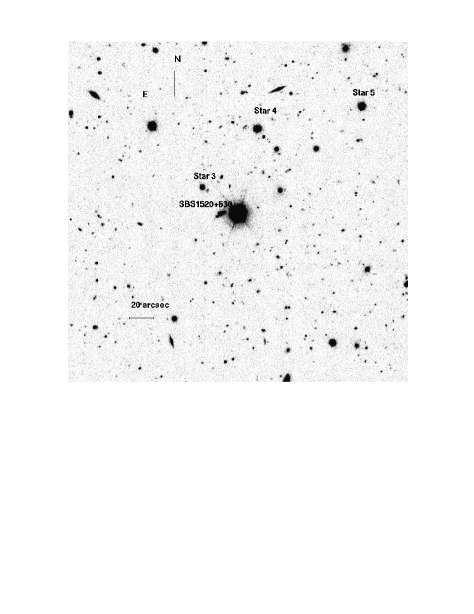
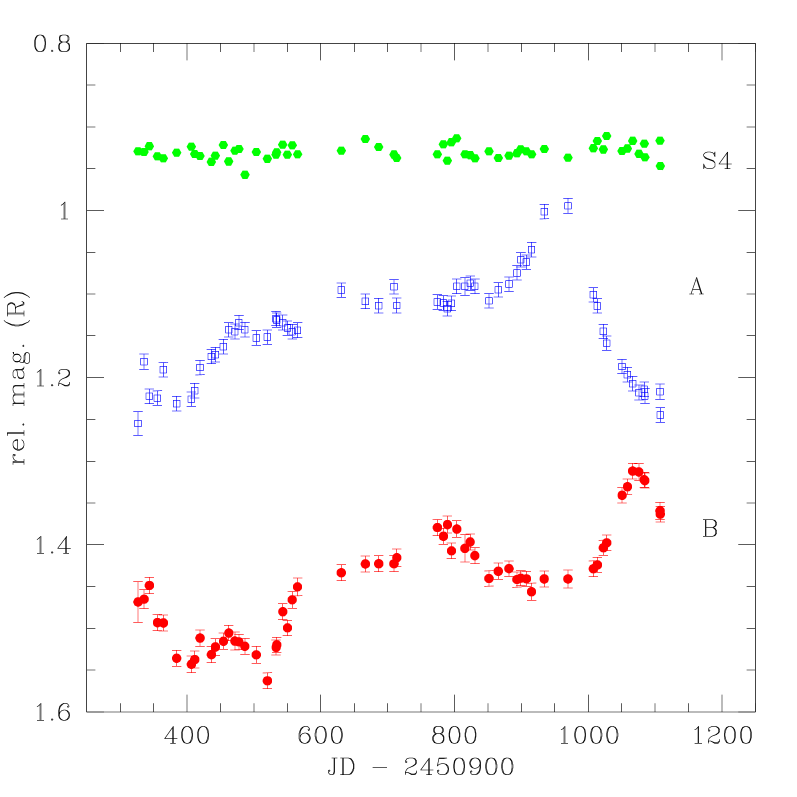
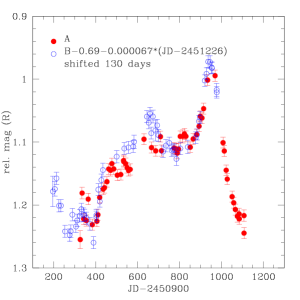
The light curves of SBS1520+530 consist of 57 data points in the -band as presented in Fig. 3 and Table 2. In addition to the two stars just to the South-East (S1) and North-West (S2) of the quasar (Fig. 1), three other reference stars in the field were deconvolved, in order to check the relative photometry and to check for systematic errors (stars 3 to 5 in Fig. 2). The magnitudes of the quasar are relative to the magnitudes of Star 3 on Fig. 3. The error-bars include both photon noise and additional systematic errors, e.g., PSF errors. The latter is estimated by using the reference stars, as explained in Burud et al. (Burud (2000)).
4 Time delay measurement
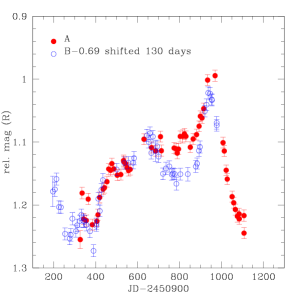
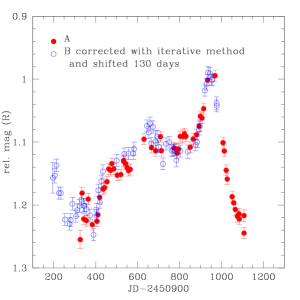
By sliding the light curves across one another one can derive a rough time delay estimate of 125 days. As predicted by gravitational lens theory, the brightest quasar image A is the leading component. Using the minimization method described in Burud et al. (Burudc (2001)), a time delay value of (1) days is found from the -band light curves. The magnitude difference between the A and the B component is mag, corresponding to an A/B flux ratio of . The error bar on the time delay is obtained from Monte Carlo simulations of 1000 sets of light curves, assuming that the photometric errors are uncorrelated and follow a Gaussian distribution. The best -fit is obtained when a linear term, modelling slow microlensing effects, is added to one of the components. The slope of this term is determined by the algorithm. With this external variation, the shifted light curve of the B component plotted in Fig. 4 becomes . The linear correction does not remove all the external variations. Faster variations on time scales of days are still present. The iterative version of the algorithm (Burud et al. Burudc (2001)) was also applied in an attempt to correct for these fast variations. This method yields days, slightly higher than the value found with the direct method but still in agreement within the error bars. Even with the iterative method some of the fastest variations are not corrected for (Fig. 4), notably the small peak in the A component at JD 2451750 (abscissa 850 in Fig. 4).
5 Spectroscopy of SBS1520+530
5.1 Keck II spectroscopy
Converting the time delay into an estimate of the Hubble parameter requires good knowledge of the geometry of the lensing system, including the redshift of the source and of the lensing galaxy. For this purpose, we obtained a deep optical spectrum of SBS1520+530 with the Keck II Telescope and the Echellette Spectrograph and Imager (ESI) (Sheinis et al. sheinis (2000)). The observations were obtained on May 23, 2001 under good seeing conditions (0.6″). The 1″ slit was aligned to obtain simultaneously the spectrum of SBS1520+530 and of star S2 (indicated on Fig. 1). Four 900s exposures were taken so that cosmic rays could be efficiently removed.


5.2 Redshift of the lensing galaxy
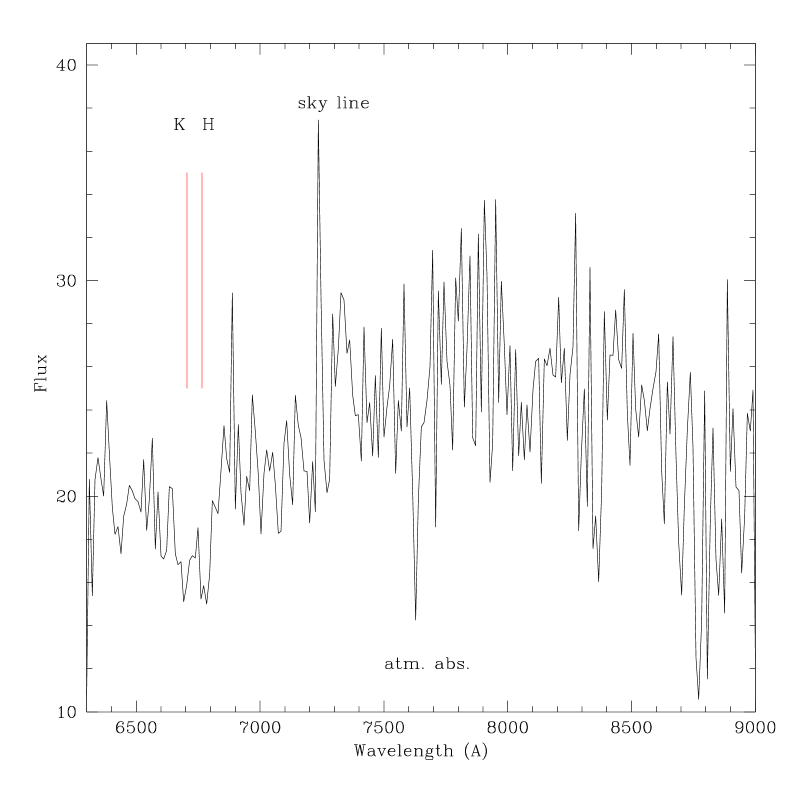
Using the spatial information contained in the spectrum of the PSF star S2, the 2D spectrum of SBS 1520+530 was spatially deconvolved, by applying the spectral version of the MCS deconvolution algorithm (Courbin et al., 2000b). The deconvolution process decomposes the data into the individual spectra of the two quasar images and of the faint lensing galaxy (see Figs. 5 and 6), as done for the lensed systems HE 21492745 (Burud et al. Burudb (2002)) or HE 11041805 (Lidman et al. lidman (2000)). No emission lines were detected in the spectrum of the lensing galaxy (Fig. 5). However, an absorption doublet is clearly observed at Å, matching within the error-bars the CaII H and K lines at redshift 0.71. This strongly supports a scenario where the lensing galaxy is responsible for the CaII absorption lines at redshift first found by Chavushyan et al. (Chavushyan (1997)) in the quasar spectra. Another absorption system was found by Chavushyan et al. (Chavushyan (1997)), at . This system does not seem to be associated with the lens.
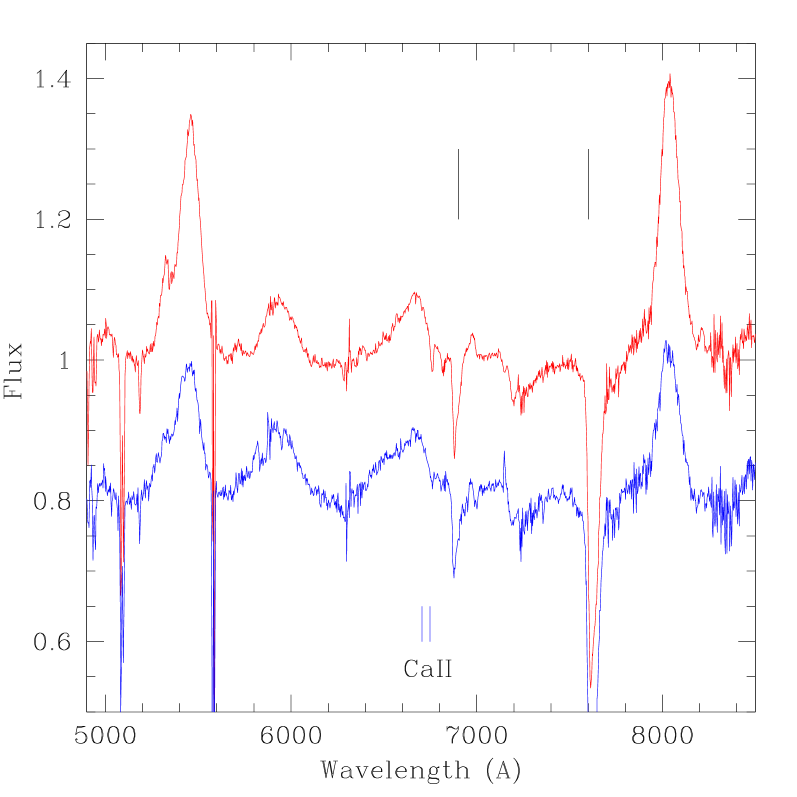
5.3 Spectra of the quasar components
The quasar spectra display the usual prominent emission lines such as AlIII/CIII] ( 1909 Å) and MgII ( 2798 Å), at redshift . Both (deconvolved) spectra show the metal absorption lines first reported by Chavushyan et al. (1997). These are the FeII ( 2587, 2600 Å), MgII ( 2798Å), MgI (2853 Å) absorption lines at redshifts and . CaII ( 3933, 3968 Å) is seen only at and is indicated on Fig. 6. It is better seen in the normalized spectra of Fig. 7.
The general shape of the spectra towards the blue wavelengths is most probably corrupted by atmospheric refraction. The observed reddening of B compared to A at the blue wavelengths may therefore not be real. In the red parts of the spectra, we find a flux ratio of 1.82 (at 9000 Å) which, compared with the ratio of 1.892 measured on band light curves ( 6500 Å), indicates an almost constant flux ratio in this wavelength range.
The continuum normalized spectra, displayed in Fig. 7, show that the equivalent widths of the emission lines are much larger in A than in B, suggesting that B’s continuum is amplified. Such a differential amplification can be explained by microlensing effects. Assuming that the lensed quasar follows the “standard” AGN model and that we are observing component B through a network of caustics produced by stars in the main lensing galaxy, one can imagine that the inner continuum region of component B is enhanced by a larger amount than the much larger emission line region. This interpretation has already been proposed to explain similar spectral differences observed in the double HE 11041805 (Wisotzki et al. wis (1993), Courbin et al. 2000b ) and HE 21492745 (Burud et al. Burudb (2002)).
6 Modelling the lens
The time delay measured for SBS 1520+530 can be used to infer an estimate of , via a model of the total gravitational potential responsible for the lensing effect. This model shall take into account the main lensing galaxy and a small galaxy cluster located to the North-West of the quasar.
Our models, already described in Faure et al. (Faure (2002)), assume that different mass components along the line of sight are Pseudo-Isothermal-Elliptical-Mass-Distribution (PIEMD, Kassiola & Kovner Kass (1993), Kneib et al. Kneib93 (1993), Kneib et al. Kneib96 (1996)). In addition to the observational constraints already available in Faure et al. (Faure (2002)), we now also try to pin down the flux ratio between the two quasar components, and to use it in the models. This ratio is difficult to estimate for SBS 1520+530: it varies with wavelength, it has different values in the continuum and in the emission lines, and even varies within the emission lines. Microlensing shall be blamed, but one should also keep in mind that our spectra were not taken at parallactic angle, with a relatively narrow slit, and at large airmass. The values we derive are therefore only tentative: mB - mA = 1.40 mag (i.e., ) in the emission lines, and mB - mA = 0.83 mag (i.e., ) in the continuum The latter value was measured from -band images (Faure et al. Faure (2002)).
Table 1 presents two lens models, computed for the two flux ratios, and matching a time-delay of 1303 days. Model (L) considers only the main lensing galaxy L (see 1) with a measured ellipticity and with a position angle (see Faure et al. 2002). Model (L+M+C) includes the main lensing galaxy (L), galaxy M, located at 2.6″ North-East from the quasar image A (see Fig. 1), and a galaxy cluster, centered at 1′ to the North-West of the quasar.
| MB-MA | 0.83 mag | 1.4 mag |
|---|---|---|
| L | no good fit | =228 km s-1 rcut(L)=13 kpc |
| 0.39 | ||
| 75.3 | ||
| H0 (1) | 63 9 km s-1Mpc-1 | |
| =189 km s-1 rcut(L)=51 kpc | =200 km s-1 rcut(L)=100 kpc | |
| L+M+C | =135 km s-1 rcut(M)=20 kpc | =118 km s-1 rcut(M)=40 kpc |
| =718 km s-1 rcut(C)=600 kpc | =400 km s-1 rcut(C)=600 kpc | |
| 0.32 | 0.34 | |
| 74.5 | 74.3 | |
| H0 (1 | 52 8 km s-1Mpc-1 | 50 8 km s-1Mpc-1 |
Modeling SBS 1520+530 is possible with a single lensing galaxy (i.e., galaxy L), only if mB - mA 1.15. Given the errors on the image flux ratio, such a model is plausible. Taking the emission line flux ratio (column 3 in Table 1) as the true one, because it is less affected by microlensing, we find H0 = 63. The error, once the image flux ratio is fixed, comes mainly from the position angle of the lens and its ellipticity.
If the magnitude difference between the images is less than 1.15, SBS 1520+530 can not be modeled by using one single galaxy. The model in column (2) of Table 1, with galaxy M and an intervening galaxy cluster gives 52 .
Finally, changing the flux ratio does not change much the value of H0, for a given lens model. The flux ratio is important in the choice of model (i.e., multiple or single lens) but does not alter much the fit once the model is given.
7 Discussion
The time delay days (1 ) has been measured for the first time, in the lensed quasar SBS 1520+530 on the basis of -band images obtained with the NOT. Keck spectroscopy of the lensing galaxy strongly suggests that the absorption system at is associated with the lensing galaxy.
Applying the detailed mass model presented by Faure et al. (Faure (2002)) we derive a mean value H. When only the main lensing galaxy is used in the mass model H0 increases to 63 . The fit of the wo different models depends on the flux ratio between the two images, the model with only one galaxy only gives a good fit when the high flux ratio measured from the emission lines is applied. Determining precisely the flux ratio is therefore crucial to further improve the modeling of the system and hence the precision on H0. Finally, a possible systematic error adds to the uncertainty in H0 if the central mass concentration is not isothermal.
External variations, probably due to microlensing effects, are observed on the time delay shifted light curves (Fig. 3). Part of this effect can be modeled as a linear term, or corrected for with the iterative algorithm for measuring time delays. However, significant external variations of time scales of 50 days do remain once these corrections are made.
Microlensing is important in SBS 1520+530 as suggested both by the high frequency variations in the light curves and by the spectra of the quasar images. With light curves in only one band we can not efficiently disentangle between microlensing and intrinsic variations of the quasar. Such a work shall be possible using the colour information provide by a monitoring of the object in spectroscopy. The issue in conducting such a spectrophotometric monitoring for SBS 1520+530 is double: (1) to measure the true flux ratio between the quasar images and discriminate between lens models and (2) to use microlensing to infer constraints on the distribution of micro-lenses in galaxy (L) and/or to reconstruct the energy profile of the central AGN in the source.
Acknowledgements.
We thank the NOT Director Vilppu Piirola for granting us observing time for this project on a flexible basis. We are especially grateful to the many visiting observers at NOT who have contributed to this project by performing the scheduled observations. This project was conceived in 1997 while JH and AOJ were visiting scientists at the Center for Advanced Study in Oslo. We thank Rolf Stabell and Sjur Refsdal for inviting us in their center and for their kind hospitality. JH appreciates the hospitality of the OMP where some of this work was conducted. The project was supported by the Danish Natural Science Research Council (SNF). IB was supported in part by contract ARC94/99-178 “Action de Recherche Concertée de la Communauté Française (Belgium)” and Pôle d’Attraction Interuniversitaire, P4/05 (SSTC, Belgium). FC acknowledges financial support through Chilean grant FONDECYT/3990024 and through Marie Curie grant MCFI-2001-0242. Additional support from the European Southern Observatory and ECOS/CONICYT CU00U05 grant is also gratefully acknowledged.References
- (1) Burud I., Hjorth J., Jaunsen A. O., et al., 2000 ApJ 544, 117
- (2) Burud I., Magain P., Sohy S. & Hjorth J. 2001, A&A, 360, 805
- (3) Burud I., Courbin. F., Magain, P. et al., 2002, A&A 383, 71
- (4) Chavushyan V. H., Vlasyuk V. V., Stepanian J. A. et al., 1997, A&A 318, L67
- (5) Crampton D., Schechter P. L., Beuzit J.-L., 1998, AJ 115, 1383
- (6) Courbin F., Magain P., Kirkove M., Sohy S. 2000a, ApJ, 539, 1136
- (7) Courbin F., Lidman C., Meylan G., Kneib J.-P., Magain P. 2000b, A&A, 360, 853
- (8) Faure C., Courbin F., Kneib J. P. et al., 2002 in press, (astro-ph/0201057)
- (9) Hjorth J., Burud, I., Jaunsen, A. O. et al. 2002, ApJL, in press
- (10) Kassiola A., Kovner L., 1993, ApJ 417, 474
- (11) Kneib J.-P., Mellier Y., Fort B., Mathez G., 1993, A&A 273, 367
- (12) Kneib J.-P., Ellis R., Smail I. et al., 1996, ApJ 471, 643
- (13) Lidman C., Courbin F., Kneib J.-P., et al. 2000, A&A 364, L62
- (14) Magain P., Courbin F., Sohy S., 1998, ApJ 494, 452
- (15) Refsdal S., 1964, MNRAS 128, 307
- (16) Schechter, P. L., Bailyn, C. D., Barr, R. et al. 1997, ApJ, 475, 85
- (17) Sheinis, A.I., Miller, J.S., Bolte, M. & Sutin, B.M., 2000, Proc. SPIE, 4008, 522
- (18) Wambsganss J., Kundic. T. 1995, ApJ, 450, 19
- (19) Wisotzki L., Koehler T., Kayser R. & Reimers D., A&A, 278,L15
| A | B | JD | ||
|---|---|---|---|---|
| 1.2548 | .0143 | 1.868 | .0242 | 2451226.75 |
| 1.1809 | .0091 | 1.865 | .0115 | 2451235.75 |
| 1.2221 | .0087 | 1.848 | .0096 | 2451243.75 |
| 1.2245 | .0087 | 1.893 | .0097 | 2451255.75 |
| 1.1905 | .0086 | 1.893 | .0096 | 2451264.75 |
| 1.2312 | .0086 | 1.935 | .0095 | 2451284.50 |
| 1.2257 | .0087 | 1.943 | .0098 | 2451306.50 |
| 1.2154 | .0087 | 1.937 | .0101 | 2451311.50 |
| 1.1879 | .0087 | 1.911 | .0097 | 2451319.50 |
| 1.1747 | .0086 | 1.931 | .0096 | 2451336.50 |
| 1.1725 | .0087 | 1.922 | .0099 | 2451342.50 |
| 1.1629 | .0087 | 1.915 | .0097 | 2451354.50 |
| 1.1426 | .0085 | 1.905 | .0091 | 2451362.50 |
| 1.1448 | .0089 | 1.915 | .0109 | 2451371.50 |
| 1.1341 | .0086 | 1.916 | .0092 | 2451377.50 |
| 1.1426 | .0086 | 1.921 | .0096 | 2451386.50 |
| 1.1525 | .0087 | 1.931 | .0102 | 2451403.50 |
| 1.1515 | .0086 | 1.963 | .0095 | 2451420.25 |
| 1.1293 | .0085 | 1.922 | .0090 | 2451433.25 |
| 1.1310 | .0085 | 0.920 | .0089 | 2451434.25 |
| 1.1341 | .0089 | 1.880 | .0096 | 2451443.25 |
| 1.1406 | .0086 | 1.899 | .0091 | 2451450.25 |
| 1.1449 | .0087 | 1.865 | .0099 | 2451457.25 |
| 1.1433 | .0089 | 1.850 | .0107 | 2451465.25 |
| 1.0952 | .0087 | 1.833 | .0096 | 2451530.75 |
| 1.1086 | .0086 | 1.822 | .0094 | 2451566.75 |
| 1.1139 | .0087 | 1.822 | .0096 | 2451586.75 |
| 1.0913 | .0086 | 1.822 | .0095 | 2451609.50 |
| 1.1137 | .0089 | 1.815 | .0104 | 2451613.75 |
| 1.1094 | .0086 | 1.779 | .0096 | 2451674.50 |
| 1.1107 | .0086 | 1.789 | .0094 | 2451683.50 |
| 1.1174 | .0088 | 1.775 | .0101 | 2451689.50 |
| 1.1111 | .0086 | 1.807 | .0095 | 2451695.50 |
| 1.0908 | .0087 | 1.781 | .0100 | 2451703.50 |
| 1.0908 | .0105 | 1.804 | .0163 | 2451715.50 |
| 1.0869 | .0086 | 1.796 | .0095 | 2451723.50 |
| 1.0907 | .0086 | 1.813 | .0096 | 2451730.50 |
| 1.1080 | .0086 | 1.840 | .0091 | 2451751.50 |
| 1.0948 | .0087 | 1.831 | .0097 | 2451765.50 |
| 1.0880 | .0085 | 1.828 | .0091 | 2451781.50 |
| 1.0747 | .0086 | 1.842 | .0091 | 2451793.50 |
| 1.0588 | .0085 | 1.839 | .0090 | 2451799.25 |
| 1.0616 | .0085 | 1.840 | .0090 | 2451807.50 |
| 1.0468 | .0087 | 1.856 | .0102 | 2451815.25 |
| 1.0013 | .0086 | 1.841 | .0094 | 2451834.25 |
| 0.9944 | .0088 | 1.840 | .0107 | 2451869.75 |
| 1.1008 | .0086 | 1.828 | .0094 | 2451907.75 |
| 1.1141 | .0086 | 1.824 | .0085 | 2451913.75 |
| 1.1446 | .0086 | 1.803 | .0091 | 2451922.75 |
| 1.1587 | .0087 | 1.797 | .0095 | 2451927.75 |
| 1.1866 | .0086 | 1.740 | .0090 | 2451950.75 |
| 1.1964 | .0087 | 1.730 | .0093 | 2451958.75 |
| 1.2070 | .0087 | 1.711 | .0093 | 2451966.5 |
| 1.2178 | .0089 | 1.712 | .0099 | 2451975.75 |
| 1.2139 | .0086 | 1.722 | .0089 | 2451983.75 |
| 1.2220 | .0086 | 1.723 | .0089 | 2451984.75 |
| 1.2168 | .0090 | 1.759 | .0101 | 2452007.50 |
| 1.2446 | .0087 | 1.763 | .0093 | 2452007.75 |