Resolving the Effects of Resonant X-ray Line Scattering in Cen X-3 with Chandra
Abstract
The massive X-ray binary Cen X-3 was observed over approximately one quarter of the system’s 2.08 day orbit, beginning before eclipse and ending slightly after eclipse center with the Chandra X-ray Observatory using its High-Energy Transmission Grating Spectrometer. The spectra show K shell emission lines from hydrogen- and helium-like ions of magnesium, silicon, sulfur, and iron as well as a K fluorescence emission feature from near-neutral iron. The helium-like triplet of silicon is fully resolved and the analogous triplet of iron is partially resolved. We measure fluxes, shifts, and widths of the observed emission lines. The helium-like triplet component flux ratios outside of eclipse are consistent with emission from recombination and subsequent cascades (recombination radiation) from a photoionized plasma with temperature 100 eV. In eclipse, however, the (resonance) lines of silicon and iron are stronger than that expected for recombination radiation, and are consistent with emission from a collisionally ionized plasma with a temperature of 1 keV. The triplet line flux ratios at both phases can be explained more naturally, however, as emission from a photoionized plasma if the effects of resonant line scattering, a process which has generally been neglected in X-ray spectroscopy, are included in addition to recombination radiation.
We show that resonant line scattering in photoionized plasmas may increase the emissivity of line emission in hydrogen and helium-like ions by a factor as large as four relative to that of pure recombination and so previous studies, in which resonant scattering has been neglected, may contain significant errors in the derived plasma parameters. The emissivity due to resonance scattering depends sensitively on the line optical depth and, in the case of winds in X-ray binaries, this allows constraints on the wind velocity even when Doppler shifts cannot be resolved.
1 Introduction
It has long been known that in eclipsing high mass X-ray binaries (HMXBs, X-ray binaries where the companion star is a massive star of type O or B) a residual X-ray flux can be observed during eclipse of the compact X-ray source (Schreier et al., 1972). Becker et al. (1978) observed that in Vela X-1, the spectral shape of the hard X-ray flux observed during eclipse was approximately the same as that observed out of eclipse, and inferred from this that the residual eclipse flux was due to electron scattering of the primary X-rays in circumstellar material. The residual eclipse fluxes of X-ray binaries are typically a few percent of the out-of-eclipse fluxes, implying that the scattering optical depth in the continuum is approximately a few percent. Using this electron scattering optical depth and, for the length scale, the orbital separation (of order cm) circumstellar densities of order cm-3 are inferred, assuming , where is the Thomson cross-section.
Isolated O and B type stars have winds with mass-loss rates of order – yr-1 and velocities of order 1000 km s-1. The winds are driven by ultraviolet photons which impart their outward momentum to the matter primarily through scattering in line transitions (Lucy & Solomon, 1970; Castor et al., 1975). For a spherically symmetric steady-state wind, the hydrogen atom density () is related to the mass-loss rate () and velocity () by
| (1) |
where is the distance from the stellar center, is the proton mass, and we take , the mass in amu per hydrogen atom, to be 1.4. Using, again, the length scale cm, the average density derived above from electron scattering is consistent with the densities in the winds of massive stars.
This similarity suggests that the dynamics of hot star winds in X-ray binary systems might be quite similar to the those in isolated stars. However, the X-ray luminosities () of these objects are of order erg s-1, implying that typical values of the ionization parameter (, where is the distance from the X-ray source, Tarter et al., 1969) in the circumstellar material are of order erg s-1cm, meaning that the wind should be highly ionized. At such high ionization, the UV line opacity of the wind is greatly reduced and, therefore, so is the force exerted on the wind by the star’s radiation (Stevens & Kallman, 1990). Several calculations (which, however, have several significant approximations) have shown that UV photons cannot drive a wind on the X-ray illuminated side of an X-ray luminous HMXB (e.g., Stevens, 1991). It may be that an alternative mechanism, such as evaporation from the X-ray heated surface of the companion (e.g., Basko et al., 1977) drives the wind in luminous HMXBs.
The high ionization conditions in the winds of HMXBs can be inferred directly by the observation of K shell emission lines from hydrogen- and helium-like ions. Nagase et al. (1992), for example, noticed in a Ginga observation of Cen X-3 that the iron line was not consistent with only a 6.4 keV line from neutral iron but could be fit if a 6.7 keV component from helium-like iron was included. The launch of the ASCA observatory, with its Solid-State Imaging Spectrometers (SIS), represented a great improvement over previous observatories in the sensitivity to X-ray emission lines. With the SIS instrument, winds of HMXBs were seen to produce K-shell emission lines from hydrogen-like, helium-like, and near-neutral ions of elements from neon through iron (Nagase et al., 1994; Ebisawa et al., 1996). For erg s-1cm, recombination and subsequent electronic cascades (recombination radiation) are an efficient source of line emission.
In several studies, X-ray emission line spectra observed with ASCA were used to characterize the winds in HMXBs using line emissivities due to recombination. Two of these systems, Vela X-1 and Cen X-3, were found to have very different wind characteristics that may serve to illuminate important physical processes which occur in X-ray binary winds. The characteristics of the wind in Vela X-1 were explored by Sako et al. (1999) by fitting the emission-line spectrum observed during eclipse to the recombination radiation calculated from model winds. It was found that the emission lines from hydrogen and helium-like lines could be fit by a wind model with a density (or equivalently, for a given wind velocity, a mass-loss rate) approximately an order of magnitude smaller than that inferred in other other studies using different methods (e.g., Lewis et al., 1992, using the electron scattered continuum as discussed above, and the 6.4 keV iron fluorescence line). The emission line spectrum also exhibited fluorescence lines from near-neutral ions. All of the observational data could be explained if the wind had a population of dense clumps filling only a small part of the wind volume but containing most (90%) of the mass of the wind. It is conceivable that a wind could be driven by radiation pressure on the low-ionization material in the clumps. By contrast, Cen X-3 has an X-ray luminosity of erg s-1, more than an order of magnitude greater than that of Vela X-1. Its spectrum, as seen by ASCA, does not contain any fluorescence lines produced in the wind111A fluorescent iron line feature observed from Cen X-3 is produced near the neutron star (Nagase et al., 1992; Day et al., 1993; Ebisawa et al., 1996), indicating the absence of a low-ionization component. Wojdowski et al. (2001) showed that its emission line spectrum can be explained by recombination from a smooth, highly ionized wind. It was speculated that the large X-ray flux in the wind of Cen X-3 might evaporate clumps or prohibit them from forming. Radiation driving of such a smooth, highly ionized wind does not appear plausible, and it would appear that an alternate mechanism, such as X-ray heating of the companion is necessary (e.g., Day & Stevens, 1993). The winds of HMXBs have also been studied using X-ray emission lines and the assumption that the emission lines are due to recombination radiation by Ebisawa et al. (1996) and Boroson et al. (2001).
For a given X-ray luminosity and a given system geometry, the luminosity of recombination lines from the wind of a HMXB depends on the wind parameters only through its density distribution, as the temperature and ionization state are determined by the ionization parameter. As can be seen from Equation 1, the density, and therefore the recombination line emissivity, depends on the mass-loss rate and the velocity only in the combination . Wojdowski et al. (2001) has described explicitly how, for a velocity profile which scales with the parameter (the terminal velocity), the luminosity of the recombination lines depends on and only in the combination , and derived for Cen X-3 a value of yr. The degeneracy in these parameters could be removed if velocities could be measured independently, such as through Doppler line shifts. The resolution of the SIS detectors was approximately 2% in the iron K region (6.4–7.0 keV), and worse at the lower energies of the other emission lines, and so was insufficient to detect Doppler shifts of less than 2000 km s-1. As this is of the same order as the typical terminal velocity of UV driven winds, this has not allowed for strong constraints on the wind driving mechanism. The gratings on Chandra however, make possible detection of Doppler shifts as small as a few hundred km s-1 and therefore allow, in principle, tighter constraints on the wind driving mechanism. The HMXB Cen X-3 is the most luminous persistent HMXB in the galaxy and, presumably, is an extreme example of disruption of the wind by X-rays. It is, therefore, a strong candidate for alternative wind driving mechanisms. We observed Cen X-3 over an eclipse with the Chandra HETGS in order to constrain the wind velocity by resolving emission line Doppler shifts and thus constrain the mass-loss rate and possible wind driving mechanisms.
The spectra we obtain from our observations exhibit emission lines from hydrogen- and helium-like ions from magnesium to iron, as well as a a fluorescent line from near-neutral iron. We resolve the triplet of helium-like silicon, partially resolve the helium-like triplet of iron, and derive constraints on the respective flux ratios of the triplet components. Outside of eclipse, the constraints on the ratios are consistent with recombination radiation. However, in eclipse, in contrast to our expectations, the constraints are not consistent with those expected for recombination. The (resonance) lines are more intense, relative to the other components of the triplets, than expected for recombination and are, in fact, consistent with emission from a collisionally ionized plasma. Similar enhanced lines have also been seen from Vela X-1 (Schulz et al., 2002).
This, at first, appears to be a significant challenge to our paradigm of HMXB winds. Hydrogen- and helium-like line emission in collisionally ionized plasmas occurs at much higher temperatures (1 keV) than in photoionized plasmas (100 eV) and a mechanical source of heating, such as shocks in the wind, would be required to maintain such a high temperature. However, while contributions to the line spectrum from collisionally-ionized gas cannot be ruled out a priori, it is more natural to attribute the enhanced fluxes of lines with large oscillator strengths to direct photoexcitation by radiation from the neutron star. Indeed, the dangers of neglecting photoexcitation have long ago been pointed out for the case of optical spectra of planetary nebulae (Seaton, 1968), in which a hot star photoionizes a cloud of surrounding gas. More recently, clear evidence for photoexcitation-driven line emission has also been obtained from Seyfert 2 spectra, where similarly enhanced He-like lines have been observed with Chandra HETGS (Sako et al., 2000). The presence of absorption lines in Seyfert 1 galaxies (where a direct line of sight to the compact radiation source exists) gives further evidence for photoexcitation in these objects (Kaastra et al., 2000; Kaspi et al., 2001). X-ray spectra of Seyfert galaxies are similar to those of HMXBs, implying that plasma in the two types of systems has similar ionization conditions (2–4). In both types of systems, plasma column densities are of order cm-2. Furthermore, in both types of systems, the X-ray emitting gas is thought to have bulk motions with velocities of order 100 to 1000 km s-1. Therefore, we should not be surprised that photoexcitation is an important process in producing the observed spectra in HMXBs.
As resonant X-ray line scattering has received little attention in the literature, in this paper we focus on the effects of resonant scattering in HMXBs, with the expectation that this work will complement parallel studies in the Seyfert galaxy domain. We show that resonant scattering of radiation from the compact source in an HMXB results in increased line fluxes for lines with large oscillator strengths (such as the lines of helium-like ions) in observations during X-ray eclipse. We further show that this line flux enhancement due to resonant scattering saturates as line optical depths become comparable to unity and that the relative line fluxes that we observe require non-zero line optical depths.
The line optical depths along a path depend on the velocity distribution along that path. Kinkhabwala et al. (2002) have calculated the saturation of the line flux enhancement due to resonant scattering in plasmas without bulk motions but with a Gaussian distribution of ion velocities and shown that the XMM RGS emission line spectrum of the Seyfert 2 galaxy NGC 1068 can be fit for appropriate values of the ion column density. In a gas where bulk motions are larger than the thermal or other small-scale velocities, the optical depth, and therefore, the depletion of the resonantly scattered line luminosity, depends on the bulk velocity distribution. In the context of an HMXB wind, therefore, the resonantly scattered line luminosity has a dependence on other than in the combination . We show that in spectra where the helium-like triplets can be resolved, the portion of line luminosity due to resonant scattering may be derived, and, for a given wind model, explicit constraints on the terminal wind velocity may be derived. These constraints may be derived only from observed line fluxes, and do not require any information regarding Doppler line shifts or broadening.
In §2, we describe our observations and reduction of the data. In §3, we fit the line fluxes, widths, and shifts and derive constraints on the ratios of the fluxes of the components of the helium-like triplets. In §4 we calculate line emissivities due to resonant scattering, show that the observed line ratios can be explained by resonant scattering, and describe how constraints on the wind velocity can be derived. In §5 we summarize our conclusions and discuss the errors inherent in the previous studies which have not included the effects of resonant scattering.
2 Observation and Data Reduction
Cen X-3 was observed with the Chandra observatory on 5 March 2000 from 08:10:14 to 19:54:18 UT with the HETGS (Canizares et al. 2002 in prep.) in place and with the ACIS-S detector array in standard configuration. The observation occurred over 42,444 seconds during which time data was collected over 39,174 seconds. Using the ephemeris of Nagase et al. (1992), this is the phase interval 0.19 to 0.03.
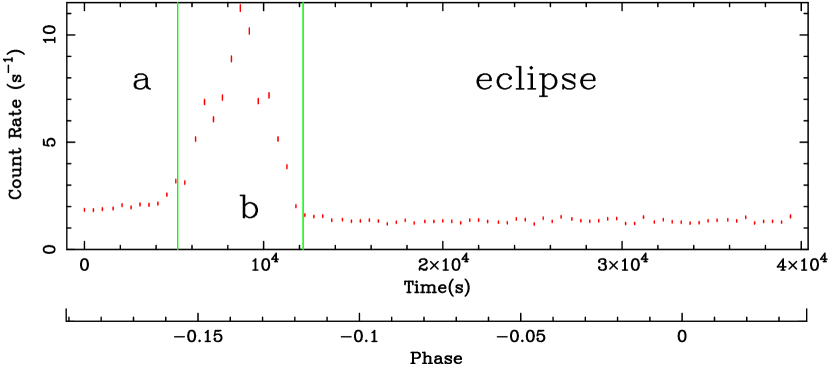
The pipeline data processing identified the zero-order image of Cen X-3 in the ACIS-S image and identified detector events due to dispersion in the first three orders by the HETG. From this event list we created a light curve which we show as Figure 1. The flux increased, possibly as the source came out of a pre-eclipse dip, before going into eclipse. We divided the observation into three time segments which we indicate on the lightcurve: “a” during the dim time at the beginning of the observation (phase 0.19 to 0.157), “b” during the bright time before eclipse (phase 0.157 to 0.118) and the reminder of the observation “eclipse” (phase 0.118 to 0.03). We extracted dispersed spectra from the entire processed event list and also from each of the time segments indicated above. The spectra for orders greater than one show very few counts and therefore we use only the first order spectra in our analysis. We plot selected regions of the spectra from each of the time segments in Figure 2. The wavelength scale of the grating response matrices used in this analysis have been found to be inaccurate by 540 parts per million due to a contraction of the detector pixel scale. As a correction was not available for this at the time that the data was reduced, we corrected for this simply by adjusting all of the wavelengths we used by this amount. When we plot spectra however, the uncorrected scale is used.
Due to the brightness of the source, the zero-order image of Cen X-3 suffers from pile-up and it is used in our analysis only in the pipeline processing to find the origin of the dispersion angle coordinate. Pileup may affect the automatic zero-order position determination. However, an inspection of the detector image shows the automatically determined position to be very close to the center of the zeroth order image as well as the known position of the source (Clark et al., 1978).
3 Spectral Analysis
Inspections of the first order MEG and HEG spectra show almost no counts longward of 10 Å. Lyman emission lines from hydrogen-like neon, magnesium, silicon, and sulfur can be seen. Higher order Lyman lines and helium-like emission lines are also apparent from some of these elements. An iron K fluorescence emission feature is also apparent.
We fit indiviudual Lyman lines and individual helium-like emission complexes for elements other than iron using only the spectral channels within 0.25 Å of those features. Because the iron K features are closely spaced, we fit that entire region simultaneously using the spectral channels in the range 1.53–2.20 Å. All of our spectral fits were done with the XSPEC (v11, Arnaud, 1996) program. In our fits, we used power laws to model the continua and Gaussians (XSPEC model “zgauss”) for each emission line component. The three parameters of the Gaussian emission components are the flux (), width (Gaussain ), and shift relative to the rest wavelength (). We express both and as Doppler velocities with positive values of corresponding to shifts to longer wavelengths (redshifts). The velocity of the center of mass of the Cen X-3/V779 Cen system is only 394 km s-1 (Hutchings et al., 1979) and we do not corrected for this in our analysis. Our spectra have few counts per bin and so we fit by minimizing the C-statistic, as implemented in XSPEC222http://xspec.gsfc.nasa.gov/docs/xanadu/xspec/manual/manual.html, rather than , as is not an accurate goodness-of-fit parameter for this case. All of the errors and limits in this work are derived using the condition which corresponds to the 68.3% confidence interval.
The Ly line is actually a doublet. The decay of the excited level produces the Ly line which has wavelength slightly shorter than the Ly line produced by the excited level . For recombination, as well as emission from thin collisionally ionized plasmas, these two components are emitted in proportion to their statistical weights, i.e., the luminosity of Ly is twice that of Ly. These doublets are not resolved in our data so it is not possible to fit them independently. However, in order to obtain line shifts and widths as accurately as possible, we include both components in our fits but constrain and for the two components to be equal and constrain to be 2. In Table 1, we give the best fit parameter values and errors for our fits to Ly doublets other than iron using both grating sets. We have used the line wavelengths of Johnson & Soff (1985) as the rest-frame values. For many lines, the signal-to-noise ratio is poor, which may result in spurious results (e.g., when the fitting algorithm identifies random fluctuations of the spectrum as lines). Therefore, we only include lines for which the best fit line flux is at least three times the lower error.
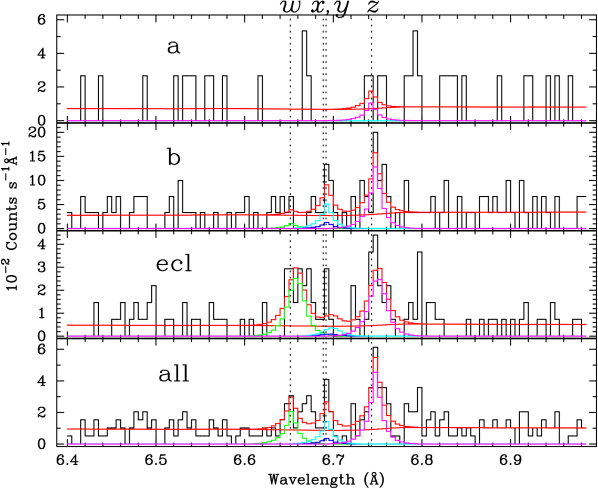
In order of increasing wavelength, the components of the helium-like triplet are the line (also referred to as the resonance line, and produced by the decay of the excited level to ground), the and lines (ground, also referred to, together, as the intercombination line), and the line (ground, also referred to as the forbidden line). As with the hydrogen-like Ly doublets, the and lines cannot be resolved with Chandra (Hence the designation of this line complex as a triplet) but we included both components separately and tied the relative fluxes to those expected from recombination — =10.0 for Mg XI, 4.0 for Si XIII, 2.0 for S XV, and 0.76 for Fe XXV. The relative emissivities of the components of the triplets depend, as will be described later, on several physical variables, so, other than the constraint on , we set no constraints on the flux ratios of these lines. We do, however, constrain all three lines to have the same shifts and widths. For the wavelengths of the components of the He-like triplet, we use the line wavelengths of Drake (1988).
The signal-to-noise ratio of the data are not large enough to make useful constraints on the components of the helium-like triplets of Mg XI or S XV. The spectral data for the Si XIII triplet and the best-fit model lines are plotted in Figure 3. The line fluxes, shifts, widths, and flux ratios of these lines are shown in Table 2. Also in this table, we include the expected line flux ratios from recombination radiation in a photoionized plasma as well as the expected ratio for a collisionally ionized (coronal) plasma. For recombination radiation, excitation rates as a function of temperature have been derived using HULLAC (Klapisch et al., 1977) and PIC (Saloman et al., 1988). For the collisional case, we use emissivities from Mewe et al. (1985). In both cases, we use the values at the temperature of peak emissivity (from Sako et al., 1999, for recombination in a photoionized plasma) though in both cases, these ratios are only weak functions of temperature. The line emissivities expected for resonance scattering are discussed in §4.
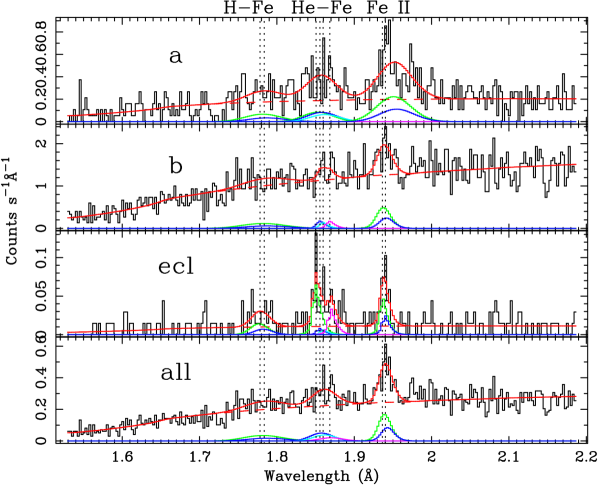
The radiative transitions following ionization of a K electron from an iron ion with a filled L shell may, given the resolution of the Chandra HEG, be grouped into two line groups analogous to the Ly doublet in hydrogen-like ion. Like the Ly doublet, these two transition groups are separated by approximately 15 eV (corresponding to 5 mÅ) and have emissivities with the ratio 2:1. The energies (wavelengths) of the fluorescent line groups of neighboring charge states of Fe II–Fe XVII are shifted by approximately 15 eV (5 mÅ) from each other (Kaastra & Mewe, 1993). While the separations between the fluorescent line groups for a single charge state and the separations between the line groups of neighboring charge states are too small to be resolved by Chandra, fluorescence emission from several different charge states might make for an observably broadened line. We fit the 1.94 Å emission feature using a doublet in which both components have the same Doppler velocity and width, the flux ratio is fixed at 2:1, and the rest wavelengths are those of Bearden (1967) for Fe II (neutral before K shell ionization). For these fits, for all except the eclipse phase, we additionally fixed the Doppler velocities of the hydrogen- and helium-like lines to be zero, as the quality of the data was not sufficient to produce meaningful fits without these constraints. The data and best fit models for the iron K region are shown in Figure 4. The best-fit parameters, parameter limits, and, for the helium-like triplet of iron, the expected line component ratios are tabulated in Table 3.
The best-fit Doppler shifts and widths of lines of elements other than iron are almost all less than 500 km s-1 and for all measured lines, with the single exception of Mg XII Ly, consistent (within the limit) with values of 500 km s-1 or less. For iron, the velocities are sometimes larger, though in most of these cases, the best fit line intensity is less than three times the lower error. Therefore, the best-fit values of the width and velocity may be spurious. The two exceptions are the fluorescence line fit to time segment “a” and the Ly line fit to the summed “all” spectrum. In Figure 4, it can be seen that the “a” spectrum contains a narrow peak near the wavelength of the Fe II K line and a smaller narrow peak approximately 40 mÅ longward of the Fe II K line. Our model fails to fit either peak individually and instead the parameter for Fe II K becomes large so as to fit both peaks. If another line component is added to the model, both peaks can be fit as narrow lines with the shift and width of the stronger line consistent with less than 500 km s-1. It may be that this peak longward of Fe II K is due to Compton recoil (Paerels, et al. 2002, in prep.). The fit to the Ly line (=1.78 Å) may be affected by the absorption edge of neutral iron (1.74 Å) and by the K neutral fluorescence line (1.76 Å). We therefore conclude that our spectrum is consistent with all lines having widths and shifts less than 500 km s-1.
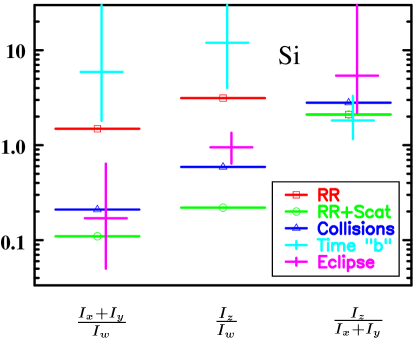
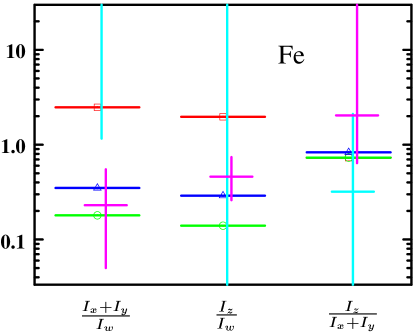
We show the limits derived for the line component flux ratios of the helium-like triplets of silicon and iron in and out of eclipse, as well as the expected ratios for emission from a plasma in collisional equilibrium in Figure 7. It would appear from the observed line ratios that the wind seen during eclipse is collisionally ionized and that the wind seen outside of eclipse is photoionized. This would be puzzling, owing to the fact that during the two orbital phases, much of the same wind is visible to the observer. However, until now we have not considered resonant scattering.
4 Resonant Scattering
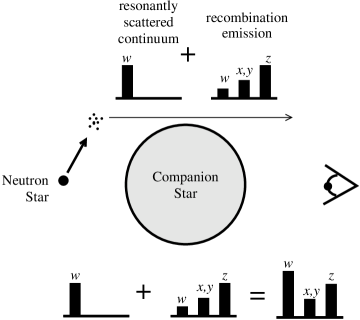
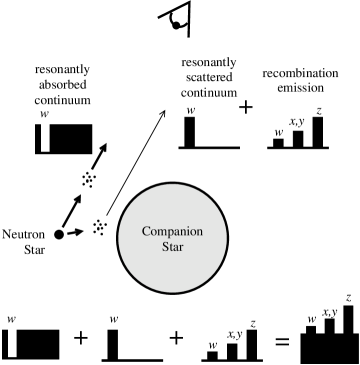
Transitions which have significant large oscillator strengths can be excited by direct photoexcitation. This additional rate of excitation leads to an increase in the rate of line emission as the photoexcited ions decay. When one electron from a ground state hydrogen or helium-like ion is photoexcited to the level, the decay is almost always the inverse process of the photoexcitation. We refer to this photoexcitation and subsequent decay as resonant scattering. The Ly lines of hydrogen-like ions and the lines of helium-like atoms have large oscillator strengths but the , , and lines of helium-like atoms do not. In the wind of an X-ray binary, photoexcitation by radiation from the compact source will therefore result in enhanced line emission of lines with large oscillator strengths. In eclipse, when the wind is visible, but the neutron star is not, resonant scattering results in an enhancement of the line, but not the , , and lines, of the helium-like triplet. Out of eclipse, however, when the neutron star is visible, photons near the rest frequency from the neutron star will be scattered out of the line of sight to the observer, resulting in a continuum with a “notch” from the line of sight to the neutron star. If the velocities in the material along the line of sight to the neutron star are not too different from those in the bulk of the gas, the emission line will be superimposed on the notch, reducing the apparent line flux. Resonant scattering, then, represents a plausible mechanism for increasing the flux of the line during eclipse but not outside of eclipse. We illustrate this schematically in Figures 5 and 6.
In order to determine whether resonant scattering can quantitatively explain the effects we observe, we calculate the line luminosity enhancement due to resonant scattering in a distribution of gas surrounding a point source of radiation. In hydrogen and helium-like ions, electrons may also be excited to the state by photoexcitation to states and subsequent decay. However, as will be described later, this process represents a small contribution to the excitation rate and we will neglect it here. Since resonant scattering, as defined here, does not create or destroy photons, The resonantly scattered line luminosity is equal to the luminosity removed from the primary radiation:
| (2) |
where is the specific luminosity of the point source at , the line rest frequency. We have assumed here that , the specific luminosity of the point source, is not a strong function of frequency in the neighborhood of the line rest frequency. The line (photoexcitation) optical depth from the compact radiation source to infinity, , is a function of frequency and direction and depends on the line oscillator strength and the density and velocity distributions of the scattering ion. In principle, the frequency integral runs from 0 to but in this work we are considering velocities that are small compared to , and the integrand will be non-zero only in a small interval near , the line rest frequency.
For a plasma in photoionization equilibrium, the recombination line emissivity may be written in terms of the photoionization rate (e.g., Osterbrock, 1989). It will further be useful to express the photoionization cross-section in terms of an oscillator strength. Bethe & Salpeter (1957) define the quantity such that is the summed oscillator strength for absorption transitions to continuum levels between and . We use , where is the ionization potential, and define which differs from by the factor . The photo quantity may be derived from the quantity , which is defined such that differs from the quantityis similar to may be defined as follows:
| (3) |
Here is the recombination line emissivity, the energy emitted in the line due to recombination per unit volume, time, and solid angle. The symbol is Planck’s constant, is the line rest frequency, and are the electronic charge and mass, and is the speed of light. The symbols and are, respectively, the atomic number and charge of the ion from which the recombination line is emitted and is the density of that ion. The quatity is the mean intensity of radiation (energy per unit area per unit time per unit frequency per steradian, averaged over solid angle, assuming that the plasma is optically thin in the photoionizing continuum) due to the point radiation source, and is the fraction of recombinations that result in emission of the line. The value of depends on temperature, but only weakly.
The recombination line luminosity is then
| (4) |
It will be useful to relate the spatial integral to the photoexcitation optical depth, which may be done as follows:
| (5) |
where is the line oscillator strength. Equation 4 then becomes
| (6) |
where we have noted the dependendence of on explicitly.
Dividing Equation 2 by Equation 6 gives
| (7) |
We define the last fraction in this equation as the optical depth functional . Its value ranges from 0 to 1, and if the column is optically thin in the line ( for all and all directions), its value approaches unity. The first fraction on the right hand side then gives the value of in the optically thin limit.
The variation of the line luminosity contributions due to recombination and resonant scattering with optical depth may be understood as follows. While the line luminosity due to resonant scattering increases with the line optical depth, it saturates as the line optical depth becomes comparable to unity. Recombination also saturates, but with the optical depth of the photoionization continuum. As the cross-section in the photoionization continuum is generally much smaller (so small that we have neglected it) than the line cross-section, resonant scattering is always more saturated than recombination). Therefore, the relative contribution due to resonant scattering is greatest when neither process is saturated, i.e., when the line optical depth is small.
If the neutron star is not occulted, we observe a notched continuum from along the line of sight to it, as mentioned above. We add a term to Equation 2 to account for the resulting reduced apparent luminosity.
| (8) |
where indicates the line of sight to the observer. Adding the absorption term to Equation 7 is straightforward. It can be seen that for spherical symmetry, the apparent value of is zero, as expected — i.e., resonant scattering makes no net contribution to the observed line fluxes.
In a real HMXB, the companion star may occult a significant fraction of the wind and so the relations derived above are not accurate. It is straightforward to generalize the above expressions for line luminosities for the case of an occulting body of finite size. However, this extra mathematical complexity does not serve to illustrate the points we wish to make here. The expression for , discounting the gas behind the star, is still the optically thin value derived above multiplied by a quantity ranging from zero to one, which depends on optical depths and is one in the optically thin limit. Therefore, we continue with the approximation that the entire wind is visible to the observer.
4.1 Resonant Scattering Effects in Hydrogen and Helium-like Ions
The oscillator strengths of the , , and lines are very small and so it is a good approximation to neglect any contribution to the emissivity those lines due to resonant scattering. For the hydrogen-like Ly doublet and the helium-like line . The value of () is equal to the number of electrons in the ion. The sum of the oscillator strengths of all of the transitions from ground to levels with is only approximately 0.1, justifying, for our approximate treatment here, our neglect of these transitions. The variation of with is described approximately by where, for the ground state of hydrogen and helium-like ions, the normalization constant is given by
| (9) |
Evaluating this integral gives . If , then
| (10) |
and Equation 7 becomes:
| (11) |
For Cen X-3, we take (approximately the value determined by Santangelo et al., 1998)333The quantity is the energy flux, so is related to the exponent (index of the photon flux power-law) by .. Using this and , we have, for the hydrogen line and the helium-like resonance line:
| (12) |
Photoexcitations to bound states above the level and resulting cascades also contribute to the luminosity of the lines. However, the oscillator strength summed over all levels is only approximately . Therefore, in the optically thin limit, the photoexcitation rate to all states with is much less than the rate to the state. As the transition becomes saturated, the photoexcitation rate to levels with may approach that of the level. However, the spontaneous deexcitation rates for photoexcited levels to excited levels are generally less than the deexcitation rates to the ground state by approximately a factor of ten. Therefore, even if the line becomes highly saturated, the contribution to luminosities of the lines from photoexcitations to the level will dominate over contributions to photoexcitations to levels. Therefore, for the purposes of this paper, we neglect such photoexcitations to levels. Equations 11 and 12 may be derived with more precise atomic data. However, due to fact that that our measurements of the line flux ratios have large statistical errors, and the fact that that we have not considered the effects of cascades following photoexciation to levels with , this is not likely to result in a qualitative improvement in our results.
Using HULLAC (Hebrew University and Lawrence Livermore Atomic Code, Klapisch et al., 1977) as described in previous work (Liedahl & Paerels, 1996; Sako et al., 1999; Wojdowski et al., 2001) we have, for ions with =6–26, found the value of for the line of helium-like ions to be 0.12 and the value of for the Ly doublets to be 0.41. For our functional form of , in the optically thin limit, resonant scattering results in a contribution to the line luminosity approximately 13 times that of recombination. However, resonant scattering makes only a negligible contribution to the , , and lines, so that resonant scattering results in a contribution to the total line luminosity approximately 2.3 times that of recombination. We show in Tables 2 and 3 and plot in Figure 7, the expected line ratios for recombination plus resonant scattering in the optically thin limit along with the expected values for emission from a collisionally ionized plasma and with the measured values. While the relative fluxes of the lines in eclipse are larger than expected for radiative recombination, the ratios indicate that the relative fluxes of the lines are less than expected for recombination radiation plus resonant scattering in the optically thin limit. If the line emission is due to recombination and resonant scattering, non-zero optical depths of the lines are indicated. For the Ly doublets, resonant scattering in the optically thin limit provides a line emissivity approximately 3.9 times that of recombination. However, from this unresolved doublet alone, it is not possible to measure what fraction of the observed line flux is due to resonant scattering nor is it possible to estimate the implied optical depth.
4.2 Observational Constraints on Line Optical Depth
The luminosity of the line due to resonant scattering depends on an integral of the line optical depth over solid angle and frequency. It is not possible, from the measured line flux ratios, to extract the complete optical depth function. However, if the optical depth, is zero for all frequencies and directions, except for some finite region in frequency and directions where it has the single positive value , the functional simplifies to . Such a distribution of optical depth would be realized, for example, by a cone with its vertex at the radiation source with constant ion density inside the cone and a constant velocity gradient away from the radiation source. While we do not expect the wind to have this simple distribution of optical depth, the value of for which the observed line ratios are reproduced represents a characteristic optical depth for the wind.
Because resonant scattering enhances the luminosity of the line, but not the luminosities of the , , or lines, it is convenient to examine the effects of resonant scattering using the quantity
| (13) |
In Figure 8, we plot the value of the ratio for Si XIII as a function of along with our measured value of and the implied value of . Because the value of for pure recombination () is known and the , , and lines are not affected by resonant scattering, it is possible to determine how much of the observed flux in the line is due to recombination radiation and how much is due to resonant scattering. In Table 4, for Si XIII and Fe XXV, we give , the expected enhancement of the line due to resonant scattering in the optically thin limit, the expected value of for recombination plus resonant scattering, and the following quantities determined for the eclipse phase: , , the ratios of to and to the total flux due to recombination, and .
5 Discussion
We have observed Cen X-3 from before an eclipse until mid-eclipse. During this observation, the continuum flux underwent a large increase, then decreased due to the eclipse ingress. We have fit the shifts, widths, and fluxes of observable lines. Our best fit velocity shifts and (Gaussian ) velocity widths are generally less than 500 km s-1. These velocities are significantly smaller than terminal velocities of isolated O star winds (1–2 km s-1, e.g., Lamers et al., 1999). However, in isolated O stars, X-ray line velocity widths (HWHM or Gaussian ) have been observed from 400 km s-1(Schulz et al., 2000) to km s-1 (Waldron & Cassinelli, 2001; Cassinelli et al., 2001; Kahn et al., 2001). Our results for the Doppler velocities are therefore consistent with those in isolated O stars.
We have measured the ratios of the fluxes of the components of the helium-like triplets of silicon and iron. We find that the flux ratios are consistent with recombination in a photoionized plasma, with the exception that during the eclipse phase, the line is stronger than expected from recombination. Resonant scattering provides a natural mechanism for increasing the fluxes of the lines in eclipse but not out of it. We have calculated the enhancement of the line fluxes due to resonant scattering and we find that the observed relative line fluxes are smaller than expected for resonant scattering in the optically thin limit and non-zero line optical depths are required. We are therefore able to explain the observed emission line triplets of helium-like ions — which, during eclipse, appear very much like what would be observed from a hot, collisionally ionized plasma — without rejecting the hypothesis that the wind is composed entirely of a warm photoionionized plasma.
As mentioned in §1, in previous spectral studies of HMXB winds with moderate-resolution spectral data, X-ray emission line spectra have been interpreted with the assumption that line emission is due purely to recombination radiation. The primary physical quantity inferred from a line luminosity is, as the emissivity due to recombination depends on the square of the density, an emission measure: . If the apparent line emissivity is underestimated, such as by neglect of resonant scattering, then the inferred emission measure is overestimated by that same amount. The parameter is proportional to the wind density and therefore proportional to the square root of the wind emission measure. We have shown that outside of eclipse, resonant scattering along the line of sight to the neutron star offsets the line flux enhancement due to resonant scattering in the bulk of the gas. In our case, however, these two effects appear to have may nearly cancelled, and so for interpreting spectra obtained outside of eclipse, it may be a good approximation to ignore resonant scattering. For spectra obtained during eclipse, however, resonant scattering, in the optically thin limit, increases the line fluxes of hydrogen- and helium-like ions by factors of, respectively 3.9 and 2.3. Therefore, emission measures inferred assuming line emissivities from recombination only, from spectra obtained during eclipse, could be too large by factors as large as four. However, in fact, the error due to neglect of resonant scattering is probably not so large as the winds may have significant optical depths in the lines, which, as discussed earlier, decreases the line luminosities due to resonant scattering relative to the line luminosities due to recombination. Indeed, as we have shown in §4, for the eclipse spectrum described here, the total flux due to resonant scattering for Si XIII and Fe XXV is only approximately 0.6 and 1.0, respectively that due to recombination. Therefore, previous estimates of the parameter may be too large only by factors of about two or less. While this does not qualitatively the affect conclusions reached in any previous studies, the effects of resonant scattering should be included, even in the analysis of spectra of medium-resolution spectra, if only so the basic wind parameters may be derived accurately.
While the neglect of resonant scattering in previous work may not have resulted in significant errors in derived wind parameters, interpretation of high-resolution X-ray spectra with proper consideration of resonant scattering allows the determination of wind parameters that cannot otherwise be determined. As Wojdowski et al. (2001) have shown, for a typical model wind, the wind density, and therefore the luminosity of recombination line emission depends on the parameters (the mass-loss rate) and (the terminal wind velocity) only in the combination and that it is therefore impossible to constrain either of these parameters individually using only the observed luminosities of lines resulting from recombination. Resonant scattering, however, has a different dependence on these parameters. Emission from resonant scattering results as photons from the compact object are redirected by scattering ions toward the observer. We imagine a model wind for which we decrease the velocity parameter while keeping the value of , and therefore the density, constant. As is decreased, the Doppler shifts decrease and the same number of ions scatter photons from a decreasing frequency range. This results in a decrease in the number of photons which are subject to scattering but an increase in the scattering optical depth and an increase in the fraction of the accessible photons which can be scattered. However, the fraction of the accessible photons which may be scattered is, of course, limited to be no more than unity and as is decreased, the total resonantly scattered line luminosity decreases. Because is kept constant, however, the line luminosity due to recombination remains constant. The emission line luminosities due to recombination and resonant scattering, therefore, depend on and in a non-degenerate way. If the line luminosities due to recombination and resonant scattering can be determined, independent constraints on and can be derived. We have demonstrated that, with high resolution spectroscopy, it is possible to resolve helium-like triplets and thereby discriminite between the line emission due to recombination and resonant scattering. Therefore, using high resolution X-ray spectroscopic data, it is possible to derive independent constraints on the parameters and . However, deriving these constraints requires detailed modeling of the wind, which is beyond the scope of this work, so we do not derive such constraints here. However, this effect is most sensitive in the regime where the line optical depth is of order unity. As we have shown in § 4.2, the line optical depths of the lines of helium-like silicon and iron in Cen X-3 are, in fact, of order unity and so the prospects for using this effect to derive independent constraints on the wind parameters and are good. Furthermore, these constraints do not depend at all on resolving Doppler line shifts or broadenings and are therefore independent of any constraints which may be obtained from observed line profiles.
From our analysis of Chandra spectra of Cen X-3, we may conclude that in the analysis of high-resolution spectroscopic data, such as is obtained using the gratings on Chandra and XMM, of the winds of X-ray binaries and X-ray photoionized plasmas in general, it is critical that the effects of resonant scattering be included, if observed spectra are to be reproduced, or if inferences are to be made regarding the conditions of the emitting plasma (e.g., for determining whether plasma is photoionized, collisionally ionized, or ionized by a “hybrid” of both processes). Furthermore, in the analysis of high-resolution spectroscopic data from HMXBs, including the effects of resonant scattering not only allows wind parameters to be derived accurately, but allows new constraints on wind parameters.
References
- Arnaud (1996) Arnaud, K. A. 1996, in ASP Conf. Series, Vol. 101, Astronomical Data Analysis Software and Systems V, ed. G. Jacoby & J. Barnes, 17
- Basko et al. (1977) Basko, M. M., Sunyaev, R. A., Hatchett, S., & McCray, R. 1977, ApJ, 215, 276
- Bearden (1967) Bearden, J. A. 1967, J. Phys. Chem. Ref. Data, 39, 78
- Becker et al. (1978) Becker, R. H., Pravdo, S. H., Rothschild, R. E., Boldt, E. A., Holt, S. S., Serlemitsos, P. J., & Swank, J. H. 1978, ApJ, 221, 912
- Bethe & Salpeter (1957) Bethe, H. A. & Salpeter, E. E. 1957, Quantum Mechanics of One- and Two-Electron Atoms (New York: Academic Press)
- Boroson et al. (2001) Boroson, B., Kallman, T., Blondin, J. M., & Owen, M. P. 2001, ApJ, 550, 919
- Cassinelli et al. (2001) Cassinelli, J. P., Miller, N. A., Waldron, W. L., MacFarlane, J. J., & Cohen, D. H. 2001, ApJ, 554, L55
- Castor et al. (1975) Castor, J. I., Abbott, D. C., & Klein, R. I. 1975, ApJ, 195, 157
- Clark et al. (1978) Clark, G., Doxsey, R., Li, F., Jernigan, J. G., & van Paradijs, J. 1978, ApJ, 221, L37
- Day et al. (1993) Day, C. S. R., Nagase, F., Asai, K., & Takeshima, T. 1993, ApJ, 408, 656
- Day & Stevens (1993) Day, C. S. R. & Stevens, I. R. 1993, ApJ, 403, 322
- Drake (1988) Drake, G. W. 1988, Canadian Journal of Physics, 66, 586
- Ebisawa et al. (1996) Ebisawa, K., Day, C. S. R., Kallman, T. R., Nagase, F., Kotani, T., Kawashima, K., Kitamoto, S., & Woo, J. W. 1996, PASJ, 48, 425
- Hutchings et al. (1979) Hutchings, J. B., Cowley, A. P., Crampton, D., Van Paradus, J., & White, N. E. 1979, ApJ, 229, 1079
- Johnson & Soff (1985) Johnson, W. R. & Soff, G. 1985, Atomic Data and Nuclear Data Tables, 33, 405
- Kaastra & Mewe (1993) Kaastra, J. S. & Mewe, R. 1993, A&AS, 97, 443
- Kaastra et al. (2000) Kaastra, J. S., Mewe, R., Liedahl, D. A., Komossa, S., & Brinkman, A. C. 2000, A&A, 354, L83
- Kahn et al. (2001) Kahn, S. M., Leutenegger, M. A., Cottam, J., Rauw, G., Vreux, J.-M., den Boggende, A. J. F., Mewe, R., & Güdel, M. 2001, A&A, 365, L312
- Kaspi et al. (2001) Kaspi, S., et al. 2001, ApJ, 554, 216
- Kinkhabwala et al. (2002) Kinkhabwala, A., et al. 2002, ApJ, 575, 732
- Klapisch et al. (1977) Klapisch, M., Schwab, J. L., Fraenkel, J. S., & Oreg, J. 1977, J. Opt. Soc. Am., 61, 148
- Lamers et al. (1999) Lamers, H. J. G. L. M., Haser, S., De Koter, A., & Leitherer, C. 1999, ApJ, 516, 872
- Lewis et al. (1992) Lewis, W., Rappaport, S., Levine, A., & Nagase, F. 1992, ApJ, 389, 665
- Liedahl & Paerels (1996) Liedahl, D. A. & Paerels, F. 1996, ApJ, 468, L33
- Lucy & Solomon (1970) Lucy, L. B. & Solomon, P. M. 1970, ApJ, 159, 879
- Mewe et al. (1985) Mewe, R., Gronenschild, E. H. B. M., & van den Oord, G. H. J. 1985, A&AS, 62, 197
- Nagase et al. (1992) Nagase, F., Corbet, R. H. D., Day, C. S. R., Inoue, H., Takeshima, T., Yoshida, K., & Mihara, T. 1992, ApJ, 396, 147
- Nagase et al. (1994) Nagase, F., Zylstra, G., Sonobe, T., Kotani, T., Inoue, H., & Woo, J. 1994, ApJ, 436, L1
- Osterbrock (1989) Osterbrock, D. E. 1989, ”Astrophysics of gaseous nebulae and active galactic nuclei” (Mill Valley, CA: University Science Books)
- Sako et al. (2000) Sako, M., Kahn, S. M., Paerels, F., & Liedahl, D. A. 2000, ApJ, 543, L115
- Sako et al. (1999) Sako, M., Liedahl, D. A., Kahn, S. M., & Paerels, F. 1999, ApJ, 525, 921
- Saloman et al. (1988) Saloman, E. B., Hubble, J. H., & Scofield, J. H. 1988, At. Data Nucl. Data Tables, 38
- Santangelo et al. (1998) Santangelo, A., Del Sordo, S., Segreto, A., Dal Fiume, D., Orlandini, M., & Piraino, S. 1998, A&A, 340, L55
- Schreier et al. (1972) Schreier, E., Levinson, R., Gursky, H., Kellogg, E., Tananbaum, H., & Giacconni, R. 1972, ApJ, 172, L79
- Schulz et al. (2000) Schulz, N. S., Canizares, C. R., Huenemoerder, D., & Lee, J. C. 2000, ApJ, 545, L135
- Schulz et al. (2002) Schulz, N. S., Canizares, C. R., Lee, J. C., & Sako, M. 2002, ApJ, 564, L21
- Seaton (1968) Seaton, M. J. 1968, MNRAS, 139, 129
- Stevens (1991) Stevens, I. R. 1991, ApJ, 379, 310
- Stevens & Kallman (1990) Stevens, I. R. & Kallman, T. R. 1990, ApJ, 365, 321
- Tarter et al. (1969) Tarter, C. B., Tucker, W. H., & Salpeter, E. E. 1969, ApJ, 156, 943
- Waldron & Cassinelli (2001) Waldron, W. L. & Cassinelli, J. P. 2001, ApJ, 548, L45
- Wojdowski et al. (2001) Wojdowski, P. S., Liedahl, D. A., & Sako, M. 2001, ApJ, 547, 973
| Time | Grating | Species | (km s-1) | (km s-1) | aaLine intensity units are ph cm-2 s-1 |
|---|---|---|---|---|---|
| a | MEG | Mg | 800 | 0300 | 1.3 |
| Si | 200 | 80 | 1.4 | ||
| b | MEG | Mg | 400 | 300200 | 2.1 |
| Si | 100 | 270 | 3.5 | ||
| ecl | MEG | Mg | 210100 | 34070 | 1.30.2 |
| Si | 300 | 160100 | 1.6 | ||
| S | 300 | 0 | 2.2 | ||
| HEG | Mg | 120 | 29080 | 1.3 | |
| Si | 420 | 320130 | 1.7 | ||
| S | 200 | 280 | 2.2 | ||
| all | MEG | Mg | 340 | 300 | 1.50.2 |
| Si | 10 | 280 | 2.0 | ||
| S | 300 | 230 | 2.9 | ||
| HEG | Mg | 300 | 32080 | 1.0 | |
| Si | 200 | 530 | 1.50.3 | ||
| S | 700 | 310 | 2.6 |
| time | (km s-1) | (km s-1) | aaLine intensity units are ph cm-2 s-1 | aaLine intensity units are ph cm-2 s-1 | aaLine intensity units are ph cm-2 s-1 | |||
|---|---|---|---|---|---|---|---|---|
| a | 0(fixed) | 0(fixed) | 0.0 | 0.0 | 0.20.2 | 0.86 | 1.0 | |
| b | 120 | 0 | 0.2 | 1.0 | 1.8 | 6.2 | 11.5 | 1.8 |
| ecl | 300 | 240 | 0.50.2 | 0.10.1 | 0.50.1 | 0.2 | 0.9 | 5.0 |
| all | 100 | 0 | 0.30.1 | 0.30.1 | 0.6 | 0.9 | 2.1 | 2.3 |
| process(es) | ||||||||
| rec(75 eV) | 1.49 | 3.13 | 2.1 | |||||
| rec+scat(75 eV) | 0.11 | 0.22 | 2.1 | |||||
| col(900 eV) | 0.21 | 0.59 | 2.8 |
| processes | |||||||
|---|---|---|---|---|---|---|---|
| time | rec | rec+scat | collisions | ||||
| parameter | a | b | ecl | all | (250 eV) | (250 eV) | (5 keV) |
| Ly | |||||||
| (km s-1) | 0(fixed) | 0(fixed) | -640 | 0(fixed) | |||
| (km s-1) | 3700 | 4600 | 1600 | 4000 | |||
| 35 | 7030 | 3.7 | 20 | ||||
| He-like | |||||||
| 0(fixed) | 0(fixed) | 160 | 0(fixed) | ||||
| width | 2900 | 200 | 60 | 2100 | |||
| 20 | 4.9 | 4.3 | 15.3 | ||||
| 40 | 23 | 0.9 | 17 | ||||
| 29 | 12 | 2.1 | 4 | ||||
| 0.86 | 0.2 | 2.48 | 0.18 | 0.35 | |||
| 0.5 | 1.97 | 0.14 | 0.29 | ||||
| 0.5 | 2.2 | 0.73 | 0.73 | 0.83 | |||
| K | |||||||
| 2000 | 100400 | 80 | 350200 | ||||
| width | 3200600 | 1100 | 20 | 900300 | |||
| 8011 | 76 | 4.0 | 243 | ||||
Note. — Units of and are km s-1. Units of are 10-5 ph cm-2s-1
| quantity | Si XIII | Fe XXV |
|---|---|---|
| 4.62 | 4.45 | |
| 13 | 13 | |
| 0.33 | 0.32 | |
| 1.1 | 0.7 | |
| 0.40.2 | 3.6 | |
| 0.6 | 1.0 | |
| 3.2 | 5.3 | |
| 4.0 | 2.2 |
Note. — Values without errors are theoretical values. Values with errors are derived from the eclipse phase.