Arcsecond Images of CH3CN toward W75N
Abstract
CH3CN (J=6-5) was observed with a resolution of 2” toward W75N using the BIMA interferometer. Two continuum sources were detected at 3 mm, designated MM1 and MM2 in previous studies. Alignment of two mm continuum sources with the outflow axis from MM1 suggests that these continuum sources may be the result of the outflow interacting with the interstellar medium. MM1 is coincident with compact CH3CN emission. CH3CN was not detected toward MM2. The distribution of optical depth () is derived. An excitation analysis was not done because of large line optical depths.
1 Introduction
Hot cores in molecular clouds have a characteristic diameter of 0.1 pc, density and temperature 100 K. Those hot cores that are luminous in the far IR (L 104 L⊙) but have no free-free radio emission are thought to be precursors to ultra-compact (UC) HII regions (Kurtz et al, 2000 and references therein). They are found in regions of massive star formation, often offset from UC HII regions (Hunter et al. 2000). Hot cores are principally studied through their molecular line emission and mm-submm continuum emission. Hofner et al. (1996) observed the UC HII region complex G9.62+0.19 and found that CH3CN emission is centered on the youngest, densest component in this complex. This component also drives an energetic molecular outflow (Hofner et al. 1996) and has weak ( 1 mJy) radio continuum emission at cm wavelengths (Testi et al. 2000). Based on observations of G9.62+0.29, Hofner et al. (1996) postulated that CH3CN emission might be a tracer of UC HII precursors.
Wilner et al. (2001) used CH3CN (J=12-11) observations of W49N to estimate the timescale for hot core evolution; they concluded that hot cores, which preceed the UC HII stage, have lifetimes less than or equal to UC HII regions. Zhang et al. (1998) observed many molecular lines, including CH3CN (J=8-7), toward W51 and concluded from line asymmetries that CH3CN was tracing infalling material. These studies found that CH3CN tends to be: 1) tightly confined ( 104 - 105 AU), 2) associated with regions of massive star formation and 3) optically thick in mm-wave transitions. Watt & Mundy (1999) observed CH3CN (J=6-5) toward 4 massive star formation regions (2 detections, 2 nondetections). Based on emission morphology, excitation analysis and chemical models by Millar et al. (1997), Watt & Mundy (1999) concluded that the hot core near G34.26+0.15 traced by CH3CN emission was probably externally heated. In contrast to typical results from the observations cited above, they found no significant dust emission at 3mm. Based on single-dish detection and interferometer non-detection, they also concluded that the CH3CN emission toward G11.94-0.62 has an extent of 50,000 AU.
A CH3CN (J=12-11) survey was undertaken using the 10m Heinrich Hertz Submillimeter Telescope (SMT) toward 48 known massive star formation regions to determine the fraction with detectable CH3CN emission (Pankonin et al. 2001). Forty-six percent of the regions surveyed were detected in CH3CN emission. Because the angular resolution was 30”, they were unable to determine if CH3CN originates from UC HII regions or from neighboring sites of even younger precursors of UC HII regions. Pankonin et al. (2001) found beam-averaged rotation temperatures and column densities to be consistent with internal heating, presumably from embedded protostars or the ionizing stars of the UC HIIs. They argued that beam dilution allowed only lower limits for CH3CN column densities.
An investigation in the lines of CH3CN (J=6-5) using interferometric resolution toward W75N is presented here to better determine the properties of this source and to establish how important resolution effects may be in the analysis of CH3CN line emission. W75N was selected because it is a relatively nearby region of massive star formation region with strong CH3CN emission and there are few previous observations of the hot core in this object.
2 Observations
Observations of W75N were obtained with the BIMA millimeter interferometer (Welch et al. 1996) on October 8, 11 and 12, 1999 and April 30, 2000 in the C configuration and on October 14, 1999 in the B configuration. Baselines ranged from 180m to 60m. The phase calibrator, 2025+337 (J2000), was observed approximately every 25 minutes. Our primary flux density calibrator was Mars, whose integrated flux density was 40 Jy on Oct. 10, 1999. Flux calibration is accurate to 20%. 2025+337 was found to have a flux density of 2.29 Jy, which is within the range of previous measurements (Welch et al. 1996). All data editing and reduction were performed using the MIRIAD package (Sault, Teuben, & Wright 1995). Narrow channel observations were obtained covering the frequency range 110.3485 GHz to 110.3916 GHz covering the CH3CN J=6-5 K=0-4 emission lines. These windows were not wide enough to observe the nearby CHCN transitions. Continuum subtraction was performed using two 100 MHz windows. These two windows were inspected and found to be free of lines. All maps were made using natural weighting. The correlator setup, rms noise and beam sizes are summarized in Table 1.
3 Results: Continuum and CH3CN Line Emission
3.1 MM1
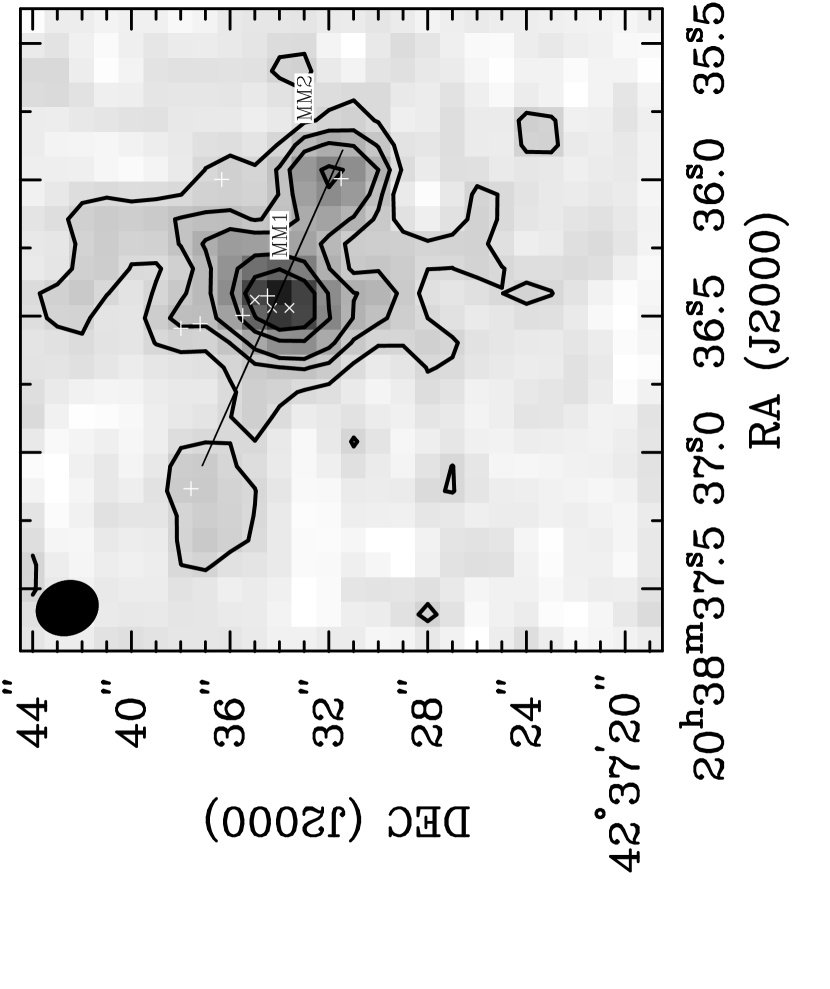
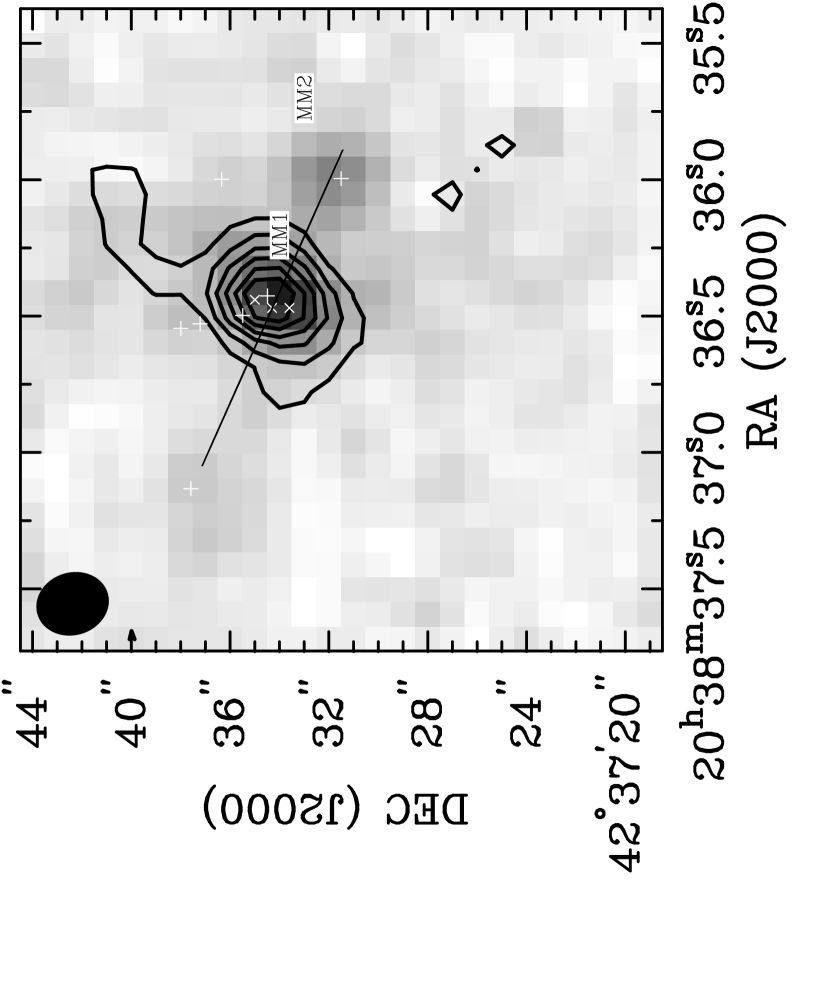
Our 3mm continuum image is shown in Figure 1 in both contours and greyscale. The line emission integrated over the K=0-4 components is shown in Figure 2 as contours superimposed on the 3mm continuum shown in greyscale. The CH3CN (J=6-5) spectrum integrated over a 4” x 4” area centered on MM1 is shown in Figure 3. The line emission is confined to MM1. As traced by CH3CN, MM1 is one of the most compact hot cores yet observed ( = 5.0” x 1.5” = 10,000 AU x 3,000 AU). The distribution of line emission is slightly elliptical, with a deconvolved major-to-minor axis ratio of 3.4 and position angle of 24 west of north, determined by a least-squares 2D Gaussian fit to the line emission. The individual K-components were imaged separately and found to be indistinguishable from the integrated line emission. The MM1 continuum emission is also elongated with a position angle, 24∘ west of north but deconvolved axis ratio of 1.6. MM1 has a peak 3mm continuum flux density of 80 16 mJy/beam and integrated continuum flux density of 390 80 mJy (integrated over 200 square arcsecs). The results of our analysis are given in Table 2.
Previous observations with the VLA show that 3 compact cm continuum sources lie within the central region of MM1 (Hunter et al. 1994 at 1.3 cm and 3.6cm and Torrelles et al. 1997 at 1.3 cm). Those observations had beam sizes 0.1”, which permitted them to resolve the cm-sources (see Figure 1, each VLA source is represented by a white X). The sources lie roughly along the mm continuum major axis of MM1. The mm continuum and CH3CN major axes are both perpendicular to the MM1 outflow axis (discussed below). This alignment is suggestive of an oblate cloud core, although the mm and CH3CN morphology could also result from the alignment of the three compact VLA continuum sources. MM1 and MM2 were not detected by the MSX satellite (Mill et al. 1994) between 8m and 21m. Modeling the emission as thermal dust emission at T=35 K (see section 3.3.2), we estimate that expected flux densities (S 1 mJy) are below the MSX detection limits (S 100 mJy).
3.2 MM2
A second mm-continuum source, MM2, was found 5” to the southwest of MM1. MM2 has a peak 3mm continuum flux density of 45 9 mJy/beam and integrated continuum flux density of 200 40 mJy. MM2 was not detected at cm wavelengths, indicating that its mm emission is probably due to dust. Previous submm observations do not have the spatial resolution to distinguish between MM1 and MM2 (Hunter et al. 2000). MM2 was also not detected via K-band photometry by Moore et al. (1988, 1991) or MSX (8m to 21 m). Absence of emission at K-band is probably due to intrinsically weak emission, although high optical depth may also be important at m. There are four possible explanations for these observations which we cannot distinguish between: 1) MM2 is heated by a proto O-star which has not formed a detectable HII region because of infall, 2) MM2 is heated by a non-ionizing star, 3) MM2 is heated by internal shocks, probably associated with the outflow from MM1, or 4) MM2 is heated externally, probably by the three cm-components of MM1.
3.3 Outflow
A bipolar outflow has been detected toward MM1 in CO (J=3-2) (Davis et al. 1998a; Hunter et al. 1994), CO (J=2-1) (Davis et al. 1998b) and in cm-radio continuum (Torrelles et al. 1997); all of whom find that the outflow position angle is 66∘ east of north (indicated by a black line in Figures 1 and 2). The outflow source has not been clearly determined. The outflow axis is perpendicular to the mm-continuum and CH3CN major axis. The cm continuum is likely produced by free-free emission, which, assuming the source is optically thin, would not be detectable at 3 mm. H2O and OH masers have also been measured along the outflow axis, although no significant velocity gradient was measured (Hunter et al. 1994 and Torrelles et al. 1997). Shepherd (2001) observed W75N at 3 mm and 1 mm and found a third mm source (MM3) 10” to the northeast of MM1, hinted at by the lowest contour in Figure 1. MM3, like MM2, lies along the outflow axis but on the opposite side of MM1 relative to MM2. Using flux density measurments at 1 mm (230 GHz) and 3 mm (90 GHz) of Shepherd (2001), the spectral indices of MM2 and MM3 are 3.1 and 1.8, respectively. Comparing Shepherd’s measurements with those in this study, we estimate the error in the spectral index of MM2 to be large, 1. The alignment of MM2 and MM3 suggests that they are associated with the outflow from MM1. In this scenario and based on its spectral index, emission from MM2 and MM3 could originate either from shock heated dust or shock-ionized optically thick gas in the outflow.
3.4 Analysis
3.4.1 Boltzmann Analysis and Optical Depth
CH3CN is a symmetric top molecule whose K-components are closely spaced in frequency but have a wide range of excitation energies above ground. J=6-5, K=0 has an excitation energy of 13 K above ground, whereas the K=3 transition, which is only 19 MHz lower in frequency, is 76 K above ground. Assuming the line emission from MM1 is optically thin, an excitation analysis, based on the radiation transfer equation, allows a determination of the rotation temperature (Trot) and column density (Ntot).
The pattern of K-components were simultaneously fit with Gaussian profiles. That is, we fixed the line separations and shifted the overall pattern to obtain a least squares fit. We also forced each line to have the same FWHM, true if all emission lines originate in the same volume. Thus, we allowed only 6 free parameters at each position: one common width (FWHM), one pattern velocity and 4 intensities (T). The Gaussians were fit using a Levenberg-Marquardt least-squares minimization technique (Argonne National Labs, Minipak Project 1980). We discarded fits to spectra at any position for which T for any single emission line.
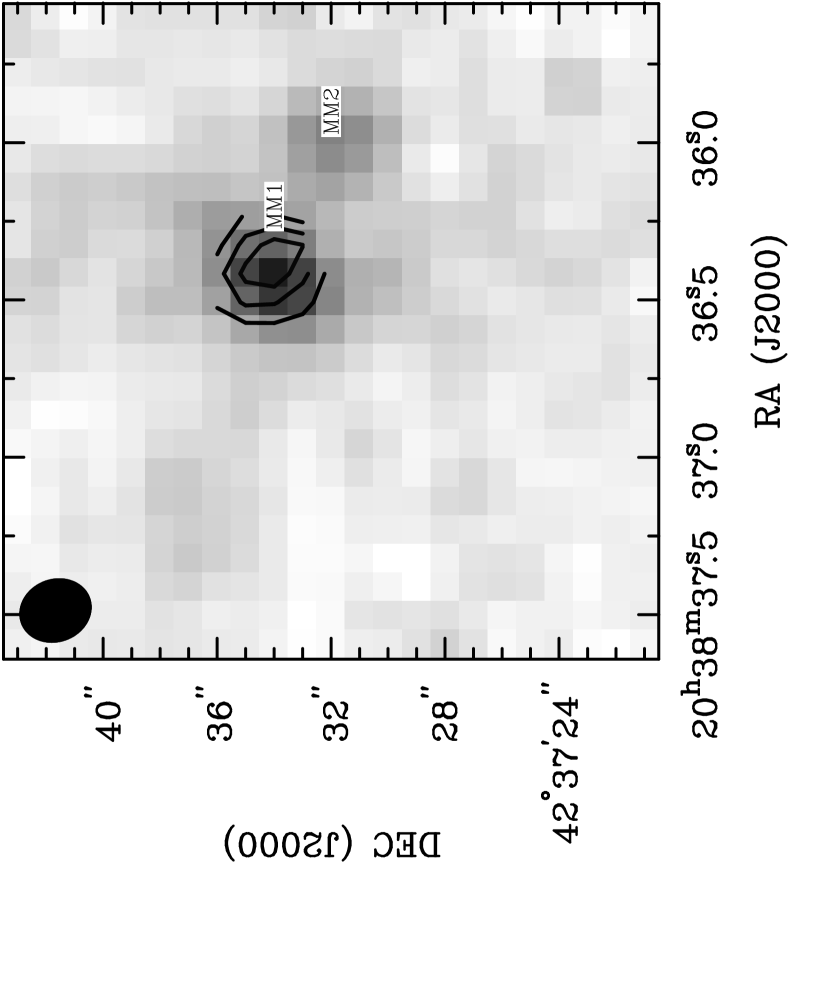
Some of the assumptions on which the excitation analysis rests are not strictly true. Specifically, the ratios of K-component intensities show that 1 in MM1 for many lines. Figure 4 shows the K=3 optical depth as calculated from its ratio with the K=2 line. The K=3 optical depth was found to range from 0.7 to 8.5. If the emission lines originate from different volumes of gas, however, this optical depth measurement would not be accurate. The optical depth of the K=0 and K=1 lines were not calculated because of blending. The optical depth of the K=4 line was not calculated because the line was not strong enough for a spatially resolved analysis. Goldsmith & Landger (1999) studied the effects of optical depth on the Boltzmann analysis and concluded that in such an analysis optically thick emission lines can produce a large scatter. In order to avoid calculating erroneous excitation temperatures and column densities, Goldsmith & Landger (1999) recommend combining observations of lines with a wide range of rotational states. Pankonin et al. (2001) compared results between their Boltzmann analysis and three different statistical equilibrium analyses and found that the average difference between the two methods in Trot was 30%. Pankonin et al. (2001) also derived lower limits for Ntot which were a factor of 3 lower than the statistical equilibrium analyses. Because the optical depth of these lines is large, we limit our analysis to the determination of line optical depths from line data and mass from continuum data. Pankonin et al. (2001) found that in a sample of 20 sources with 5 detected CH3CN (J=12-11) K-components, 8 had K=2 component optical depths 8. Since W75N was among the 12 sources they reported without an optical depth measurement, our analysis here implies that CH3CN line emission from hot cores frequently may be optically thick. In such cases, a source model including kinematics coupled with a radiative transfer/statistical equilibrium analysis is essential to correctly determine physical properties such as Trot and Ntot. Observations with significantly higher resolution observations, high signal-to-noise and a wide range of excitation energy will be required to provide enough constraints to justify such a model.
The CH3CN emission observations toward W75N show some similarity to observations toward IRAS 20126+4104 (Cesaroni et al. 1999). That study concluded that CH3CN was tracing an infalling accretion disk. The resemblance, however, is only strong enough to encourage further observations as described above.
3.4.2 Mass Estimate
We can also approximate the mass in MM1 and MM2 using the measured mm-continuum. We estimate the free-free emission contribution to the 3 mm emission by extrapolating from observations at 1.3 cm (Torrelles et al. 1997) and 3.6 cm (Hunter et al. 1994). The three cm-components of MM1 all have rising spectra from 3.6 cm to 1.3 cm, indicating the sources are partly optically thick. Using the spectral index between 3.6 cm and 1.3 cm to esimate the flux density at 3 mm due to free-free emission would predict 100 mJy. If the sources are optically thin shortward of 1.3 cm, however, we estimate the free-free component would be 20 mJy at = 3 mm. Since we wish to obtain an upper mass limit (see below) and would prefer to overestimate the dust emission, we assume the free-free component of the 3 mm emission of MM1 is 20 mJy. Assuming thermal dust emission accounts for the remaining 3 mm emission (370 mJy) and following the method of Hildebrand (1983), mm-continuum emission is related to the total mass (gas + dust) according to:
| (1) |
where D is the distance to the source, Fν is the continuum flux density, Bν is the Planck function at frequency and is the opacity of dust at . Mtotal is given as a lower limit because the measured flux density may not represent the entire range of dust temperatures present. We assume a gas-to-dust ratio of 100 and thus cm2 g-1 (Carpenter 2000). We assume a frequency index, = 1.5 (Shepherd 2000, Pollack et al. 1994) for the dust opacity. This result is sensitive to the assumed value of Tdust. If we use a lower limit for Tdust = 10 K, however, the relationship above gives an upper mass limit of 440 M⊙ for MM1 (see Table 2). If more than 500 M⊙ were present at any reasonable temperature, we would measure a greater flux density at 3 mm. Since typical values for the mass of clouds that give rise to O-stars are 1,000 M⊙ (see Hunter et al. 2000), we conclude that W75N is unlikely to be forming an O-star. This result is consistent with Hunter et al. (1994) who inferred the spectral types of the three cm sources comprising MM1 to be early B-stars. Since Hunter et al. (1994) did not account for dust absorption or free-free self-absorption, however, the true spectral types may be earlier. The mass upper limit calculated for MM2 using the same method is reported in Table 2.
4 Conclusions
CH3CN (J=6-5) was observed toward W75N using the BIMA interferometer with 2” resolution. Five compact ( 10,000 AU) K-components were detected (K=0-4) toward the peak of MM1 . CH3CN emission is elongated with a deconvolved major-minor axis ratio of 3.4. The major axis coincides with the alignment of three cm-continuum sources reported previously with 0.1” resolution VLA observations. Thus, the elongation is probably caused by multiple sources lying approximately along a straight line projected on the plane of the sky, although we cannot rule out CH3CN tracing out an oblate cloud core. A bipolar outflow was previously detected toward MM1 in CO(J=1-0, J=3-2) and cm-continuum. MM2 and MM3 (detected by Shepherd 2001) lie on opposite sides of MM1 along the outflow axis, indicating that they may be heated by shocks as the outflow interacts with the local interstellar medium.
Analysis of K=2 and 3 emission lines indicates that CH3CN (J=6-5) is optically thick ( 8). Thus, a radiative transfer/statistical equilibrium model which encorporates source kinematics and temperature and density gradients will be required to estimate Trot and N. The results of this study support the previously observed pattern that CH3CN in massive star formation regions tends to be compact ( 104-105 AU) and optically thick in mm-wave transitions.
References
- (1) Cesaroni, R., Felli, M., Jenness, T., Neri, R., Olmi, L., Robberto, M., Testi, L., & Walmsley, C.M. 1999, A & A, 345, 949
- (2) Davis, C.J., Smith, M.D., & Moriarty-Schieven, G.H. 1998, MNRAS, 299, 825
- (3) Davis, C.J., Moriarty-Schieven, G., Eistoffel, J., Hoare, M.G., & Ray, T.P. 1998, ApJ, 115, 1118
- (4) Goldsmith, P.L.; Langer, W.D. 1999, ApJ, 517, 209
- (5) Hildebrand, R.H. 1983, QJRAS, 24, 267
- (6) Hofner, P.; Kurtz, S.; Churchwell, E.; Walmsley, C. M.; Cesaroni, R. 1996, ApJ, 460 359
- (7) Hunter, T.R., Taylor, G.B., Felli, M., & Tofani, G. 1994, A & A, 284, 215
- (8) Hunter, T.R., Churchwell, E., Watson, C., Cox, P., Benford, D.J., Roelfsema, P.R. 2000, AJ, 119, 2711
- (9) Kurtz, S.; Cesaroni, R.; Churchwell, E.; Hofner, P.; Walmsley, C. M. 2000 in Protostars and Planets IV, eds. Mannings, V., Boss, A.P., Russell, S. S. (Tucson: University of Arizona Press) 299
- (10) Mill, J.M., O’Neil, R., Price, S.D., Romick, G., Uy, M., & Gaposchkin, E.M. 1994, J. Spacecraft & Rockets, 31, 900
- (11) Millar, T.J.; Macdonald, G.H. & Gibb, A.G. 1997, A & A, 325, 1163
- (12) Moore, T.J.T., Mountain, C.M., Yamashita, T., Selby, M.J. 1988, MNRAS, 234, 95
- (13) Moore, T.J.T., Mountain, C.M., Yamashita, T., McLean, I.S. 1991, MNRAS, 248, 377.
- (14) H. M. Pickett, R. L. Poynter, E. A. Cohen, M. L. Delitsky, J. C. Pearson, and H. S. P. Muller, J. Quant. Spectrosc. & Rad. Transfer 60, 883-890 (1998)
- (15) Pankonin, V., Churchwell, E., Watson, C. Bieging, J.H. 2001, ApJ, 558, 194
- (16) Pollack, J.B., Hollenbach, D., Beckwith, S., Simonelli, D.P., Roush, T., & Fong, W. 1994, ApJ, 421, 615
- (17) Sault, R. J.; Teuben, P. J.; Wright, M. C. H. 1995, in ASP Conf. Ser. 77, Astronomical Data Analysis Software and Systems, 433
- (18) Shepherd, D. 2001, ApJ, 546, 345
- (19) Testi, L., Hofner, P., Kurtz, S., & Rupen, M. 2000, A & AL, 359, 5
- (20) Torrelles, J.M., Gomez, J.F., Rodriguez, L.F., Ho, P.T.P., Curiel, S., Vazquez, R. 1997 ApJ, 489, 744
- (21) Watt, S., Mundy, L.G. 1999 ApJS, 125, 143
- (22) Welch, W. J. et al. 1996, PASP, 108, 93
- (23) Wilner, D.J., De Pree, C.G., Goss, W.M. and Welch, W.J. 2001, ApJ, 550, L81
- (24) Zhang, Q., Ho, P.T.P,, & Ohashi, N. 1998, ApJ, 494, 636

| Source | W75N |
|---|---|
| Phase center | |
| RA (J2000) | 20h 38m 36.6s |
| DEC | 42∘ 37’ 32” |
| Transitions | CH3CN (J=6-5) K=0-4 |
| Center rest frequency | 110.3701 GHz |
| Spectral resolution | 1.1 km/s |
| Continuum Bandwidth | 200 MHz |
| Antenna HPBW | 96” |
| Synthesized HPBW | 2.5” x 2.2” |
| Synthesized beam position angle | 21∘ E of N |
| Tbrightness conversion | 18.2 K/ (Jy/beam) |
| Max spatial scale | 60” |
| RMSchannel | 136 mJy/beam |
| RMScont | 4.2 mJy/beam |
| Flux calibrator | |
| Mars (Oct 10 1999): | 408 Jy |
| Phase calibrator | |
| 2025+337 (Oct 8-12, 1999) | 2.30.4 Jy |
| Source | MM1 | MM2 |
|---|---|---|
| RA | 20 | 20 |
| DEC | 42 | 42 |
| Peak Sν (mJy/beam) | 80 16 | 45 9 |
| Integrated Sν (mJy) | 390 80 | 200 40 |
| Mass upper limit (M⊙) | 440 | 240 |