12CO mapping of the low-metallicity BCD galaxy Mrk 86
Abstract
We have mapped the 12CO =1-0 and =2-1 line emission in Mrk 86, one of the most metal-deficient Blue Compact Dwarf galaxies so far detected in 12CO. The 12CO emission is distributed in a horseshoe-like structure that follows the locus of the most recent star formation regions. The minimum in molecular-line emission corresponds to the position of an older, massive nuclear starburst. The H2 mass of the galaxy (in the range 0.4-5107 M⊙) and its morphology have been compared with the predictions of hydrodynamic simulations of the evolution of the interstellar medium surrounding a nuclear starburst. These simulations suggest that the physical conditions in the gas swept out by the starburst could have led to the formation of the ring of molecular gas reported here. This result provides an attractive scenario for explaining the propagation (in a galactic scale) of the star formation in dwarf galaxies.
1 Introduction
One of the most intriguing questions about the evolution of Blue Compact Dwarf (BCD) galaxies concerns the mechanism(s) responsible for the triggering and propagation of their star formation activity (Noeske et al. 2000; Papaderos et al. 1996). The majority of BCDs show recent star formation distributed across a large fraction of the optical extent of the galaxy (those BCDs classified as iE by Loose & Thuan 1985) in contrast to the more rare nucleated BCDs (nE type). The formation of density waves, the most commonly suggested propagation mechanism for the star formation in grand-design spirals (see Englmaier & Shlosman 2000 and references therein), is inhibited in BCDs due to their very low total mass. Therefore, a different mechanism must be taking place in a generalized way in these galaxies.
In the case of the BCD galaxy Mrk 86, Gil de Paz, Zamorano, & Gallego (2000; GZG00) proposed that the most recent star formation activity in this object was activated by the evolution of a massive nuclear starburst that swept out large amounts of gas at distances to 0.5-1 kpc. This gas, due to its high column density, would have become molecular (see Franco & Cox 1986) probably leading to the formation of new generations of stars.
In this Letter we report the discovery of a horseshoe-like structure of molecular gas around the nuclear starburst in Mrk 86. Using hydrodynamic simulations of the evolution of the interstellar medium around such a nuclear starburst, we show that the physical conditions in the gas swept out by the starburst can plausibly lead to the formation of such a massive molecular-gas ring.
The analysis of the 12CO-line emission in Mrk 86 (Z=1/15-1/5 Z⊙; GZG00) not only contributes to an understanding of the star formation propagation mechanisms in BCDs, but also can shed light on the poorly known excitation conditions of the molecular gas and the CO shielding in low-metallicity galaxies (see Walter et al. 2001 and references therein). In this sense, Mrk 86 is, after I Zw 36 (Young et al. 1995), the lowest metallicity BCD detected so far in CO (Sage et al. 1992) and, now, the first to be mapped in that line.
2 Observations and Results
We have simultaneously mapped the 12CO =1-0 and the =2-1 emission in Mrk 86 using the IRAM 30 m MRT at Pico de Veleta (Granada, Spain) from 2001 May 9 to May 17. Four different receivers were used, two operating at 1.3 mm and two at 3 mm (V and H polarizations). All the spectra were obtained in wobble switching mode with azimuthal amplitude of 4′. The pointing accuracy of the telescope (2″ r.m.s.) was checked every hour using nearby quasars. Data calibration and reduction was performed following the standard procedure within the IRAM-GAG software package.
The spatial resolution of these observations is 12″ and 22″ for CO 2-1 and 1-0, respectively. A grid of 30 observed points covers a diamond-shaped region fully sampled in the 1-0 transition (x=y=12″). The average time spent per point was 40 min (on+off). The r.m.s. (in Tmb scale) of the individual CO(1-0) [CO(2-1)] spectra ranges between 2-6 mK [4-29 mK] for a final spectral resolution of 5.21 km s-1 [3.26 km s-1].
In Figure 1a we show our CO spectra averaged over the 30 positions observed. For the 1-0 and 2-1 transitions the line centroids are =4421 km s-1 and 4423 km s-1 and the 20% peak line widths 894 km s-1 and 654 km s-1, respectively. The averaged CO spectra obtained are quite symmetric around the galaxy systemic velocity (=444 km s-1). In comparison, however, the 21 cm Hi-line profile (Swaters 1999) is much more intense in the interval ( to 60 km s-1) than at lower velocities (60 km s-1 to ). The CO spectra at the galaxy optical center are shown in Figure 1b. This position coincides with that previously observed by Sage et al. (1992) also using the IRAM 30 m telescope.
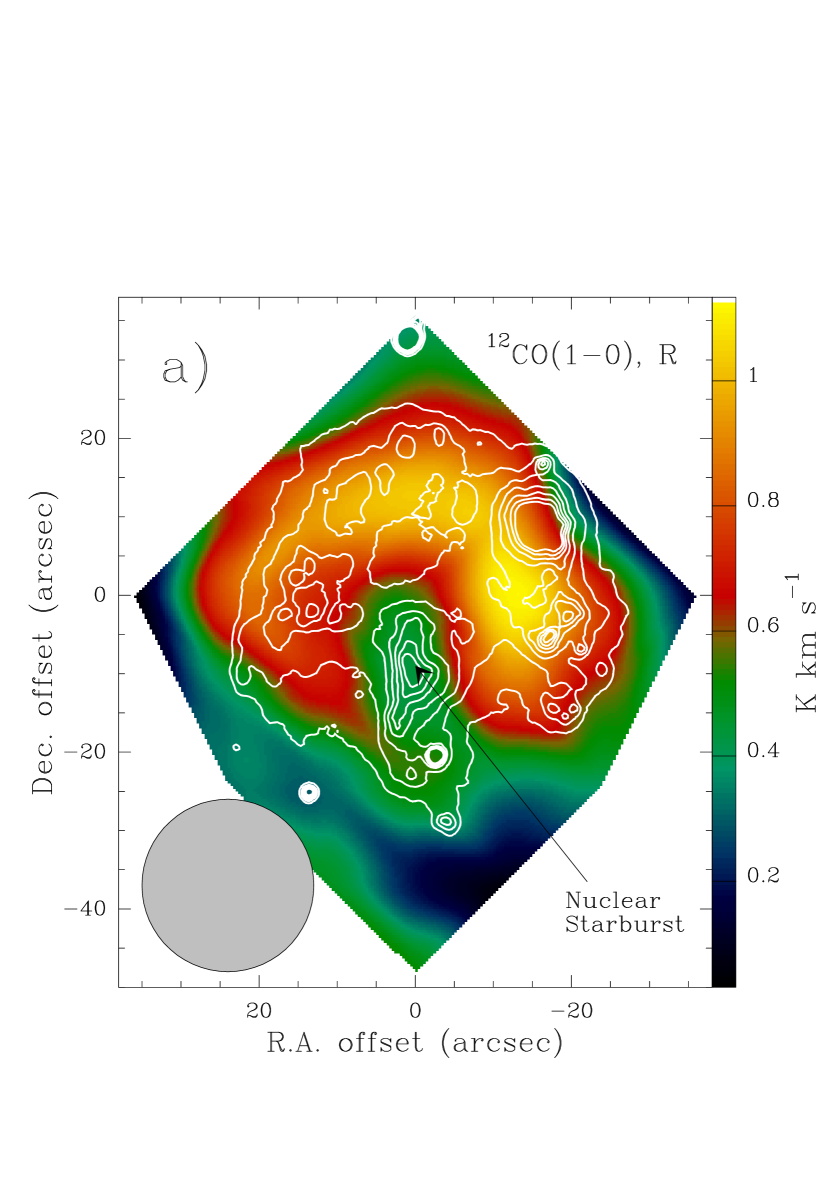
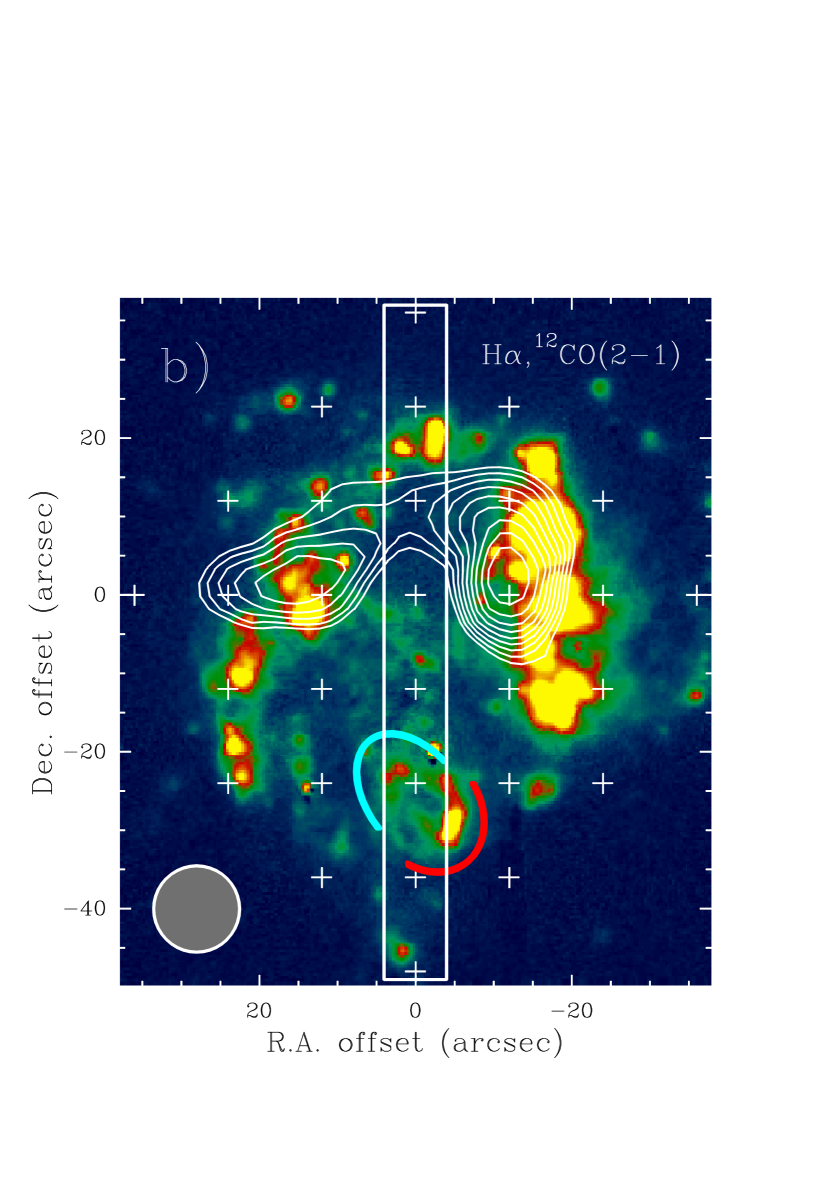
CO maps of integrated intensity are presented in Figure 2. The left panel shows the molecular gas emission distributed in a horseshoe-like structure with a diameter of 35″which corresponds to 1.2 kpc (where we have assumed a distance of 6.9 Mpc; Sharina et al. 1999; SKT99). The molecular gas closely follows the distribution of the star-forming regions (traced by H; see right panel) with a relative minimum at the position of the nuclear starburst (GZG00). This starburst is apparent in the R-band image 7″ south of the galaxy center.
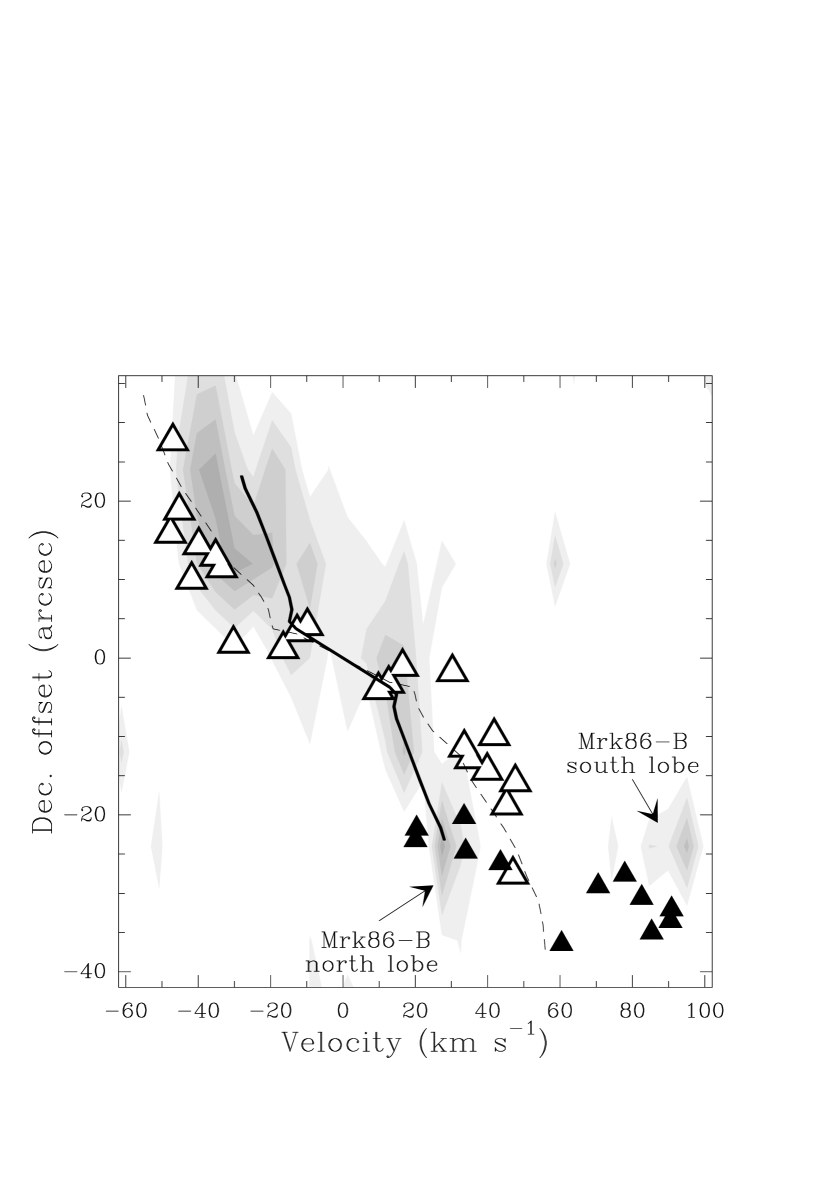
In Figure 3 we show the CO(1-0) position-velocity (p-v) diagram along PA=0°. The rotation axis of Mrk 86 is oriented at PA80° (Gil de Paz et al. 1999; GZG99 hereafter), and therefore, the previous p-v diagram is a good representation of the radial velocity curve of the molecular gas. The CO p-v diagram obtained is similar to that of the ionized gas (for the same PA), although the radial velocity gradient for the molecular gas component seems to be slightly lower than that of the ionized gas. The difference observed, however, is not conclusive because of the errors in the measured velocities and, specially, the effect of beam smearing in our CO(1-0) data. We also note in this diagram the presence of CO(1-0) blueshifted and redshifted emission located at offset 24″. These components are the molecular counterparts to the bubble Mrk 86-B lobes detected in the optical. The bubble expansion velocity derived from the molecular gas is 312 km s-1, very similar to that obtained from the optical emission lines, 34 km s-1 (GZG99).
3 Molecular gas physical properties
In order to study the physical conditions in the molecular gas we have derived the 2-1/1-0 brightness temperature ratio in Mrk 86. The mean values of these ratios are 1.340.46 and 0.400.14 under Uniform Filling and Point Source approximations, respectively, using only those positions where both transitions are clearly detected. Although the Point Source approximation is usually assumed for BCD galaxies (Sage et al. 1992; Meier et al. 2001), our CO maps suggest that the emission in Mrk 86 arises in an extended structure formed by several (most likely unresolved) clouds. Thus, we have decided to use a more precise approach for deriving the 2-1/1-0 brightness temperature ratio. We deconvolve our CO(1-0) map with a 22″ gaussian beam. Then, we determine the 1-0 and 2-1 line intensities at each of the positions detected in both transitions along with the size of the emitting regions (in the deconvolved map) inside the 1-0 and 2-1 beams for each of these positions. The average of the 2-1/1-0 brightness temperature ratios derived at each point yields a 2-1/1-0 brightness temperature ratio of 1.060.40. We have not found any systematic difference between the 2-1/1-0 ratio at the position of the nuclear starburst and the outermost regions of the galaxy, which indicates that there is no significant change of the excitation conditions.
Meier et al. (2001) failed to detect 12CO(3-2) at the center of Mrk 86 and provided a very low upper limit of 0.45 to the 3-2/1-0 brigthness temperature ratio using the 1-0 intensity published by Sage et al. (1992). However, the value reported by Sage et al. at this position, 1.12 K km s-1, is a factor of two larger than that measured by us, 0.56 K km s-1. This difference could be due to calibration or pointing inaccuracies. Therefore, we have decided to adopt a more conservative upper limit of 0.9 to the 3-2/1-0 ratio.
Under the LTE and optically thick assumptions we can estimate the excitation temperature () of the molecular gas from the 2-1/1-0 and 3-2/1-0 brightness temperature ratios. In particular, from 2-1/1-0 we infer 6 K and, according to the 3-2/1-0 upper limit, 45 K. From the predictions of Large Velocity Gradient models and the 2-1/1-0 and 3-2/1-0 ratios measured we have also derived a range of compatible molecular gas densities () and kinetic temperatures (). A [CO/H2] abundance of 810-6 (/10) and a velocity gradient of 1 km s-1 pc-1 are assumed (see e.g. Meier et al. 2001). The line ratios measured suffer from a strong degeneracy in the physical properties of the molecular gas, and only rough constraints can be obtained. We can only conclude that, if 500 cm-3, then the molecular gas cannot be warmer than =40 K.
We have also obtained a variety of estimates of the mass of molecular gas in Mrk 86. First, we have computed the molecular mass under the optically-thin approximation from the 12CO(1-0) integrated luminosity ( = 2106 K km s-1 pc2) adopting an average value for the excitation temperature ( = 20 K). This yields = 4106 M⊙. It is worth noting that this transition is rarely optically thin (13CO and C18O transitions would be more appropriated) and so the value given above provides only a rough but firm lower limit to the actual molecular mass of the galaxy. From the 12CO(1-0) line width ( = 75 km s-1) we can also estimate the molecular gas mass assuming virial equilibrium, which leads to = 7108 M⊙. Again, the value derived, although represents a firm upper limit, is very far from the actual molecular mass since the gas velocities measured are supported by rotation. Moreover, a large fraction of the mass in the galaxy central regions is in the form of stars (GZG99).
An estimate of the H2 mass can be also obtained using a -to- conversion factor appropriate to the low metallicity of Mrk 86 (/; see e.g. Barone et al. 2000). The dependence of this factor on metallicity was studied by Arimoto et al. (1996; A96) using the virial masses and CO luminosities of Giant Molecular Clouds in nearby galaxies. These authors proposed the following relation, log (/)=[O/H]8.93, where is the Milky Way conversion factor, 1.561020 molecules cm-2 (K km s-1)-1 (Hunter et al. 1997). The average value that we adopt for the gas in Mrk 86 is 1/10th the Solar value, which yields = 1.61021 molecules cm-2 (K km s-1)-1. From this value and the CO luminosity given above we derive a molecular gas mass (helium excluded) of =5107 M⊙.
Based on recent studies of low metallicity BCD galaxies we believe, however, that the A96 relation is probably over-estimating the molecular gas mass in those low-metallicity BCDs detected in CO, and, in particular, the molecular mass given above. Observations of the SMC carried out by Rubio et al. (1993) have shown that the -to- conversion factor depends on the spatial scale of the CO emitting region considered: at spatial scales of 10-20 pc is only slightly higher than while at larger scales (100 pc) its value increases dramatically. This suggests the presence of large amounts of Hi or hidden H2 (not associated with CO) between the dense clumps where the CO emission arises. The lack of detection of diffuse H2 in I Zw 18 by FUSE (Vidal-Madjar et al. 2000) and the very low upper limit derived to the [CII]/CO line ratio in I Zw 36 (Mochizuki & Onaka 2001) suggest that, in the case of the low-metallicity BCDs, most of the H2 is probably in the form of these dense clumps. In dwarf irregular galaxies like IC 10 the intense [CII] emission observed has been argued as due to the presence of large amounts of H2 with no CO emission associated (Madden et al. 1997). These results suggest that in low-metallicity BCDs most of the H2 is probably associated with emitting CO and, therefore, the global -to- conversion factor would be similar to the local value derived from the analysis of the CO line ratios. Noteworthly, Large Velocity Gradient modeling of the few low-metallicity BCDs detected in 12CO favors local conversion factors lower than the A96 predictions and similar, in some cases, to the Galactic value (Sage et al. 1992; Barone et al. 2000). Unfortunately the lack of observations on optically-thin 13CO and C18O lines, which would provide an accurate determination of the physical conditions in the gas, makes difficult to obtain definitive conclusions in this sense. Finally, it is also worth noting that other authors have proposed a shallower dependence of the -to- conversion factor on metallicity than that argued by Arimoto et al. (1996). For example, using the relation proposed by Wilson (1995) we derive a molecular mass of =2107 M⊙.
Therefore, we conclude that the H2 mass of Mrk 86 is certainly in the range 0.4-70107 M⊙ (based on the optically-thin and virial approximation estimates) with a most probable value in the range 0.4-5107 M⊙. The latter range is given by the uncertainties expected in using the metallicity-scaled -to- conversion factor.
4 The origin of the molecular horseshoe: Hydrodynamic simulations
The spatial distribution of the recent star formation regions, and the age difference between these regions (5-10 Myr old) and the nuclear starburst (30 Myr old) suggest that the development of the starburst could have induced the recent star formation activity in Mrk 86 (GZG00). Indeed, the energy injected during the evolution of the nuclear starburst could have resulted in the sweeping out of large amounts of interstellar gas to large galactocentric distances. This gas would have eventually reached gas surface densities high enough to lead to the formation of molecular gas and the subsequent formation of new stars. Our CO 1-0 and 2-1 maps show that the molecular gas in this galaxy is distributed in a horseshoe-like structure around the center of the galaxy, which is in nice agreement with the predictions of this scenario.
In order to check the scenario described above we have modeled the evolution of the ISM surrounding the nuclear starburst in Mrk 86 and compared the results obtained with the molecular-gas content and distribution derived from our CO data. For the calculations we have used our 3D code based on the thin layer approximation (Silich & Tenorio-Tagle 1998) which was modified to take into account a fast transition from the energy-dominated to a momentum-dominated phase. The comparison of our spherically symmetric test runs with the analytic solution of Koo & McKee (1992) yielded agreement to better than 3%.
We have used a three-component model for the galaxy gravitational field that includes stellar disk, dark matter, and an homogeneous, spherical central star cluster. The stellar disk gravitational potential was calculated as in Strickland & Stevens (2000) using a Miyamoto & Nagai (1975) stellar-disk model with a total stellar mass Mdisk=5109 M⊙ and characteristic scale heights in the radial and vertical directions of 700 and 400 pc, respectively. For the dark matter (DM) we used an isothermal profile and derived the DM component parameters from the Mac Low & Ferrara (1999) model for a =8.5108 M⊙ (Swaters 1999). The rotation curve derived for this model is plotted in Figure 3 along with the radial velocities measured from the ionized gas. The ISM gas distribution was derived using the Silich & Tenorio-Tagle (1998) semi-analytical model with a mean interstellar turbulent velocity dispersion of 35 km s-1 derived from our optical data (GZG99).
This model indicates that the gravitational field of Mrk 86 is dominated by the massive stellar disk component, which leads to a high concentration of gas to the galactic plane and fast, starburst-blown, shell blow-out into the intergalactic medium. This results in a fast drop of the inner bubble thermal pressure, growth of the reverse shock radius (which soon reaches a midplane shell position) and a fast transition between the energy-dominated to the momentum-dominated phase. Henceforth the midplane ring moves outwards under the action of the accumulated momentum and the superwind ram pressure (Tenorio-Tagle & Muñoz-Tuñon 1998). About 15-20 Myr after the starburst ignition the gas in the ring reaches column densities above the critial value for molecular gas formation (51020 (Z⊙/Z); Franco & Cox 1986). At this moment the expansion velocity derived for the ring is close to zero.
For a range of parameters (distance, inclination, stellar-disk and starburst mass, gas velocity dispersion; Gil de Paz et al. 2002, in preparation) compatible with previous studies on Mrk 86 (SKT99; GZG99; GZG00) our models lead to the formation of a ring with a H2 mass of about 3106 M⊙ and a radius of formation of 0.5-1 kpc. The uncertainty in this mass can be as high as a factor of 5, considering our poor knowledge of some of the galaxy properties required for the galaxy evolution modeling (galaxy distance, stellar disk and starburst masses, interstellar gas metallicity, etc). This result suggests that, if the scenario proposed by GZG00 is correct, either the -to- conversion factor is smaller than that predicted by the A96 relation (as it has been discussed in the Section 3) or a significant amount of molecular gas was already present at large galactocentric distances prior to the evolution of the nuclear starburst.
A noteworthy result of our hydrodynamical simulations is that the ring should expand with a rotation velocity which would be below the galactic-disk rotation velocity. A shift between the ionized and molecular gas rotation velocities could be recognized in Figure 3. However, as we commented in Section 2 the same observed effect could be partially due to beam smearing in our CO(1-0) data. It is also worth mentioning that the difference between the molecular ring circular velocity and the regular galactic rotation predicted by the model can be reduced by taking into account an exchange of mass and momentum between the stellar disk component and the expanding molecular ring (see McKenzie et al. 1978).
Finally, the observation of a molecular horseshoe instead of a complete ring could be the result of an anisotropic evolution of the swept out interstellar material, either due to the offset of the nuclear starburst relative to the galaxy dynamical center (7″ South; GZG00) or a prior inhomogeneous distribution of the ISM, as suggested by the asymmetry of the 21 cm Hi-line profile.
Summarizing, we have observed the 12CO =1-0 and 2-1 emission from the low-metallicity BCD galaxy Mrk 86. We have discovered a horseshoe-like structure in CO emission with a total molecular gas mass of 0.4-5107 M⊙. Both its mass and morphology reasonably agree with the predictions of hydrodynamical simulations for the evolution of a starburst located close to the galaxy center. These simulations predict the accumulation of 3106 M⊙ of molecular gas at a distance of 0.5-1 kpc during the 20-25 Myr of starburst-driven shell evolution. Our numerical model also predicts a difference between the rotation velocity of the molecular ring and the stellar disk that could be used as an additional observational test for this scenario.
References
- Arimoto et al. (1996) Arimoto, N., Sofue Y., & Tsujimoto, T. 1996, PASJ, 48, 275 (A96)
- Barone et al. (2000) Barone, L. T., Heithausen, A., Hüttemeister, S., Fritz, T., & Klein, U. 2000, MNRAS, 317, 649
- Englmaier & Shlosman (2000) Englmaier, P., & Shlosman, I. 2000, ApJ, 528, 677
- Franco & Cox (1986) Franco, J., & Cox, D. P. 1986, PASP, 98, 1076
- Gil de Paz (2000) Gil de Paz, A. 2000, Ph. D. thesis, Universidad Complutense de Madrid
- Gil de Paz et al. (1999) Gil de Paz, A., Zamorano, J., & Gallego, J. 1999, MNRAS, 306, 975 (GZG99)
- Gil de Paz et al. (2000) Gil de Paz, A., Zamorano, J., & Gallego, J. 2000, A&A, 361, 465 (GZG00)
- Hunter et al. (1997) Hunter, S. D., et al. 1997, ApJ, 481, 205
- Koo & McKee (1992) Koo, B.-C., & McKee, C. F. 1992, ApJ, 388, 93
- Loose & Thuan (1985) Loose, H.-H., & Thuan, T. X. 1985, in Star-Forming Dwarf Galaxies, ed. D. Kunth, T. X. Thuan, & J. T. T. Van (Editions Frontières)
- Mac Low & Ferrara (1999) Mac Low, & M.-M., & Ferrara, A. 1999, ApJ, 513, 142
- Madden et al.. (1997) Madden, S. C., Poglitsch, A., Geis, N., Stacey, G. J., & Townes, C. H. 1997, ApJ, 483, 200
- McKenzie et al. (1978) McKenzie, J. F., Westergaard, N. J., & Rasmussen, I. L. 1978, A&A, 70, 733
- Meier et al. (2001) Meier, D. S., Turner, J. L., Crosthwaite, L. P., & Beck, S. C. 2001, AJ, 121, 740
- Miyamoto & Nagai (1975) Miyamoto, M., & Nagai, R. 1975, PASJ, 27, 533
- Mochizuki & Onaka (2001) Mochizuki, K., & Onaka, T. 2001, A&A, 370, 868
- Noeske et al. (2001) Noeske, K. G., Guseva, N. G., Fricke, K. J., Izotov, Y. I., Papaderos, P., & Thuan, T. X. 2000, A&A, 361, 33
- Papaderos et al. (1996) Papaderos, P., Loose, H.-H., Fricke, K. J., & Thuan, T. X. 1996, A&A, 314, 59
- Sage et al. (1992) Sage, L. J., Salzer, J. J., Loose, H.-H., & Henkel, C. 1992, A&A, 265, 19
- Sharina et al. (1999) Sharina, M. E., Karachentsev, I. D., & Tikhonov, N. A. 1999, Astronomy Letters, 25, 322 (SKT99)
- Silich & Tenorio-Tagle (1998) Silich, S. A., & Tenorio-Tagle, G. 1998, MNRAS, 299, 249
- Strickland & Stevens (2000) Strickland, D. K., & Stevens, I. R. 2000, MNRAS, 314, 511
- Swaters (1999) Swaters, R. A. 1999, Ph. D. thesis, Rijksuniversiteit Groningen
- Tenorio-Tagle & Muñoz-Tuñon (1998) Tenorio-Tagle, G., & Muñoz-Tuñon, C. 1998, MNRAS, 293, 299
- Vidal-Madjar et al. (2000) Vidal-Madjar, A., et al. 2000, ApJ, 538, 77L
- Walter et al. (2001) Walter, F., Taylor, C. L., Hüttemeister, S., Scoville, N., & McIntyre, V. 2001, AJ, 121, 727
- Wilson (1995) Wilson, C. D. 1995, ApJ, 448, L97
- Young et al. (1995) Young, J. S., et al. 1995, ApJS, 98, 219