On the Physical Origin of Ovi Absorption-Line Systems
Abstract
We present a unified analysis of the Ovi absorption-lines seen in the disk and halo of the Milky Way, high velocity clouds, the Magellanic Clouds, starburst galaxies, and the intergalactic medium. We show that these disparate systems define a simple relationship between the Ovi column density and absorption-line width that is independent of the Oxygen abundance over the range O/H 10% to twice solar. We show that this relation is exactly that predicted theoretically as a radiatively cooling flow of hot gas passes through the coronal temperature regime - independent of its density or metallicity (for O/H 0.1 solar). Since most of the intergalactic Ovi clouds obey this relation, we infer that they can not have metallicities less than a few percent solar. In order to be able to cool radiatively in less than a Hubble time, the intergalactic clouds must be smaller than 1 Mpc in size. The implied global heating rate of the warm/hot IGM is consistent with available sources. We show that the cooling column densities for the Oiv, Ov, Nev, and Nevi ions are comparable to those seen in Ovi. This is also true for the Li-like ions Neviii, Mgx, and Sixii (if the gas is cooling from K). All these ions have strong resonance lines in the extreme-ultraviolet spectral range, and would be accessible to at 0.2 to 0.8. We also show that the Li-like ions can be used to probe radiatively cooling gas at temperatures an order-of-magnitude higher than where their ionic fraction peaks. We calculate that the H-like (He-like) O, Ne, Mg, Si, and S ions have cooling columns of (few) cm-2. The properties of the Ovii, Oviii, and Neix X-ray absorption-lines towards PKS 2155-304 may be consistent with a scenario of radiatively cooling gas in the Galactic disk or halo.
1 Introduction
Diffuse gas in the temperature range of to K (sometimes called “coronal gas”) is of considerable interest in many astrophysical contexts. The peak of the radiative cooling curve for plasmas lies at the low temperature end of this range for metallicities greater than a few percent solar (e.g., Sutherland & Dopita 1993), and since the cooling curve declines with increasing temperature in the coronal regime, this gas will be thermally unstable.
In the interstellar medium (ISM) of our own galaxy, coronal gas is created as a consequence of mechanical heating associated with massive stars - supernovae and stellar winds (e.g., Cox & Smith 1974; Weaver et al. 1977). It is believed that coronal gas traces the interface between hotter (X-ray-emitting) gas and cooler clouds. The rate of mass exchange between the hot and cool phases and the related issue of the fraction of the volume of the disk occupied by the hot gas are crucial components of models of the global structure of the ISM (e.g. McKee & Ostriker 1977).
Since the sound speed in coronal gas exceeds the typical velocity dispersion in the disk of a star-forming galaxy, coronal gas created in the disk can - in the absence of rapid radiative cooling - flow upward to large vertical scale-heights and occupy the lower halo of the galaxy (Shapiro & Field 1976; Bregman 1980; Norman & Ikeuchi 1989). On larger scales, since the virial temperature for typical galaxies and small galaxy groups lies near the upper limit of the coronal regime, this gas may be an important component of the large-scale gaseous halos of galaxies and of the intra-group medium (e.g., Norman & Silk 1979; Verner, Tytler, & Barthel 1994; Mulchaey et al. 1996).
The most significant repository of coronal gas is the intergalactic medium (IGM). Gas and stars inside galaxies account for only 10 to 20% of the baryonic content of the universe (e.g., Fukugita, Hogan, & Peebles 1998). Numerical cosmological simulations imply that the bulk of the “missing baryons” lies outside galaxies, groups, or clusters (e.g., Cen & Ostriker 1999; Davé et al. 2001). They also imply that shocks generated by the formation of large-scale structure (and possibly by galactic winds) have heated a substantial fraction of these baryons to temperatures in the coronal regime (the Warm-Hot Intergalactic Medium, or WHIM).
The mission ( - Moos et al. 2000) has opened the coronal-phase in the ISM and IGM in the low-z universe to direct observation via the Ovi1032,1038 doublet. Oxygen is the most cosmically-abundant metal. For collisional ionization equilibrium (CIE), Ovi is a significant species for K. It is also a byproduct (and hence an important tracer) of hotter radiatively-cooling gas (e.g., Edgar & Chevalier 1986).
To date, has detected the Ovi line in absorption in the disk (Jenkins, Bowen, & Sembach 2001) and halo (Savage et al. 2000) of the Milky Way, in the periphery of high velocity clouds (Sembach et al. 2000), in the interstellar medium of the Large and Small Magellanic Clouds (Hoopes et al. 2002; Howk et al. 2002), in several starburst galaxies (Heckman et al. 2001a,b; Martin et al. 2002), and in the IGM (Oegerle et al. 2000; Sembach et al. 2001; Savage et al. 2002).
In each case, the authors have discussed the origin and physical state of the absorbing gas in the particular astrophysical context of their investigation. Our goal in the present paper is to consider the class of Ovi absorbers more generally. In particular, we will show below that all of the above classes of Ovi absorbers obey the simple relationship between the Ovi column density and line width that is predicted as radiatively cooling hot gas passes through the coronal regime.
2 Data Analysis & Results
2.1 Data Analysis
In this investigation we make use of existing Ovi data in the literature and in a few cases supplement this with additional data that are currently being analyzed. The primary quantities pertinent to our investigation are the column density of Ovi and the velocity width (line profile second moment) of the Ovi absorption in different astrophysical regions. We consider data that have been published for the following locations: Galactic disk (Jenkins 1978; data), Galactic halo and high velocity clouds (Savage et al. 2000, 2002; Sembach et al. 2000, 2001, 2002; Richter et al. 2001a, 2001b; Heckman et al. 2001a,b), LMC (Howk et al. 2002), SMC (Hoopes et al. 2002), starbursts (Heckman et al. 2001a, 2001b), and the IGM ([PG0953+415: Tripp & Savage 2000 – STIS; Savage et al. 2002]; [3C 273: Sembach et al. 2001]; [H 1821+643: Tripp, Savage, & Jenkins 2000 – STIS; Oegerle et al. 2000]).
Unless specified otherwise, these results are based upon data. In most cases, information is available for only the Ovi1032 line since the 1038 Å line is blended with other ISM absorption features along the sight lines. Column densities were obtained by integrating the apparent optical depths of the 1032 Å lines, and the line widths were calculated as b over the same velocity ranges used to calculate the column densities.
We retrieved the data for I Zw 18, Mrk 54, and NGC 7673 from the archive to supplement the starburst sample obtained by Heckman et al. (2001a, 2001b). We treated the spectra in a manner similar to that of the data in our previous studies. For I Zw 18, we find in the km s-1 velocity range centered on the systemic velocity km s-1. This limit is roughly an order of magnitude smaller than the Ovi columns found for other starbursts. For Mrk 54 and NGC 7673 we find = 14.9 and 15.0 and b = 150 and 180 km s-1 respectively.
2.2 Results & Possible Selection Effects
Our principal result is shown in Figure 1, where we have plotted the Ovi column density () and line widths (b-values) for the various systems listed above.
Taken together, the various Ovi systems define a clear relationship that spans over two-orders-of magnitude in column density and over one order-of-magnitude in line width. The relation is a tight one, with a scatter of only 0.1 dex in log b at a given value of . Above log b 1.6, the column density increases linearly with line width, while at lower line widths the relation rolls over and steepens. Different types of Ovi systems preferentially populate different regions in parameter space, but with considerable overlap. The Galactic disk, high velocity cloud, and IGM systems tend to have the smallest column densities and line widths, and the starbursts have the largest. The Magellanic Cloud and Milky Way halo systems are intermediate, overlapping well with the low-b, low-column starburst systems. We will discuss the physical interpretation of this correlation in detail in section 3 below. We will show there that the observed correlation is well fit by a simple model with essentially no adjustable parameters.
Before proceeding to this discussion, it is important to establish that the correlation in Figure 1 is not due to an observational selection effect. More specifically, for lines in the linear portion of the curve-of-growth, the ratio of the column density and line width is just proportional to the optical depth of the absorber. Broad lines associated with gas of small column density will correspond to small optical depths. Such shallow lines might elude detection, leading to an absence of detected lines in the lower right corner of Figure 1. The dotted line in the lower right corner of Figure 1 indicates the expected behavior for a line with cm-2 km s-1, the approximate detection threshold for the Ovi data considered.
We believe this selection effect is not responsible for the correlation in Figure 1 for several reasons. First, it would not account for the absence of points in the upper left corner of Figure 1. Lines produced by gas with a large column density and small line width would be optically-thick and black at line center. These lines would be easy to detect and recognize, if such gas were commonplace.
Second, Ovi absorption is already seen by in essentially all the sight lines through the Galactic disk and halo, near high velocity clouds, in the Magellanic Clouds, and in starbursts (except when the relevant wavelength range was contaminated by other strong lines). Thus, only in the case of the intergalactic clouds (whose redshifts are not known a priori) could selection against weak, broad lines come into play.
In fact, larger samples of Ovi absorption systems in the Galactic halo (Savage et al. 2002) and in high velocity clouds (Sembach et al. 2002) further strengthen the relationship shown in the figure. These larger samples are particularly significant because they are obtained using the light of quasars and active galactic nuclei as background sources. These objects have very smooth ultraviolet continua, thus minimizing continuum placement uncertainties for any intervening Ovi absorption features. Numerous broad features exist within those samples, but they typically follow the trend shown in Figure 1. The best example of a broad, weak absorption wing is given by Sembach et al. (2001) for the Galactic Ovi absorption in the direction of 3C 273 at velocities km s-1. Such absorption wings are relatively uncommon and fall well above the detection threshold indicated in the figure.
To further illustrate this, we show in Figure 2 spectra of a broad (log b = 2.25) redshifted Ovi synthetic absorption-line added to a typical spectrum. In the the three cases plotted, the line has a central residual intensity of 85% (corresponding to the detection threshold in Figure 1), 28% (roughly corresponding to the solid line passing through the data points in Figure 1), and 64% (intermediate between the previous two). The signal-to-noise in the the continuum is representative of the data plotted in Figure 1. It seems clear that the lack of broad, weak Ovi lines in Figure 1 can not be purely due to detectability issues.
3 Discussion
3.1 The Physics of Radiatively Cooling Gas
Consider the generic situation in which gas cools radiatively from an initial temperature and density (e.g., Edgar & Chevalier 1986). The total column density of cooling gas is given by , where is the cooling time and is the rate of cooling per unit area (cm-2 s-1). The ratio has dimensions of velocity - an expression of mass conservation in the cooling gas. Thus, the total cooling column density can be written as . In the case of radiative cooling of gas with temperature and metallicity , , where is the cooling function. Thus .
The characteristic velocity in the above expression has slightly different physical meanings in different contexts. For example, in the case of gas cooling behind a shock the appropriate velocity is the postshock flow velocity in the Ovi zone, which is related to the cooling length (hence ). In gas collapsing in a cooling instability the characteristic size of the cooling region is , where is the isothermal sound speed . Thus, the appropriate velocity to use in this case is the sound speed.
The expression shows explicitly that is independent of density for radiative cooling. Moreover, at coronal temperatures radiative cooling is dominated by resonance lines due to metals (primarily Oxygen for log = 5.0 to 5.6, Neon for log = 5.6 to 5.9, and Iron at higher temperatures). Thus, . 111The cooling functions computed by Sutherland & Dopita (1993) show that for coronal gas in CIE, is valid for Oxygen and Neon abundances few % solar. For the non-equilibrium cases they consider, the proportionality holds for 10% solar. Note that their models are parameterized by the Fe abundance, and they assume that [O/Fe] = [Ne/Fe] = +0.5 dex for [Fe/H] -1.0. Taking the ionic fraction of Ovi as , we have . This column should properly be calculated as a path-integral through the cooling column of gas. However, since is appreciable over a rather narrow range in temperature centered at K () for CIE, can be approximated by evaluating the above expression for . This yields cm-2 for km s-1. 222We note that the above estimate assumes that the gas is optically thin to its cooling radiation. In CIE at K the most important coolants are (in rank order) the O V629, O V1218, and O VI1032,1038 lines which together carry 80% of the total cooling (using the MEKAL plasma code). Based on the observed O VI columns and the implied O V columns for cooling gas (Table 1), we find that the effective cooling rate would be reduced by 0.0 to 0.2 dex for the systems in Figure 1.
This simple estimate is confirmed by more detailed calculations of radiatively cooling gas. Edgar & Chevalier (1986) have computed Ovi columns for the generic case in which hot gas cools from K. They consider isobaric, isochoric, and intermediate cases and find km s cm-2. Calculations of collisionally-ionized gas behind a high-speed radiative shock (Dopita & Sutherland 1996) give values for cm-2 for shock speeds ranging from 200 to 500 km s-1 (postshock flow speeds of 50 to 125 km s-1). 333For 300 km s-1, higher Ovi columns can be produced via photoionization of preshock gas by EUV radiation from the shocked gas, if this gas is optically-thick to the radiation.
Begelman & Fabian (1990) have considered “turbulent mixing layers” that arise at the interface between a flow of hot gas past cool gas. The mixing of hot and cool gas creates gas at intermediate temperatures which then cools radiatively. Their model implies , where is the turbulent velocity and is a dimensionless efficiency factor which they argue is of order unity. Their equation (4) leads to a predicted Ovi column of cm-2 for a turbulent velocity of 100 km s-1 and a mixing layer temperature of K (=), where we have used and for CIE from Sutherland & Dopita (1993).
We can also cast results for conductively heated gas in the same terms. For the case of saturated conduction (Cowie & McKee 1977), the heat flux is given by where is the isothermal sound speed, is the gas pressure, and is a dimensionless constant of order unity. If we balance this heat flux by radiative cooling we get , where is the thickness of the conductively-heated interface. Combining these relations, we have . Apart from constants of order unity, we recover the same expression as that above for (where ). 444In the case of classical (unsaturated) conduction, similar arguments give , where is the thermal conductivity (Cowie & McKee 1977). While is still independent of , is no longer independent of metallicity, but will scale as . For solar metallicity and CIE at this predicts cm-2.
A robust conclusion emerges from the above. The characteristic Ovi column density in radiatively cooling coronal gas is essentially independent of density, metallicity, and the heating mechanism. It depends only on the value for , the characteristic cooling flow speed.
3.2 Comparison to the Data
In order to compare the predictions of the model described above to the results in Figure 1 we need to relate the observed line width to the cooling flow velocity .
In the absence of a flow, the Ovi lines will have an irreducable intrinsic width due purely to thermal broadening: km s-1 for K. The observed line broadening is due to the combination of the thermal broadening and that produced by the cooling flow: b. We identify with the cooling flow velocity that sets the Ovi column density. We have therefore computed the relation between and bobs expected for radiatively cooling gas with bthermal corresponding to and K (chosen as representative bounds for the collisionally ionized gas).
The fit of this relationship to the data is excellent. It is important to emphasize that this model has essentially no tunable parameters (apart from , whose range of allowed values is robustly set by simple physics). In particular, this model naturally explains the linear proportionality between bobs and for large bobs (b btherm), the value of the ratio /bobs in the “linear regime”, and the “turnover” in the relationship at small bobs (when b btherm). 555A multiplicity of velocity components at different velocities may also affect the observed line widths. If identical components have the same central velocity, they would follow the linear relationship shown in the figure (neglecting thermal broadening). If, however, the components are separated by an amount , there will be an additional broadening that will cause deviations from this linear relationship. We have shown the curves for a set of three identical components having b = 17 km s-1 and symmetrical separations of = 0, 10, 20, and 30 km s-1 about the central component (thin solid lines). Larger values of move points further to the right in this plot.
A crucial prediction of the radiatively cooling scenario is that the relationship between Ovi column density and line width should be independent of the metallicity of the cooling gas, provided that the metallicity is greater than 0.1 solar. This prediction is directly confirmed by Figure 1, which includes Ovi systems that span a metallicity range from 10% solar (SMC sightlines and the starburst NGC1705) through solar (Milky Way disk and halo and the starburst NGC3310) to several times solar (the M83 starburst nucleus).
Our only probe of the regime where metallicity effects should become significant is the extremely metal-poor starburst I Zw 18 (O/H = 2%). Interestingly, we have only an upper limit to the Ovi absorption in this case: /b cm-2 per km s-1. This is about an order-of-magnitude below the average ratio seen for the other starbursts in Figure 1. Since it is likely that the metallicity in the bulk of the ISM of I Zw 18 is even lower than the 2% solar value in the HII regions (e.g. Thuan et al. 2002), the absence of detectable Ovi absorption in this galaxy is consistent with our model.
The correlation in Figure 1 is clearly a sequence along which the dynamical state of the Ovi absorbers changes significantly. Dividing the measured b-values by the speed-of-sound at allows us to roughly characterize the Mach number of the flow (). This provides a simple (but physically instructive) summary of the observational data. We see that the Galactic disk, high velocity cloud, and intergalactic Ovi systems are quiescent, highly subsonic flows (possibly arising in conductive interfaces between hotter and cooler gas). The Milky Way halo, Magellanic Cloud, and several of the starburst systems appear to be trans-sonic flows ( 1). This is consistent with models for fountain/chimney flows (e.g. Shapiro & Field 1976; Norman & Ikeuchi 1989), or dynamically young galactic outflows in the blow-out phase (e.g. Heckman et al. 2001a). Finally, the most extreme starburst systems (those in NGC 3310, NGC 7673, and Mrk 54) show supersonic flows with Mach numbers of several. In these cases the Ovi absorption is significantly blueshifted relative to the galaxy systemic velocity, and we are probably observing well-developed galactic winds (e.g. Heckman 2001).
4 Implications
4.1 The Nature of the Intergalactic Ovi Clouds
We have argued above that the striking correlation in Figure 1 arises naturally from the simple physics of radiatively cooling hot gas. In principle Ovi can also be produced by the photoionization of relatively cool gas by a suitably hard ionizing source. The only physically plausible such source in the present context is the metagalactic ionizing background due to QSOs. This mechanism can be ruled out for most of the classes of Ovi absorbers in Figure 1 (e.g., Sembach et al. 2000; Savage et al. 2000) since the feeble intensity of the metagalactic background implies that implausibly large and low-density clouds are required to produce the observed Ovi columns. A local photoionizing source is implausible in these cases, since normal stars produce insignificant amounts EUV radiation with 114 eV (OVI).
In principle, either collisional ionization or photoionization by the metagalactic background could produce a significant fraction of the intergalactic Ovi clouds (Tripp & Savage 2000; Tripp et al. 2001; Cen et al. 2001). We would argue that Figure 1 strongly suggests that most intergalactic Ovi clouds (like the other Ovi absorption-line systems) are collisionally-ionized, radiatively-cooling gas. In fact, six out of the eight IGM clouds in Figure 1 lie within the same range in parameter space as the high velocity cloud and Milky Way disk systems. There is no plausible reason why photoionization should naturally place the intergalactic clouds directly on top of the correlation between Ovi column density and line width defined by collisionally ionized coronal gas in the other systems. 666We note that two of the IGM points do lie well above the trend of the rest of the points shown in Figure 1. These are the and absorbers toward PG 0953+415. The absorption produced by O VI and other ions in both absorbers can be described self-consistently by photoionization models of dilute gas if absorption arises over path lengths of kpc (see Savage et al. 2002).
The total ionized gas column density in a photoionized cloud depends only on the ionization parameter (, the ratio of photon to electron density) and the cloud’s optical depth in the Lyman continuum: , where is the recombination coefficient. The predicted Ovi column is just . In the intergalactic clouds the relative strength of the Ovi line requires and to be near its maximum value (of order ) (Tripp & Savage 2000). The predicted Ovi column is cm-2 for . Thus, photoionization does not lead to any “natural” value for , nor does it imply any simple proportionality between and line width (Figure 1).
For our hypothesis of radiative cooling of hot gas to be correct, it follows first that the intergalactic Ovi clouds must have metallicities greater than a few % solar. This is consistent with theoretical models for the WHIM in which it has been chemically-enriched by the outflow of metals from galaxies (Aguirre et al. 2001; Cen et al. 2001).
Our hypothesis also requires the clouds to have radiative cooling times less than the Hubble time. This leads directly to a constraint on the sizes of the Ovi clouds. The cooling time for gas in CIE at K is years (Sutherland & Dopita 1993). The Ovi column for region with a size is given by . Combining these relations and evaluating at , we have Mpc) years. Thus, independent of the metallicity, the requirement requires 1 Mpc. We note parenthetically that the ratio of the radiative cooling and sound-crossing time will be of-order unity in these clouds, so the cooling would be intermediate between the isobaric and isochoric cases considered by Edgar & Chevalier (1986) and in Table 1.
The cooling constraint can also be cast in terms of density. For = 70 km s-1 Mpc-1 and = 0.04, requires that the Ovi clouds correspond to mean overdensities . Thus, for = 0.03 to 0.3 in the Ovi clouds (Aguirre et al. 2001; Cen et al. 2001) only moderate overdensities are needed. This agrees with the computations reported by Cen et al. (2001) in which the bulk of the hot Ovi absorbing clouds have overdensities of 20 to 40.
If the Ovi clouds are cooling on cosmologically-short timescales, they require a suitable heating source. In the numerical simulations by Cen et al. (2001) and Davé et al. (2001) this heating is provided by shocks and compression associated with the formation of large-scale structure. At least on the basis of simple energetic considerations, supernova-driven galactic winds could also heat this material. Tripp, Savage, & Jenkins (2000) have estimated that the global mass density of intergalactic Ovi clouds is or Mpc-3. For a temperature K, the corresponding thermal energy density is ergs Mpc-3. We can compare that to the time-integrated energy density due to supernovae. The galaxy luminosity density measured by Blanton et al. (2001) implies a mean stellar mass density of Mpc-3 (Fukugita, Hogan, & Peebles 1999). Taking a yield of one supernova per implies that supernovae have supplied ergs Mpc-3. For = 0.03 to 0.3, the total supernova energy is one to two orders-of-magnitude larger than the thermal energy of the Ovi clouds. Cen et al.(2001) estimate that the Ovi clouds comprise of order 10% of the WHIM. Given the apparently high efficiency with which starburst-driven winds transport supernova kinetic energy (Heckman 2001), we conclude they could be a significant heating source in the intergalactic Ovi clouds.
4.2 Predictions for other Coronal Ions
Our hypothesis that the observed Ovi originates in radiatively cooling hot gas makes an interesting prediction about the detection of both the hotter gas that is the precursor to the Ovi and the cooler gas that is its byproduct. The columns in the hotter gas are substantial, essentially because the cooling times are long. We have . Assuming that , and approximating from 5.5 to 7.0 (Sutherland & Dopita 1993), yields .
Following Edgar & Chevalier (1986), we have used the cooling functions in Sutherland & Dopita (1993) to explicitly calculate the columns for the most important ionic species that peak in fractional abundance at 5.0 to 6.5 for gas cooling radiatively from an initial temperature K. We have considered gas that cools at constant pressure (isobaric) and constant density (isochoric). We further assume that radiative cooling by dust grains is not significant (e.g. Draine 1981), that the gas is optically thin to its cooling radiation, and that the relative abundances of all the heavy elements have solar values. The results are listed in Table 1. 777In this regime, greater care in discussing the metallicity dependence of the cooling columns is required. For the temperature range where the Oiv, Ov, and Ovi ions are most abundant, Oxygen is the most important coolant. Similarly, at temperatures where the Neviii ion is most abundant, Neon is the most important coolant (Sutherland & Dopita 1993). Thus the relevant cooling time scales inversely with the O or Ne abundance, implying that the ionic cooling columns are independent of the abundance. In contrast, ions like Mgx, Sixii, Oviii, Neix, and Nex reach peak abundances at temperatures where Fe is the most important coolant. Thus our estimates in Table 1 for cooling columns need to be multiplied by the ratio of the actual elemental adundance relative to solar. In the IGM, alpha-element/Fe abundance ratios of up to twice solar are plausible (e.g. Gibson, Loewenstein, & Mushotzky 1997).
First, consider the Li-like species Neviii, Mgx, and Sixii which have strong ultraviolet resonance transitions analogous to the Ovi doublet (Neviii770,780; Mgx 610,625; Sixii499,521). These transitions could be observed with in intergalactic clouds with suitable (moderate) redshifts, and trace ions that reach their peak abundances at = 5.85 (Neviii) to 6.35 (Sixii). In both the isobaric and isochoric calculations, these ions all have cooling columns comparable to Ovi. Since these transitions have similar oscillator strengths, they will have similar optical depths and equivalent widths, and should be only slightly more difficult to detect than the Ovi line. See Table 1 for details. Note that the cooling columns for the Li-like species that trace cooler gas (Civ and Nv) are 10 to 50 times smaller than Ovi.
Next, consider the other abundant ionic species with strong resonance lines in the EUV band. Notable examples are Oiv788, Ov630, Nev568, and Nevi559. Again Table 1 shows that these species have cooling columns comparable to Ovi (particularly for the ioschoric models) and the implied optical depths and equivalent widths are comparable to the Ovi1032 line.
Finally, consider the Hydrogen-like and Helium-like species of Oxygen and Neon. The cooling columns are very high ( cm-2) because of the steep temperature dependence noted above. These ions have their resonance lines at high energies, and X-ray absorption studies are required to observe them.
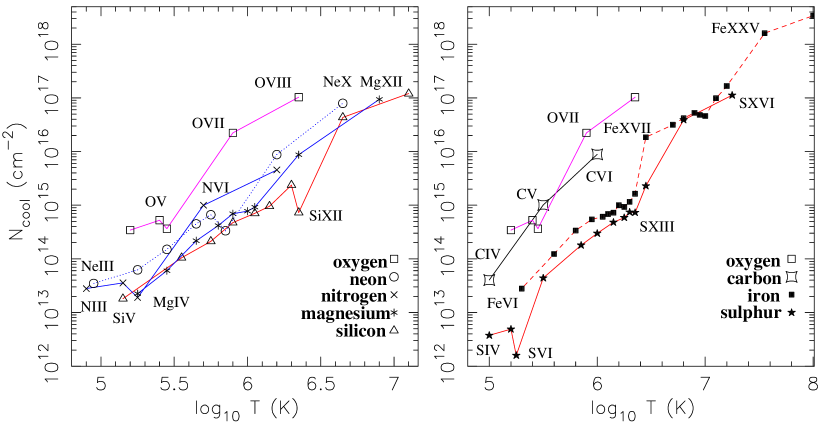
To provide a graphical summary for a much wider array of astrophyically-significant ions, we show in Figure 3 the cooling columns estimated using the approximation . This was evaluated at the temperature where ionic species of element reaches it peak abundance (), assuming at (i.e. = 1). The values plotted are approximate only, and are superceded by the detailed calculations described above for the specific subset of ions in Table 1. The strong temperature dependence of the cooling column is readily apparent in this figure.
4.3 Application to the PKS 2155-304 Absorber
Recent and data on the sight-line to the AGN PKS 2155-304 enable us to directly test the above predictions. Nicastro et al. (2002) have used the Low-Energy Transmission Grating Spectrograph on to detect X-ray absorption-lines due to H-like and He-like Oxygen and He-like Neon, and they have compared these data to the detection of Ovi absorption (Savage et al. 2000; Sembach et al. 2000).
The data have high enough spectral resolution to show that the Ovi absorption arises in two components (a narrower component centered at = +80 km s-1 and a broader component centered on = -92 km s-1). Nicastro et al. show that the relative column densities of the Ovi, Ovii, Oviii, and Neix ions are inconsistent with single-temperature gas in collisional ionization equilibrium. They find that a model of highly dilute gas photoionized by the metagalactic background provides a satisfactory fit to the observed columns provided that the Ne/O abundance ratio is 2 to 3 times solar. This model requires that the absorber have a very low density ( cm-3) and correspondingly large size (several Mpc). Thus, even though its small radial velocity suggests that the absorber is part of the disk or halo of the Milky Way, its immense implied size leads Nicastro et al. (2002) to propose that it is a local intergalactic filament (part of the “Warm-Hot Ionized Medium”).
Here we propose an alternative interpretation. We suggest that the absorber arises in gas that is cooling radiatively from an initial temperature high enough to provide Oviii absorption, but not Nex (e.g. ). This model has an important physical difference from the collisional ionization equilibrium models ruled out by Nicastro et al.: while they considered gas at a single temperature, the radiatively cooling model contains gas that spans a broad temperature range.
We can use the calculations described in the previous section to compare to the Nicastro et al. data. The results are listed in Table 2. There is a rough agreement, but the models predict larger columns in the Ovii, Oviii, and Neix ions than derived from the X-ray data. Optical depth effects may play a role. For cooling gas, the predicted optical depths in these X-ray lines are roughly 3 to 10 times higher than in the Ovi1032 line (see Table 1). If this is the case, then the X-ray lines in PKS 2155-304 could be moderately optically-thick, and the column densities reported in Nicastro et al. (2002) should then be taken as lower limits. This would improve the agreement between the models and the data. In fact, the curve-of-growth analysis reported in Nicastro et al. shows that optical depth effects will be non-negligible in the Ovii and Neix lines if the Doppler b-parameter is similar to that of the narrow or broad Ovi absorbers (65 or 95 km s-1 respectively).
If our model is correct, it has an attractive feature. Unlike the photoionization model, it does not require the absorber to have a very low density and very large size-scale. This gas could well reside in the disk or halo of the Milky Way (as might be expected based on its small LSR velocity).
5 Conclusions
Coronal-phase ( to K) gas is important in many astrophysical contexts, but has been difficult to observe. The Ovi1032,1038 doublet is a direct probe of this phase, and has been recently detected in absorption by in the disk and halo of the Galaxy, high velocity clouds, the Magellanic Clouds, starburst galaxies, and the IGM.
In this paper, we have presented a unified analysis of all these data. We have shown that these disparate systems define a simple, relatively tight relationship between the Ovi column density () and absorption-line width (b). The relationship is linear for broad lines (b 40 km s-1) but rolls over and steepens for narrower lines. The different classes of Ovi systems tend to populate distinct regions of the relationship, with Galactic disk clouds and starburst outflows at the extrema. We have shown that the relationship is not due to selection effects. We have also demonstrated it is independent of the Oxygen abundance over the range O/H = one-tenth to twice solar but breaks down for the extremely metal-poor starburst galaxy I Zw 18 (O/H 2% solar).
We have argued that the observed relation between Ovi column density and line-width is exactly that predicted theoretically as radiatively cooling hot gas passes through the coronal temperature regime. The predicted column density is independent of the gas density or metallicity (as long as the latter is 0.1 solar, so that the radiative cooling is dominated by Oxygen). The Ovi column density depends only the characteristic flow speed in the cooling gas (e.g. Edgar & Chevalier 1986). This model (which has essentially no adjustable parameters) naturally produces both the form and absolute normalization of the observed column-density vs. line-width relation. It unifies systems spanning a broad range in size and dynamical state ranging from very small (very large) quiescent clouds in the disk of the Milky Way (IGM), to meso-scale transonic flows in the halo of the Milky Way and Magellanic Clouds, to supersonic global winds in some starbursts.
We infer that the intergalactic Ovi clouds can not have metallicities less than a few percent solar, or they would lie too far off the vs. b relation. In order to be able to cool radiatively in less than a Hubble time, the clouds must be smaller than 1 Mpc in size. We have shown that if the Ovi clouds are collisionally-ionized, the implied global heating rate is consistent with available sources (structure formation and/or galactic winds). We have also predicted that column densities comparable to those seen in Ovi ( cm-2) will be detected in the other Li-like ions Neviii, Mgx, and Sixii (if the intergalactic gas is cooling from K), and in the Oiv, Ov, Nev, and Nevi ions as well.
More generally, we have shown that the steep increase in radiative cooling time with temperature means that the Li-like ions can be used to probe radiatively cooling gas at temperatures up to an order-of-magnitude higher than the value where the ionic fraction peaks (e.g. at up to a few K for Ovi). We have also calculated radiative cooling column densities for all abundant ionic species whose peak fractional abundance occurs at K. The H-like (He-like) O, Ne, Mg, Si, and S ions have characteristic cooling columns of (few) cm-2, but must be observed with X-ray telescopes.
Finally, we have shown that the properties of the Ovii, Oviii, and Neix absorption-lines recently detected with (Nicastro et al. 2002) may be consistent with a scenario of radiatively cooling gas in the Galactic disk or halo.
Appendix A The Temperature Dependence of Cooling Column for Li-like Ions
In Figure 4 we show the fractional abundance of Ovi ions as a function of temperature, assuming collisional ionization equilibrium (taken from Sutherland & Dopita 1993). The asymmetric “tail” on the high-temperature side of the peak at 5.5 is a consequence of the broad temperature range over which Ovii (from which Ovi is produced by recombination) is the dominant ion.
In Figure 5 we plot the temperature dependence of the value of the Ovi cooling column density predicted from (taking the flow’s Mach number = 1). The maximum value of the column density provides a reasonable approximation to the total column density derived from a more detailed calculation, where the cooling of a parcel of gas is followed in detail as a function of time.
The secondary peak at 6.4, is a consequence of the Ovi fractional abundance remaining significant up to this temperature (Figure 4). The total gas cooling column scales with the cooling time (which increases as ) and with the flow speed (which increases with for constant ). These effects compensate for the decrease in the ionic fraction of Ovi with increasing temperature.
Figure 5 therefore shows that for appropriately high initial temperatures, a significant fraction of the Ovi column density in radiatively cooling gas can arise in gas at temperatures up to an order-of-magnitude higher than simple consideration of collisional ionization equilibrium would suggest. For the case of a flow with constant Mach number, the fractional contribution to from gas hotter than K is about 45%.
Note that above 6.0 the primary coolant is Fe, and our calculations assume a solar O/Fe ratio. For the more general case, the predicted cooling columns at K should be multiplied by the actual O/Fe relative to the solar value.
Similar arguments apply to the other Li-like species discussed above (e.g. the Mgx ion could be used to probe radiatively cooling gas at temperatures up to almost K).
References
- (1) Aguirre, A., Hernquist, L., Schaye, J., Katz, N., Weinberg, D., & Gardner, J. 2001, ApJ, 561, 521
- (2) Begelman, M. & Fabian, A. 1990, MNRAS, 244, 26
- (3) Bregman, J. 1980, ApJ, 236, 577
- (4) Blanton, M., et al. 2001, AJ, 121, 2358
- (5) Cen,R., & Ostriker, J. 1999, ApJ, 514, 1
- (6) Cen,R., Tripp, T., Ostriker, J., & Jenkins, E. 2001, ApJ, 559, L5
- (7) Cowie, L. & McKee, C. 1977, ApJ, 211, 135
- (8) Cox, D., & Smith, B. 1974, ApJ, 189, L105
- (9) Davé, R., Cen, R., Ostriker, J., Bryan, G., Hernquist, L., Katz, N., Weinberg, D., Norman, M., & O’Shea, B. 2001, ApJ, 552, 473
- (10) Dopita, M., & Sutherland, R. 1996, ApJS, 102, 161
- (11) Draine, B. 1981, ApJ, 245, 880
- (12) Edgar & Chevalier, R. 1986, ApJ, 310, L27
- (13) Fukugita, M., Hogan, C., & Peebles, J. 1998, ApJ, 503, 518
- (14) Heckman, T. 2001, in “Extragalactic Gas at Low Redshift”, ed. J. Mulchaey and J. Stocke, ASP Conf. Series, in press (astro-ph/0107438)
- (15) Heckman, T., Sembach, K., Meurer, G., Leitherer, Calzetti, D., & Martin, C. 2001a, ApJ, 558, 56 Calzetti, D., & Leitherer, C. 2001a, ApJ, 554, 1021
- (16) Heckman, T., Sembach, K., Meurer, G., Strickland, D., Martin, C., Calzetti, D., & Leitherer, C. 2001b, ApJ, 554, 1021
- (17) Hoopes, C.G., Sembach, K.R., Howk, J.C., Savage, B.D., & Fullerton, A.W. 2002, ApJ, in press (astro-ph/0201351)
- (18) Howk, J.C., Sembach, K.R., Savage, B.D., Massa, D., Friedman, S.D., & Fullerton, A.W. 2002, ApJ, 569, 214
- (19) Jenkins, E.B. 1978, ApJ, 219, 845
- (20) Jenkins, E.B., Bowen, D.V., & Sembach, K.R. 2001, in the Proceedings of the XVIIth IAP Colloquium: Gaseous Matter in Galactic and Intergalactic Space (astro-ph/0109363)
- (21) Martin, C., Heckman, T., Sembach, K., Meurer, G., Calzetti, D., & Leitherer, C. 2002, in preparation
- (22) McKee, C., & Ostriker, J. 1977, ApJ, 218, 148
- (23) Moos, H.W. et al. 2000, ApJ, 538, L1
- (24) Mulchaey, J., Mushotzky, R., Burstein, D., & Davis, D. 1996, ApJ, 456, L5
- (25) Nicastro, F., Zezas, A., Drake, J., Elvis, M., Fiore, F., Fruscione, A., Marengo, M., Mathur, S., & Bianchi, S. 2002, astro-ph/02011058
- (26) Norman, C., & Ikeuchi, S. 1989, ApJ, 345, 372
- (27) Norman, C., & Silk, J. 1979, ApJ, 233, L1
- (28) Oegerle, W.R., Tripp, T.M., Sembach, K.R., Jenkins, E.B., Bowen, D.V., Cowie, L.L., Green, R.F., Kruk, J.W., Savage, B.D., Shull, J.M., & York, D.G. 2000, ApJ, 538, L23
- (29) Richter, P., Sembach, K.R., Wakker, B.P., & Savage, B.D. 2001a, ApJ, 562, L181
- (30) Richter, P., Sembach, K.R., Wakker, B.P., & Savage, B.D., Tripp, T.M., Murphy, E.M., Kalberla, P.M.W., & Jenkins, E.B. 2001b, ApJ, 559, 318
- (31) Savage, B., Sembach, K., Jenkins, E., Shull, J. M., York, D., Sonneborn, G., Moos, H. W., Friedman, S., Green, J., Oegerle, W., Blair, W., Kruk, J., & Murphy, E. 2000, ApJ, 538, L27
- (32) Savage, B., Sembach, K., Tripp, T.M., & Richter, P. 2002, ApJ, 564, 631
- (33) Savage, B. et al. 2002, in preparation
- (34) Sembach, K.R., Howk, J.C., Savage, B.D., Shull, J.M., & Oegerle, W.R. 2001, ApJ, 561, 573
- (35) Sembach, K., Savage, B., Shull, J. M., Jenkins, E., Murphy, E., York, D., Ake, T., Blair, W., Davidsen, A., Friedman, S., Gibson, B., Kruk, J., Moos, H. W., Oegerle, W., Sahnow, D., Sonneborn, G. 2000, ApJ, 538, L31
- (36) Sembach, K.R. et al. 2002, in preparation
- (37) Shapiro, P., & Field, G. 1976, ApJ, 205, 762
- (38) Spitzer, L. 1978, Physical Processes in the Interstellar Medium, Wiley & Sons
- (39) Sutherland, M., & Dopita, M. 1993, ApJS, 88, 253
- (40) Thuan, T.X., Lecavelier des Etangs, A., & Izotov, Y.I. 2002, ApJ, 565, 941
- (41) Tripp, T., & Savage, B. 2000, ApJ, 542, 42
- (42) Tripp, T., Savage, B., & Jenkins, E., 2000, ApJ, 534, L1
- (43) Tripp, T., Giroux, M., Stocke, J., Tumlinson, J., & Oegerle, W. 2001, ApJ, 563, 724
- (44) Verner, D., Tytler, D., & Barthel, P. 1994, ApJ, 430, 186
- (45) Weaver, R., McCray, R., Castor, J., Shapiro, P., & Moore, R. 1977, ApJ, 218, 377


| Ion | Line | ic | |||||
|---|---|---|---|---|---|---|---|
| Civ | 5.00 | 12.5 | 13.9 | 1548.2 | 7.0 | 8.4 | 0.25 |
| Nv | 5.25 | 12.6 | 13.6 | 1238.8 | 6.9 | 7.9 | 0.08 |
| Oiv | 5.20 | 13.6 | 15.0 | 787.7 | 7.5 | 8.9 | 0.8 |
| Ov | 5.40 | 13.6 | 14.8 | 629.7 | 8.1 | 9.3 | 2.0 |
| Ovi | 5.45 | 14.2 | 15.0 | 1031.9 | 8.4 | 9.1 | 1.3 |
| Ovii | 5.90 | 16.4 | 16.9 | 21.60 | 9.6 | 10.1 | 13 |
| Oviii | 6.35 | 16.8 | 17.0 | 18.97 | 9.5 | 9.7 | 5 |
| Nev | 5.45 | 13.4 | 14.6 | 568.4 | 7.2 | 8.4 | 0.25 |
| Nevi | 5.65 | 13.7 | 14.7 | 558.6 | 7.6 | 8.6 | 0.4 |
| Neviii | 5.85 | 14.3 | 14.7 | 770.4 | 8.2 | 8.6 | 0.4 |
| Neix | 6.20 | 16.3 | 16.5 | 13.45 | 9.3 | 9.5 | 3 |
| Mgx | 6.05 | 14.5 | 14.8 | 609.8 | 8.2 | 8.5 | 0.3 |
| Sixii | 6.35 | 14.8 | 15.0 | 499.5 | 8.3 | 8.5 | 0.3 |
Note. — The temperature at which each ion reaches its peak abundance in CIE is given in column 2. The calculations of cooling columns are based on the cooling flow behind a 600 km s-1 shock (postshock temperature K) using the Sutherland & Dopita (1993) non-equilibrium zero-field cooling function and solar abundances. They assume that the cooling proceeds under isobaric conditions (column 3) or isochoric conditions (column 4). For the specific resonance absorption-lines whose wavelength is listed in column 5 (in Å), the implied line strengths for the isobaric and isochoric models are given in columns 6 and 7 respectively. These are given in terms of the product of the column density, oscillator strength (htpp://physics.nist.gov/), and wavelength (in cm). The optical depth at line center is just (where the Doppler parameter b is in cm s-1). The implied optical depths at line-center for the isochoric model (b = = 150 km s-1) are given in column 8. The equivalent widths in the optically-thin limit are (e.g Spitzer 1978).
| Columns | Data (both) | Data (single) | Isobaric | Isochoric |
|---|---|---|---|---|
| log | 14.40.1 | 14.00.1 | 14.2 | 15.0 |
| log[] | 1.20.3 | 1.60.3 | 2.2 | 1.9 |
| log[] | 1.30.4 | 1.70.4 | 2.6 | 2.0 |
| log[] | 1.40.3 | 1.80.3 | 2.1 | 1.5 |
Note. — The measured values for the column densities are listed twice. In column 2 we assume both the broad and narrow Ovi components seen in the spectrum are associated with the X-ray absorber. In column 3, we assume that only the broad Ovi component is associated with the X-ray absorber (as proposed by Nicastro et al. 2002). In columns 2 and 3 the values for , , and are treated as lower limits to allow for the possibility that the X-ray absorption-lines are not optically-thin. The values in columns 4 and 5 for isobaric and isochoric cooling are taken from the same calculations reported in Table 1.