Tightly Correlated X-ray/H Emitting Filaments In the Superbubble and Large-Scale Superwind of NGC 3079
Abstract
Using Chandra and HST we show that X-ray and H filaments that form the 1.3-kpc diameter superbubble of NGC 3079 have strikingly similar patterns at 08 resolution. This tight optical line/X-ray match seems to arise from cool disk gas that has been driven by the wind, with X-rays being emitted from upstream, stand-off bowshocks or by conductive cooling at the cloud/wind interfaces. We find that the soft X-ray plasma has thermal and kinetic energies erg and erg, where is the filling factor of the X-ray gas and may be small; these are comparable to the energies of the optical line-emitting gas. Hydrodynamical simulations reproduce the observations well using large filling factors for both gas phases; assuming otherwise leads to serious underestimates of the mass lost in superwinds and therefore their influence within and around the host galaxy. X-rays are also seen from the base of the radio counterbubble that is obscured optically by the galaxy disk, and from the nucleus (whose spectrum shows the Fe K line at 6 keV as well as gas absorbed by a moderate neutral hydrogen column). The superbubble is surrounded by a fainter conical halo of X-ray emission that fills the area delineated by high angle, H-emitting filaments, supporting our previous assertion that these filaments form the contact discontinuity/shock between galaxy gas and shocked wind. This X-ray emission is not significantly edge brightened, indicating a partially filled volume of warm gas within the shocked wind, not a shell of conductively heated gas. About 40″ (3 kpc) above the galaxy disk an X-ray arc may partially close beyond the bubble, but the north-east quadrant remains open at the surface brightness attained by Chandra, consistent with the notion that the superwind has broken out into at least the galaxy halo.
1 Introduction
Winds are believed to play a key role in determining the equation of state of the intergalactic medium and the long-term evolution of galaxies, yet direct proof is elusive. Wind energetics have proved very difficult to constrain because of uncertain gas filling factors in the different phases, but evidence is growing that they may be far larger than inferred from optical spectra of the shock or photoionized nebulae, and radio observations of supernovas and their remnants. Winds can influence galaxy evolution in many ways (Heckman, 2002). They are important redistributors of metals by radiation on dust or by over-pressured gas from supernova heating. In the Galaxy, enrichment of the halo and outer disk through powerful winds may account for the observed abundances of the thick disk and globular clusters (Freeman & Bland-Hawthorn, 2002). Moreover, winds can regulate the growth of the central bulge (Carlbeg, 1999), and alter the evolution of satellites of large galaxies, with either galaxy hosting the outflow (Irwin et al., 1987, for example). Winds may mix astrated gas into intergalactic clouds (Tripp et al., 2002), and may clear paths through dusty veils for AGN/starbursts to reionize the universe.
A superwind is driven by the pressure of thermalized supernova or AGN ejecta. As the wind expands and cools adiabatically, it accelerates to several thousand km s-1. Expanding along the pressure gradient in the galaxy, the wind can over-run, crush, and heat disk and halo clouds to X-ray emitting temperatures, then entrain them into the flow. X-rays may also arise from stand-off bow shocks in the wind upstream of the optically emitting clouds. Thus, soft X-rays may point to powerful shocks. However, they can also be emitted at the conductive interface between hot shocked wind and cooler ISM swept up by a bubble. Whether gas blows out of the galaxy depends on hydrodynamical details and halo drag (Strickland, 2001).
To understand this ubiquitous phenomenon, we are studying energetic outflows in nearby galaxies. Here, increased spatial resolution of many ISM phases may uncover evidence for previous outflows and energetic stellar populations, constraining the duty-cycle of ejection and illuminating the feedback role of fast and slow winds on supernovae (Efstathiou, 2000). One of the clearest examples of a nearby superwind-blown structure is the prominent bubble (Ford et al., 1986) that protrudes from the nucleus of the nearly edge-on SB(s)c galaxy NGC 3079 ( Mpc, so 1″ = 84 pc). Rising 1.3 kpc (15″) above the disk, the bubble is the optically emitting half of a double-lobed radio structure (Duric & Seaquist, 1988), optical line emission from the other lobe being extinguished by the galaxy disk. Outflow kinetic energies of up to erg are implied by the optical line emission (Veilleux et al., 1994). Because of considerable extinction, the nuclear power source is manifest primarily by reprocessed radiation. How the superbubble is powered is thus uncertain, with both AGN (Hawarden et al., 1995) and starburst (Sofue & Vogler, 2001) sources promoted.
The total energy required corresponds to the effects of 104/ supernovae, where is the thermalization efficiency (Chevalier & Clegg, 1985). A particular obstacle to achieving realistic simulations of the wind is that even a rough estimate of is controversial (Strickland, 2001): it can be in dense gas (Thornton et al., 1998) where the energy is radiated away, but can exceed 30% if the supernovae occur in multi-phase gas.
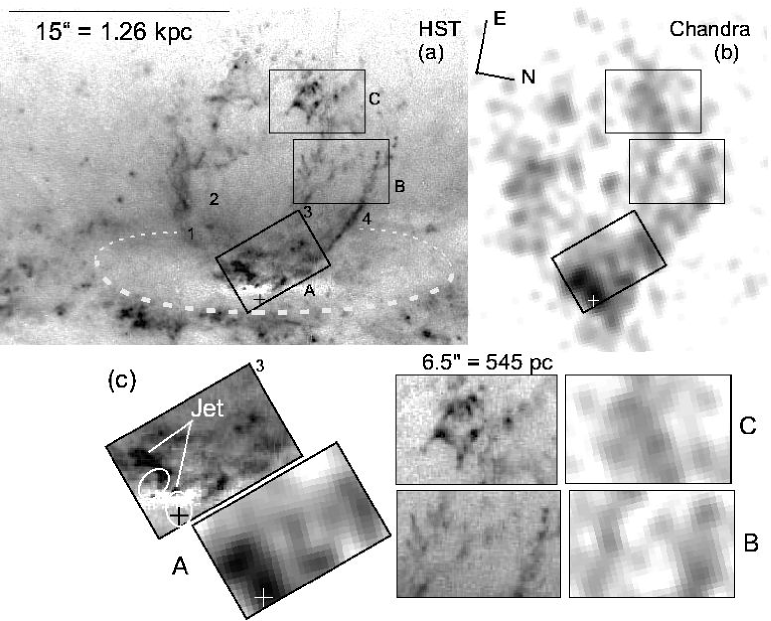
In Cecil et al. (2001, CBVF hereafter), we analyzed high-resolution images of the superbubble obtained with HST/WFPC2, see Fig. 1a. The H[N II] emission-line image shows many plausibly windblown features, including: 1) linear filaments rising several kpc above the disk to form an “X” that we have interpreted to be the contact discontinuity/ISM shock between wind and galaxy “thick disk”/halo gas, 2) four towers of intertwined filaments that together form the optical emitting walls of the superbubble and that all disperse at the same height above the disk. The latter pattern, together with 3) a break in the velocity field at this point, argue for a vortex in the top half of the bubble caused by fluid instabilities, as predicted from numerical simulations of windblown bubbles. 4) Line of sight velocities that increase with height above the disk to reach 1000 km s-1 relative to systemic at the vortex, decreasing thereafter, 5) a circumnuclear disk region “scoured” of dust and gas whose boundary joins the linear filaments 1).
X-rays could arise when the H filaments moving at the speeds seen in the superbubble collide with stationary gas, and indeed Pietsch, Trinchieri, & Vogler (1998, PTV hereafter) found that NGC 3079 is ten times more X-ray luminous than galaxies of similar optical luminosity. They used the ROSAT HRI to image X-rays across the superbubble with integral 0.1-2.4 keV luminosity erg s-1, and also used the ROSAT PSPC to detect the softest X-rays out to 25 east of the nucleus and 6′ west. No spectrum could be isolated from the superbubble because the HRI was energy insensitive while the PSPC lacked spatial resolution to connect optical and X-ray emitting filaments. Now a Chandra X-ray image is available, and the striking correspondence it reveals and the implications on soft X-ray emission from superwind bubbles are the subjects of this paper. In §2 we introduce the X-ray image, and analyze it in §3. In §4 we discuss the dynamics, and summarize in §5.
2 Observations and Reductions
We analyzed the archived 26.9 ksec exposure (P.I. D. Strickland) obtained with the ACIS-S3 detector on the Chandra X-ray Observatory; the other ACIS-S chips miss the galaxy so are not discussed in this Letter. We extracted a 2′ square region centered on the superbubble (the aim point of the observation); well exposed point sources are round in this region, confirming the excellent spacecraft aspect solution. A few background “flares” were removed by using the ciao2.2.1 lightcurve task, reducing the effective exposure to 26.0 ksec. We formed several images with different smoothing, using constant and adaptive kernel sizes. For study of the nucleus and superbubble we obtained best results using a fixed kernel of 08 FWHM. Elsewhere, we mapped fainter emission using a kernel of 2″ FWHM.
Fig. 1b registers the X-ray image with the HST line image discussed in CBVF. As others have found in recent studies, the “world coordinates” derived from calibrations of both spacecraft agree within 07, which is adequate given the smoothing required for this fairly shallow Chandra exposure. We confirmed registration to this accuracy using centroids of a few compact galaxies visible in both wavebands.
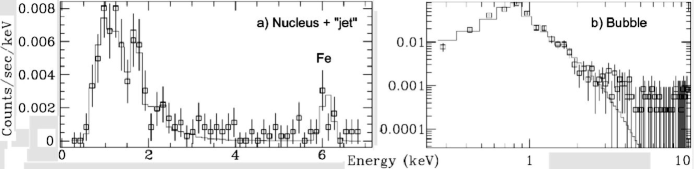
To form spectra (Fig. 2), we subtracted the background summed from regions off the galaxy to successfully remove spectral artifacts, and mapped pulse heights to energies using the response values at the bubble position in CALDB file acisD2000-01-29fef_phaN0001. After subtracting the background, 1757 X-ray events were detected within a 2722″ ellipse centered on the superbubble (Fig. 2b) and excluding a ellipse that spans the nucleus and jet and that emitted 309 events (Fig. 2a). We used the Sherpa package within the ciao 2.2.1 software to quantify the spectra and to integrate fluxes. We fit the spectrum of the bubble with single temperature, collisional-ionization-equilibrium models such as mekal and external photoelectric absorption, allowing neutral absorption, gas temperature, and interpolated gas abundances to vary over the fitting energy interval keV; abundances relative to He were fixed to the Anders & Grevesse (1989) ratios. For the nucleus+jet spectrum, we also included a single Gaussian at the Fe emission.
Fit results, including derived X-ray fluxes and luminosities, are summarized in Table 1. We find that iron and -element abundances are solar across the bubble ( times larger than Strickland et al. (2002) derived for the diffuse halo of NGC 253), and about half solar near the nucleus. The lack of independent constraints on element abundances from optical spectra added uncertainty on the fitted emission “integral” , where is the X-ray volume filling factor. It is possible that depletion onto dust explains the low iron abundances in both regions, but this would not explain depleted -elements if confirmed by deeper spectra. Calibration uncertainties (see §2.1.4 in Strickland et al. (2002), notably the effective area of chip S3 is uncertain below 0.5 keV) and low counts from both regions limited possibilities for detailed spectral analysis; in particular, the necessary spectral binning evident in Fig. 2 prevented us from using the intensity ratios of successive oxygen ionization states (VII/VIII) to check the overall temperature solution hence the questionably low fitting abundance of the bubble. Low counts also prohibited multi-temperature models. We did not explore the addition of a non-thermal component to increase gas abundances in the thermal gas although this is clearly plausible physically not only near the nucleus (where it might be the AGN), but also in the superbubble (where it might be synchrotron emission from cosmic rays accelerated locally in shocks).
3 Physical Properties of Regions Emitting X-rays
We now discuss the X-ray emission, proceeding from smallest to largest scale. We do not discuss the considerable number of X-ray sources evident in the galaxy disk beyond 20″ radius.
3.1 Extended Nucleus
The nucleus is obscured optically but prominent to Chandra. X-ray flux is elongated along the axis of the radio jet (§3.2). The nominal registration puts the nucleus 04 south-west of the X-ray flux centroid, of order our registration uncertainty. Indeed our spectral model shows that flux near the nucleus is absorbed more than Ptak (1997) estimated from the combined ASCA+ROSAT PSPC spectrum; we could not fit the Chandra spectrum with his prefered absorption. Fig. 2a shows relatively strong Fe K near 6 keV, providing unambiguous evidence for the AGN that generally excites this line by fluorescence of the cold molecular gas evident nearby (Sofue et al., 2001). Sparse counts in the adjacent “continuum” prevented us from establishing the equivalent width of this line to compare to its strength in other AGN.
There is no evidence in the spectrum for a hard-component due either to the AGN or to unrelated hard-spectrum X-ray binaries down to a count rate of 0.004 per second integrated over the interval keV.
3.2 Optical Extension of the VLBA-Scale Jet
Panels A of Fig. 1c show anticorrelated X-ray and high-velocity optical line filaments associated with the VLBI-scale jet (CBVF). The main optical filament (top one in panel A) is displaced from an X-ray source (top oval in the top panel A) that does not show the hard spectrum of an unrelated X-ray binary down to the aforementioned count rate. The X-rays are likely not inverse Compton scattered because there is no strong IR emission or collimated radio flux along this axis at the scale of the H/X-ray emission. Instead, the thermal spectrum that we infer with keV is consistent with that expected for a jet cocoon shock with average expansion or entrainment velocity km s-1, where km s-1, and is the concentration of all particles relative to hydrogen nuclei when the preshock medium is fully ionized and has 10% helium abundance by number (Hollenbach & McKee, 1979). This velocity is consistent with measured emission-line half-widths in the region, see Figs. 11b & c of CBVF.
3.3 Bubble “Towers”
Fig. 1 shows that, within the superbubble, optical line and X-ray filament networks coincide within our registration uncertainty ( or 60 pc). In both wavebands, the two northernmost towers (numbers 3 and 4 in Fig. 1a) are less diffuse than the southern pair. All towers extend down to the galaxy nuclear region. CBVF show (see also Fig. 3) that radio emission from the eastern superbubble peaks at larger galactic radii than the optical line and X-ray emission, arguing against an inverse Compton origin for the X-rays.
Because of the similar appearance of the superbubble in the two wavebands, we bounded the volume of warm gas by assuming that it envelopes the optical-line emitting filaments. The areas of the optical filaments are often upper limits, constrained by our inability to resolve many of them in the [N II]+H line HST/WFPC2 image. From Table 3 of CBVF we summed the volume of those that we now see are associated with X-rays, then increased this by a conservative factor of 16 in cross-sectional area (assuming cylindrical filaments) to reach the resolution of the Chandra observations, yielding total emitting volume pc3. We used the luminosities derived from our X-ray spectral fits to constrain the average gas densities and other physical properties of the brightest parts of the superbubble; given the small number of X-ray counts, the derived physical parameters are at best order of magnitude estimates. The luminosity of the X-ray emitting gas
where is the electron (proton) density of the hot gas, and is the cooling function that is approximated near K by
(McCray, 1987). Following Strickland et al. (2002), we scale by factor to show the dependence on abundances; in the following . The X-ray electron density is cm-3, while the thermal pressure is K cm-3. The mass of the warm X-ray gas is . The time to cool to 104 K at solar abundance is s = Myr (Sutherland & Dopita, 1993). The mass flow rate , where pc is the height of the bubble, and is the mass weighted, average outflow velocity in units of km s-1 (typical of measured values for the optical filaments, CBVF). The soft X-ray plasma has thermal and kinetic energies erg and erg. In comparison, we found (CBVF) that the optical-line emitting gas has erg and erg where and are the filling factor and electron density of that gas phase.
The mass of both the visual line- and X-ray emitting gas can be written as , because the emissivity in both cases is proportional to . From the HST line image, we derived (Table 3 of CBVF) that and M⊙. If we assume that the two phases are in local pressure equilibrium, we find the relative values of electron density , and mass .
3.4 X-rays From the Radio Counter-bubble
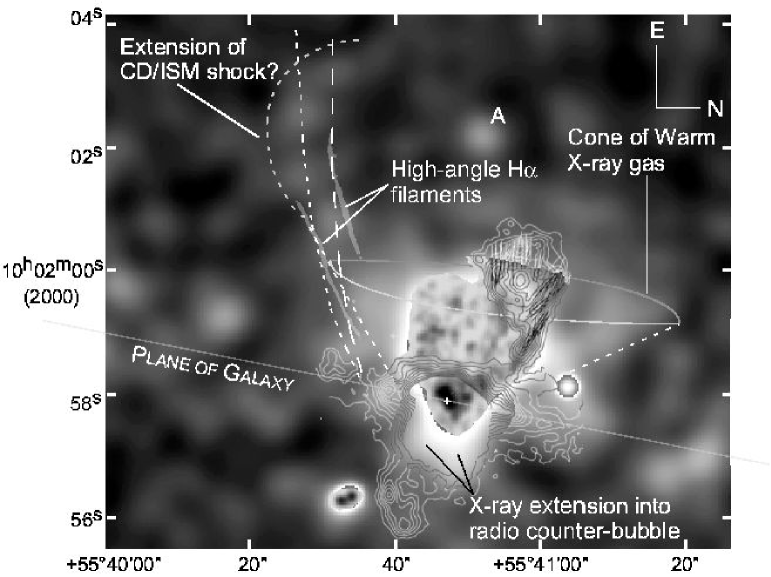
Fig. 3 maps X-rays over a larger scale and compares to the radio continuum. A pair of faint ridges of X-rays emerge from the nucleus and trend westward, toward the bottom. They have the same opening angle as the bottom half of the bubble walls (forming a cone), suggesting that they trace the walls of the base of the radio counterbubble. If of similar surface brightness to the eastern bubble, they are attenuated about threefold in count rate by absorption in the galaxy, so are too faint for meaningful spectral analysis.
3.5 X-ray Emission Near the Disk, Outside the Superbubble
Fig. 3 shows that diffuse X-ray emission surrounds the nucleus out to 25″ radius. Emission is more extensive east of the nucleus, the disk nearside, than to the west. X-rays fill a cone with opening angle 90∘ as height increases above the disk, and are more concentrated on the south side of the nucleus where the cone edge coincides with inclined linear H filaments. X-ray emission on the north side of the nucleus is patchier, but may also be bounded in the cone sketched in Fig. 3. The cone apex is not at the galaxy nucleus. Instead, the cone reaches the disk while still open, then becomes “two horned” west of the nucleus as X-rays trace the radio counterbubble (discussed previously). Again, X-ray emission is too faint for meaningful spectral constraints.
3.6 X-ray Emission Above the Galaxy Disk
We have not analyzed the statistical significance of other X-ray point sources. However, one of the registration sources in both wavebands is a small galaxy in the HST I-band image 32″ east of the nucleus (source “A” in Fig. 3). An arc of 4 sources, each about half the X-ray brightness of this galaxy but among the brighter “background” sources, lies 20″ south and may form the eastern extension of the southern edge of the X-ray cone. It curves toward the cone axis as height increases from 30 to 40″.
4 Discussion
4.1 Outer Wind/ISM Shock
Proceeding inward from the largest scale, the region of diffuse X-ray emission is bounded by the optically emitting X-pattern of filaments, which CBVF showed have the shape expected (Schiano, 1986) for the contact discontinuity/ISM shock associated with lateral stagnation of the superwind in the galaxy “thick disk”/halo; the X-ray emission is not significantly edge brightened, suggesting a partially filled volume of warm gas within the shocked wind, not a shell of conductively heated gas. CBVF’s models appropriate for steady-state wind flow, and reproduced as dotted and dashed white lines in Fig. 3, remain open at the top. However, Sofue & Vogler (2001) have modeled an adiabatic “bipolar hypershell” that arises from a point, impulsive energy release on a timescale much shorter than the several Myr expansion time of the superbubble. These structures close at the top. The appearance of their models is sensitive to the density distributions of disk, halo, and the density of the extragalactic medium, but resemble one another for roughly the first 10 Myrs. The outer shell expands at 200 – 300 km s-1 to shock-heat gas to 0.2 keV (so would be very “soft” in a “hardness” map derived from a deeper Chandra exposure), consistent with the velocities in our Fabry-Perot spectra (Veilleux et al., 1994). Of course, identical shock envelopes arise for constant values of , where is the energy of the explosive event and the ambient gas density. Strickland et al. (2002) considered this model to interpret their Chandra image of the starburst galaxy NGC 253, rejecting it for one that describes optical emission from a wind-blown shell (Weaver et al., 1977), the model that (Veilleux et al., 1994) have applied to NGC 3079.
Sofue & Vogler (2001) compared their models to PTV’s PSPC image of NGC 3079, noting double-horned features on both sides of the galaxy at radii of 100″. This is much larger than the scale we are discussing, suggesting either that there have been several outbursts over the last 100 Myrs or that the larger scale double-horns seen by the ROSAT PSPC are actually spurious overlaps of unrelated background objects.
As discussed in §3.3, what powers the superbubble remains ambiguous despite detection of Fe line emission (Fig. 2). As emphasized by Maloney (1999), it is extremely difficult to distinguish the action of a starburst from an AGN based solely on the ionizing flux. Deeper images with Chandra and especially XMM/Newton could establish if the contact discontinuity/ISM shock closes to form symmetric bubbles. Open morphology would argue for a steady wind rather than impulsive starburst, supporting the interpretation of Irwin et al. (1987) that H I in the companion galaxy NGC 3073, 10′ west, trails away from NGC 3079 because of what would have to be an extremely energetic wind. A steady wind would favor an AGN power source, because repetitive starbursts would make numerous, less massive stars that are not evident (cf. those in M82, de Grijs, O’Connell, & Gallagher, 2001).
4.2 Filament Correlation Within the Superbubble
The organization of both filament systems into vertical towers attached to the galaxy disk excludes the possibility that the optical filaments are halo clouds caught in the wind. For the superwind in NGC 253, Strickland et al. (2002) dismiss the possibility that diffuse X-ray and filamentary H emission both come from a cooling, volume filling wind; their argument is also valid for NGC 3079.
That the towers emit X-rays along their entire optical length is an important constraint, because the radial velocities of the optically emitting filaments show a linear gradient from 200 to 1000 km s-1 with height above the disk (Veilleux et al., 1994) until they overturn in a vortex in the top third of the superbubble (CBVF). The ubiquitous X-ray emission suggests that the superwind has driven cool disk gas into the halo, with X-rays being emitted either as upstream, stand-off bow shocks or by cooling at cloud/wind conductive interfaces. In either case, the X-ray emitting skin is thin and would plausibly coincide at our resolution with the optical line emitting filaments, e.g. for preshock density cm-3, the separation would be arcsec scaled for shock speed in units of 500 km s-1. In this picture, the wind strips gas from the walls of the dense disk cavity, and this gas then fragments into disintegrating streams by Kelvin-Helmholtz instabilities. The fragments gradually disperse, and eventually become Rayleigh-Taylor unstable in the top third of the superbubble where they pass through the vortex and begin to drip toward the disk. The filaments are embedded in the wind that flows past them to reach into the halo.
The soft X-rays may arise as optical line-emitting clouds evaporate into a region of unseen, hot (108 K) X-ray gas that fills the superbubble. Because the cloud column density is surely cm-2, we can use the saturated thermal conductive rates determined by Krolik, McKee, & Tarter (1981). The approximate cloud lifetime for saturated thermal evaporation without an inhibiting magnetic field is
where is the thermal cloud pressure in erg cm-3 ( K cm-3), is the cloud temperature in K, and is the cloud column density in 1023 cm-2 that is unfortunately unconstrained by existing optical spectra of the superbubble. However, because clouds reach high into the galaxy halo from the disk, we can set a lower limit on their column densities by equating to the cloud crossing time Myr, obtaining . The visible clouds that have survived conductive evaporation are therefore those with column densities cm-3 and hence large sizes (if cylindrical, pc) and total masses M⊙, consistent with the ionized masses determined in CBVF.
4.3 Wind Energetics
The detection of Fe K line emission addresses the question of whether the AGN is directly responsible for the superbubble. Extended filamentation is seen in both Seyfert galaxies (where circumnuclear starbursts are commonly observed), and in starburst galaxies that do not show strong nuclear X-ray sources. Starburst galaxies commonly show an ionization gradient in the extended filaments, in the sense that inner filaments appear to be photoionized while the outer ones are more shock-like (Martin, 1997; Shopbell & Bland-Hawthorn, 1998, for example), although Veilleux & Rupke (2002) have found a starburst-driven filament system that is shock-like throughout. From morphology alone, it is difficult to distinguish a shock from a photoionization process: hydrodynamics can shape filaments that are then photoionized by the central starburst. In the case of M82, a well defined ionization cone is mapped in e.g. [N II]/H (Shopbell & Bland-Hawthorn, 1998)). The optical cone appears to be mostly photoionized from stars whereas the X-ray cone appears to be shock excited. In NGC 1068, where winds and radiation are both known to be important, the AGN radiation field is thought to explain both the optical and X-ray emission, and this object appears to have an X-ray photoionization cone (Young, Wilson, & Shopbell, 2001). On UV energetics alone, it is also impossible to distinguish between AGN or starburst (Maloney, 1999, for example). A gas temperature derived from both the X-ray and the optical emission is crucial to establishing the energy source. The mean energy of an ionizing photon in photoionized gas is much smaller than that required to ionize the medium collisionally, hence shock heated gas is considerably hotter. Suitable optical data do not yet exist for the superbubble of NGC 3079.
True wind energetics are elusive because they depend on both the supernova source energetics and the thermalization efficiency . Before Chandra, X-ray observations of starburst cores had lacked spatial resolution to resolve the contributions of X-ray binaries. Now, ACIS on Chandra can search for hot gas in the starburst core, and Griffiths et al. (2000) argue that they have detected it in M82. Summing the energy in a wind like that in M82 with best estimates for the filling factors in various gas phases, one finds that it is still substantially below the energy derived using the radio-determined supernova rate and a moderate to high (20–50%) thermalization efficiency. Moreover, Chevalier & Fransson (2001) argue that the supernova rate in M82 may be substantially higher than inferred from radio counts. These suggest that we are missing much of the outflow energy, in agreement with multi-phase hydrodynamical models (Suchkov et al., 1994; Strickland & Stevens, 2000).
The problem is that the outflowing gas is almost all entrained disk and halo gas, not wind material. As evidence for this, the outer filaments in M82 (and NGC 1482, Veilleux & Rupke, 2002) share the rotation of the galaxy disk, and the pattern of magnetic fields and gas motions in NGC 3079 (CBVF) strongly suggest that the top of the superbubble is forming a vortex. Second, hot gas exists in superwinds (Heckman et al., 2001) and appears to be moving faster than the cooler gas, inconsistent with standard superbubble models (Weaver et al., 1977) but resembling the pattern seen in hydrodynamical wind simulations (Suchkov et al., 1994; Strickland & Stevens, 2000).
Evidence for extensive supernova remnants in the disk of NGC 3079 is ambiguous (see §4.3 of CBVF). We thus address wind energetics from the constraints derived previously on the efficiency of thermalization. The energetics of the soft X-ray component in the superbubble that we constrained in §3.3 are comparable to those determined by Strickland et al. (2002) for the diffuse wind in NGC 253. This arises even though the X-ray emitting filaments in NGC 3079 may have much higher density.
5 Conclusions
Chandra reveals a remarkably tight correspondence (08, 65 pc) between optical line and X-ray emitting filaments in the superbubble of NGC 3079. The bubble is embedded in a conical distribution of more diffuse X-rays. West of the nucleus, this emission extends into the optically obscured, radio counterbubble. East of the nucleus (i.e. on the near side of the galaxy) a funnel is also delineated by extremely narrow optical line emitting filaments that rise several kpc above the galaxy disk, supporting our earlier contention that they form the contact discontinuity/halo shock of the wind. These filaments connect back to the disk at one end and at the other, perhaps, to an X-ray ridge that seems to curve back toward the cone axis. However, at present X-ray sensitivity, the loop does not close completely, so the wind may escape the galaxy. A deeper Chandra exposure would confirm this X-ray extension, and would double spatial resolution of the superbubble to tighten the volume of the emission integral hence constraints on derived physical parameters.
Even without a complete understanding of the physical process, the close association between the Chandra and HST emission is important for several reasons. First, powerful winds must be involved either directly or indirectly in producing this filamentary complex. Second, high resolution joint Chandra/HST studies of the filaments in this galaxy, M82 (Griffiths et al., 2000), NGC 253 (Strickland, Heckman, Weaver, & Dahlem, 2000; Strickland et al., 2002), and NGC 1068 (Young, Wilson, & Shopbell, 2001) show that both the X-ray and optical emission is highly clumped, with resolved structures seen down to our resolutions of 65 pc (Chandra) and 15 pc (HST). The evidence for entrainment in these winds is compelling (e.g. CBVF), and we suspect that most of the superwind mass resides in the filamentary complex. We agree with the assessment of Strickland (2001) that the smallest cloud scales in simulations must be very well sampled to treat cloud entrainment and acceleration correctly (Klein, McKee, & Colella, 1994). The resolution of present wind models (Suchkov et al., 1994; Strickland & Stevens, 2000) is ten times too large to match the observed clumping scales, arguing for a new generation of hydrodynamical models to establish testable predictions on cloud internal properties. In the meantime, we may be seriously underestimating the mass lost in superwinds, and therefore their influence within and around the host galaxy.
References
- Anders & Grevesse (1989) Anders, E. & Grevesse, N. 1989, Geochim. Cosmochim. Acta, 53, 197
- Carlbeg (1999) Carlberg, R. 1999, in The Formation of Galactic Bulges, eds. C. M. Carollo, H. C. Ferguson, & R. F. G. Wyse (New York: CUP), 64
- Chevalier & Clegg (1985) Chevalier, R. A. & Clegg, A. W. 1985, Nature, 317, 44
- Cecil et al. (2001) Cecil, G., Bland-Hawthorn, J., Veilleux, S., & Filippenko, A. V. 2001, ApJ, 555, 338 (CBVF)
- Chevalier & Fransson (2001) Chevalier, R. A. & Fransson, C. 2001, ApJ, 558, L27
- de Grijs, O’Connell, & Gallagher (2001) de Grijs, R., O’Connell, R. W., & Gallagher, J. S. 2001, AJ, 121, 768
- Duric & Seaquist (1988) Duric, N. & Seaquist, R. S. 1988, ApJ, 326, 574
- Efstathiou (2000) Efstathiou, G. 2000, MNRAS, 317, 697
- Ford et al. (1986) Ford, H. C., Dahari, O., Jacoby, G. H., Crane, P. C., & Ciardullo, R. 1986, ApJ, 311, L7
- Freeman & Bland-Hawthorn (2002) Freeman, K. & Bland-Hawthorn, J. 2002, ARA&A, 40, in press
- Frye, Broadhurst, & Benitez (2002) Frye, B., Broadhurst, T, & Benitez, N. 2002, ApJ, 568, 558
- Griffiths et al. (2000) Griffiths, R. E. et al. 2000, Science, 290, 1325
- Hawarden et al. (1995) Hawarden, T. G. et al. 1995, MNRAS, 276, 1197
- Heckman et al. (2001) Heckman, T. M. et al. 2001, ApJ, 558, 56
- Heckman (2002) Heckman, T. M. 2002, in Extragalactic Gas at Low Redshift, eds. J. Mulchaey & J. Stocke, ASP Conf. Ser. 254, 292 (San Francisco: ASP)
- Hollenbach & McKee (1979) Hollenbach, P. J. & McKee, C. F. 1979, ApJS, 41, 555
- Irwin et al. (1987) Irwin, J. A., Seaquist, E. R., Taylor, A. R., & Duric, N. 1987, ApJ, 313, L91
- Klein, McKee, & Colella (1994) Klein, R. I., McKee, C. F., & Colella, P. 1994, ApJ, 420, 213
- Krolik, McKee, & Tarter (1981) Krolik, J., McKee, C. F., & Tarter, C. B. 1981, ApJ, 249, 422
- Maloney (1999) Maloney, P. R. 1999, Ap&SS, 266, 207
- Martin (1997) Martin, C. 1997, ApJ, 491, 561
- McCray (1987) McCray, R. 1987, in Spectroscopy of Astrophysical Plasmas, ed. A. Dalgarno & D. Layzer (New York: Cambridge Univ. Press), chap. 10
- Morrison & McCammon (1983) Morrison, R. & McCammon, D. 1983, ApJ, 270, 119
- Pietsch, Trinchieri, & Vogler (1998) Pietsch, Trinchieri, & Vogler 1998, A&A, 340, 351 (PTV)
- Ptak (1997) Ptak, A. 1997, Ph. D thesis, Univ. Maryland, College Park
- Schiano (1986) Schiano, A. V. R. 1986, ApJ, 302, 81
- Shopbell & Bland-Hawthorn (1998) Shopbell, P. & Bland-Hawthorn, J. 1998, ApJ, 493, 129
- Sofue et al. (2001) Sofue, Y. et al. 2001, ApJ, 547, L115
- Sofue & Vogler (2001) Sofue, Y. & Vogler, A. 2001, A&A, 370, 53
- Strickland (2001) Strickland, D. K. 2001, in Chemical Enrichment of the ICM and IGM, ASP Conf. Ser., astro-ph/0107116
- Strickland & Stevens (2000) Strickland, D. K. & Stevens, I. R. 2002, MNRAS, 314, 511
- Strickland, Heckman, Weaver, & Dahlem (2000) Strickland, D. K., Heckman, T. M., Weaver, K. A., & Dahlem, M. 2000, AJ, 120, 2965
- Strickland et al. (2002) Strickland, D. K. et al. 2002, ApJ, 568, 689
- Suchkov et al. (1994) Suchkov, A. A., Balsara, D. S., Heckman, T. M., & Leitherer, C. 1994, ApJ, 430, 511
- Sutherland & Dopita (1993) Sutherland, R. S. & Dopita, M. A. 1993, ApJS, 88, 253
- Thornton et al. (1998) Thornton, K., Gaudlitz, M., Janka, H.-Th., & Steinmetz, M. 1998, ApJ, 500, 95
- Tripp et al. (2002) Tripp, T. et al. 2002, ApJ, astro-ph/0204204
- Veilleux & Rupke (2002) Veilleux, S. & Rupke, D. S. 2002, ApJ, 565, L63
- Veilleux et al. (1994) Veilleux, S., Cecil, G., Bland-Hawthorn, J., Tully, R. B., Filippenko, A. V., & Sargent, W. L. W.1994, ApJ, 433, 48
- Weaver et al. (1977) Weaver, R., McCray, R., Castor, J., Shapiro, P., & Moore, R. 1977, ApJ, 218, 377
- Young, Wilson, & Shopbell (2001) Young, A. J., Wilson, A. S., & Shopbell, P. L. S. 2001, ApJ, 556, 6
| Spectral | nH aaPhotoelectric absorption using the formulation of Morrison & McCammon (1983). | kT | Abundance | EIbbModel component normalizations, where the fitted emission “integral” and is the filling factor of volume . | FluxccIntegrated across passband 0.1–6.5 keV. | LuminosityddDistance 17.3 Mpc and isotropic emission. |
|---|---|---|---|---|---|---|
| region | () | (keV) | (relative to solar) | cm-3 | (erg s-1cm-2) | (erg) |
| Nucleus+jet | 0.55 | 0.52 | ||||
| Fe line | 9 | |||||
| BubbleeeThe lack of distinct features in this spectrum prohibits error estimates for this component, and formal results in general for all components. Where reported, ranges on derived parameters span those values that produced nearly identical “reasonable” fits. | 0.3 | 0.8 | 0.16 | 1066 | ||