Optical spectroscopy of radio galaxies in the 7C Redshift Survey
Abstract
We present optical spectroscopy of all 49 radio galaxies in the 7C–I and 7C–II regions of the 7C Redshift Survey (7CRS). The low–frequency (151 MHz) selected 7CRS sample contains all sources with flux-densities Jy in three regions of the sky; 7C–I and 7C–II were chosen to overlap with the 5C6 and 5C7 surveys respectively, and cover a total sky area of 0.013 sr. The sample has been completely identified and spectroscopy of the quasars and broad-lined radio galaxies has been presented in Willott et al. (1998). Only seven of the radio galaxies do not have redshift determinations from the spectroscopy, giving a redshift completeness for the sample of %. The median redshift of the 7CRS is 1.1. We present a composite 7CRS radio galaxy spectrum and investigate the strengths of the 4000 Å breaks in these radio galaxies. We find an anti-correlation between the 4000 Å break strength and emission line luminosity, indicating that departures from old elliptical galaxy continuum shapes are most likely due to non-stellar emission associated with the active nucleus.
keywords:
galaxies: active – galaxies: emission lines – radio continuum: galaxies1 Introduction
Many attempts to deduce the nature of radio-loud AGN have depended heavily on observations of 178 MHz selected 3C sources (e.g. Longair 1999). Studies of a revised 3C (3CRR) sample (Laing, Riley & Longair 1983) have yielded valuable information on the nature and evolution of the population of steep-spectrum radio sources. However the tight correlation between radio luminosity and redshift in any single flux-limited sample such as 3CRR make distinguishing between trends with luminosity and redshift impossible. Most other completely identified samples have been selected at high-frequencies (e.g. the 2.7 GHz 2 Jy sample of Wall & Peacock 1985). High-frequency selected samples contain different types of radio sources, such as a high fraction of flat-spectrum quasars which have their jet axes close to our line-of-sight. It is therefore difficult to compare the properties of the low-frequency 3CRR sample with one selected at a much higher frequency.
The first low-frequency selected sample fainter than 3CRR and completely identified was the 6CE sample (Eales 1985; Rawlings, Eales & Lacy 2001). This sample contains every radio source in 0.1 sr of sky with 151 MHz flux-density Jy. Hence it contains sources with luminosities approximately a factor of 6 lower than the 3CRR sample at any redshift. One example of the power of investigating a range in radio luminosity at a given redshift is the study which revealed that the -band magnitudes of 6CE radio galaxies are systematically fainter than those in the 3CRR sample at (Eales et al. 1997), indicating a relationship between the host galaxy luminosity and radio luminosity in high-redshift radio galaxies (Roche, Eales & Rawlings 1998).
However, the fact that the 6CE sample is only a factor of 6 fainter than 3CRR means that neither a large range in luminosity at a particular redshift, nor a range in redshift at a constant luminosity is achieved with the combination of the 3CRR and 6CE samples. Studies such as deriving the luminosity function of radio sources are therefore difficult with this small flux-density range. What is required is another completely identified low-frequency sample with a flux-density limit fainter than the 6CE sample. To this end we have undertaken to obtain identifications and redshifts for radio sources from three regions of the 7C catalogue – the 7C Redshift Survey. In this paper we present spectroscopic data on the radio galaxies in the 7C–I and 7C–II regions; data on all the quasars and broad-lined radio galaxies (BLRGs) has been presented in Willott et al. (1998). Data on the 7C–III region have been published in Lacy et al. (1999a), Lacy, Bunker & Ridgway (2000) and references therein.
Using the 7CRS we have shown that the correlation between narrow emission line and radio luminosities in radio galaxies and quasars (Rawlings et al. 1989; Baum & Heckman 1989) is real and not due to correlations of these properties with redshift (Willott et al. 1999). The 7CRS has also shown that the relative numbers of quasars and radio galaxies is a strong function of both radio and narrow line luminosity, with very few quasars at low luminosities (Willott et al. 2000). Correlations between radio luminosity, redshift, linear size and spectral index in the 3CRR, 6CE and 7CRS samples were investigated with radio source evolution models to show that all high redshift radio sources in these samples are observed a relatively short time after the jet-triggering event (Blundell, Rawlings & Willott 1999). A new derivation of the radio luminosity function using these samples has been presented by Willott et al. (2001).
In this paper we briefly discuss the selection of the sample (Section 2 – a full description will be given in Blundell et al. in prep.) and present optical spectroscopy of radio galaxies in the 7C–I and 7C–II regions (Section 3). In Section 4 we give notes on individual sources. In Section 5 we discuss the sample redshift distribution and the stellar populations in the low-redshift () radio galaxies. The seven sources without redshifts from optical spectroscopy (most of which have very red optical to near-IR colours) are discussed in Willott, Rawlings & Blundell (2001; hereafter WRB).
2 Sample selection
The seventh Cambridge (7C) survey was carried out with the Cambridge Low Frequency Synthesis Telescope (CLFST; see McGilchrist et al. 1990 for details of the telescope) at a frequency of 151 MHz. The regions 7C–I and 7C–II overlap with fields 5C6 and 5C7, respectively, of the 5C survey (Pearson & Kus 1978). An early attempt to identify these sources was made by Rossitter (1987), but he was largely unsuccessful due to the optical faintness of many of the sources. These fields are centred on and (epoch B1950.0), respectively. The fields lie approximately either side of the galactic plane, so there are few problems of foreground obscuration and reddening of the optical emission from the radio sources.
The completeness limit of the 7C survey in these fields is 0.12 Jy for 7C–I and 0.18 Jy for 7C–II (Blundell et al. in prep.). The 7C Redshift Survey (7CRS) contains every source within these regions with Jy for 7C–I, Jy for 7C–II and Jy for 7C–III. The slight difference between these limits is due to a re-evaluation of the flux-density scales after much of the follow-up observations had been made. The 7C–I region covers 0.0061 sr of sky and contains 37 objects, the 7C–II region covers 0.0069 sr and contains 39 objects. One source (3C 200) is common to both the 3CRR sample and the 7CRS.
The resolution of the CLFST observations of the 7C fields is 70 70 cosec(Dec) arcsec2. In order to determine the structures of the sources, high-resolution observations were made with the Very Large Array (VLA). Full details of the radio observations will be given in Blundell et al. (in prep).
All members of the 7CRS (except the flat-spectrum quasar 5C7.230 and 3C200) have been imaged at -band to provide an identification for spectroscopy and to determine the near-IR morphology and magnitude. Details of these observations and images are given in Willott et al. (2002) where we discuss the relation and its dependence upon radio luminosity. magnitudes for quasars and broad-lined radio galaxies were also given in Willott et al. (1998). For almost all cases a secure -band identification has been found. In cases where imaging gave more than one possible counterpart, long-slit spectroscopy usually revealed the location of the true radio source identification (see Section 4).
To fix the astrometry of the -band images, finding charts from either the APM Catalogue (Irwin et al. 1994), or the HST Guide Star Catalogue, were obtained for each radio source field. For most fields, one or more stars detected on the -band images were also on the finding charts. For cases where three or more stars appear on both the image and the chart, the IRAF GASP package was used to determine the plate solution for the image. For cases where only one or two finding chart stars were detected on the -band image, the plate solution for another image with a good fit on the same observing run was used along with the position of one of the detected stars. In a few cases, no finding chart stars were within the image fields, but for these objects wider field -band images were available and the astrometry could be achieved by first determining the positions of fainter objects on the -band images.
The VLA maps resolved the radio sources typically into core and lobe components. Where a core is clearly identifiable, it is usual to find the optical counterpart within an arcsecond of this position (consistent with the residual error expected from the astrometric process). Where no core is visible, the counterparts are generally found between the two lobes, often approximately equidistant between the two. Where several objects were close to the expected counterpart position, the radio and -band images were overlaid. Subsequent optical spectroscopy of candidates revealed the true identification because of the strong emission lines present in most AGN.
| Name | Optical/Near-IR Position | Telescope + | Date | Exposure | Slit width | Slit PA | |
|---|---|---|---|---|---|---|---|
| (B1950.0) | Detector | time (s) | (arcsec) | (∘) | |||
| 5C6.17 | 02 06 22.08 +34 14 25.2 | ” | 97Jan09 | 3600 | 2.5 | 170 | – |
| 5C6.19 | 02 06 39.11 +33 40 09.8 | ” | 97Jan09 | 1546 | 2.5 | 95 | 0.799 |
| 5C6.24 | 02 07 20.18 +32 35 24.8 | ” | 95Jan29 | 1042 | 2.0 | 98 | 1.073 |
| 5C6.25 | 02 07 26.61 +33 56 38.3 | ” | 95Jan30 | 1254 | 3.1 | 16 | 0.706 |
| 5C6.29 | 02 08 09.00 +32 42 38.2 | ” | 95Jan31 | 600 | 2.7 | 69 | 0.720 |
| 5C6.43 | 02 09 04.70 +33 48 14.3 | ” | 95Jan30 | 1800 | 3.1 | 16 | 0.775 |
| 5C6.62 | 02 10 29.69 +32 54 01.0 | ” | 95Jul28 | 1800 | 3.0 | 33 | – |
| 5C6.63 | 02 10 29.85 +34 04 29.9 | ” | 95Jan31 | 994 | 3.1 | 90 | 0.465 |
| 5C6.75 | 02 11 06.09 +30 12 15.2 | ” | 95Jan29 | 1456 | 3.1 | 145 | 0.775 |
| 5C6.83 | 02 11 11.17 +30 39 49.3 | ” | 97Jan09 | 2700 | 2.5 | 180 | – |
| 5C6.78 | 02 11 17.94 +32 37 06.6 | McD+IGI | 96Feb17 | 3600 | 2.0 | 0 | 0.263 |
| 5C6.201 | 02 16 16.49 +34 05 56.1 | WHT+ISIS | 98Dec21 | 1200 | 2.5 | 132 | 0.595 |
| 5C6.214 | 02 16 38.28 +34 09 25.6 | ” | 95Jan31 | 1800 | 2.2 | 0 | 0.595 |
| 5C6.217 | 02 16 49.62 +33 34 31.5 | ” | 97Jan09 | 1800 | 2.5 | 0 | 1.410 |
| 5C6.233 | 02 17 38.79 +29 38 35.6 | ” | 95Jan30 | 2700 | 4.0 | 350 | 0.560 |
| 5C6.239 | 02 18 10.60 +30 12 04.5 | ” | 95Jan31 | 1412 | 2.2 | 20 | 0.805 |
| 5C6.242 | 02 18 17.50 +31 03 24.8 | ” | 95Jan29 | 4380 | 2.7 | 25 | – |
| 5C6.258 | 02 19 17.29 +33 39 49.1 | ” | 95Jan29 | 1600 | 1.8 | 77 | 0.752 |
| 5C6.267 | 02 20 07.00 +30 08 49.5 | ” | 97Jan09 | 300 | 3.0 | 34 | 0.357 |
| 5C6.279 | 02 20 47.17 +34 01 36.4 | ” | 97Jan09 | 870 | 3.0 | 359 | 0.473 |
| 7C0221+3417 | 02 21 55.60 +34 17 04.1 | ” | 97Jan10 | 1800 | 2.5 | 146 | 0.852 |
| 5C6.292 | 02 23 54.99 +33 51 28.9 | ” | 94Jan09 | 1800 | 2.9 | 131 | 1.241 |
| 5C7.7 | 08 07 23.52 +26 59 44.5 | McD+IGI | 96Feb17 | 1800 | 2.0 | 0 | 0.435 |
| 5C7.8 | 08 07 59.52 +28 22 50.1 | WHT+ISIS | 95Jan31 | 1216 | 2.9 | 37 | 0.673 |
| 5C7.9 | 08 08 18.14 +24 58 32.7 | McD+IGI | 96Mar28 | 1200 | 2.0 | 0 | 0.233 |
| 5C7.10 | 08 08 24.94 +26 27 14.8 | WHT+ISIS | 95Jan29 | 1800 | 3.1 | 51 | 2.185 |
| 5C7.15 | 08 09 17.49 +26 39 17.3 | ” | 95Jan30 | 1800 | 2.0 | 270 | 2.433 |
| 5C7.23 | 08 10 33.38 +29 25 37.2 | ” | 95Jan29 | 1800 | 3.1 | 160 | 1.098 |
| 5C7.25 | 08 10 42.77 +28 00 46.6 | ” | 95Jan30 | 1645 | 2.0 | 278 | 0.671 |
| 5C7.47 | 08 12 38.78 +24 56 13.0 | ” | 00Feb10 | 3600 | 1.5 | 134 | – |
| 5C7.57 | 08 13 29.64 +28 06 50.1 | ” | 97Apr07 | 1800 | 2.5 | 168 | 1.622 |
| 5C7.78 | 08 14 35.21 +29 14 31.1 | ” | 97Apr06 | 700 | 2.5 | 17 | 1.151 |
| 5C7.79 | 08 14 39.24 +25 09 48.5 | ” | 97Apr06 | 1200 | 2.5 | 36 | 0.608 |
| 5C7.82 | 08 14 41.90 +29 31 11.5 | ” | 97Apr06 | 724 | 2.5 | 90 | 0.918 |
| 5C7.106 | 08 15 51.26 +26 33 20.1 | McD+IGI | 96Feb20 | 1200 | 2.0 | 0 | 0.264 |
| 5C7.111 | 08 16 07.39 +26 24 11.1 | WHT+ISIS | 97Jan09 | 1200 | 2.5 | 35 | 0.628 |
| 5C7.125 | 08 16 27.58 +25 28 48.2 | ” | 97Jan09 | 1543 | 2.5 | 119 | 0.801 |
| 5C7.145 | 08 17 21.19 +27 52 45.0 | McD+IGI | 96Feb20 | 2400 | 2.0 | 0 | 0.343 |
| 5C7.170 | 08 18 21.53 +25 28 36.9 | ” | 96Feb21 | 1200 | 2.0 | 0 | 0.268 |
| 5C7.178 | 08 18 45.02 +29 32 19.4 | WHT+ISIS | 97Jan09 | 1800 | 2.5 | 35 | 0.246 |
| 5C7.205 | 08 20 09.19 +24 40 17.1 | ” | 95Jan31 | 900 | 3.4 | 71 | 0.710 |
| 5C7.208 | 08 20 18.74 +25 06 21.4 | ” | 95Jan31 | 3600 | 2.0 | 32 | – |
| 5C7.223 | 08 21 05.57 +26 37 55.8 | ” | 95Jan29 | 1567 | 1.8 | 35 | 2.092 |
| 5C7.242 | 08 22 44.06 +24 50 11.0 | ” | 97Feb07 | 1200 | 2.5 | 60 | 0.992 |
| 5C7.245 | 08 22 55.99 +26 53 48.2 | ” | 95Jan31 | 3000 | 3.0 | 120 | – |
| 5C7.269 | 08 25 39.48 +25 38 26.5 | ” | 95Jan31 | 1200 | 3.4 | 100 | 2.218 |
| 7C0825+2446 | 08 25 45.26 +24 47 22.5 | McD+IGI | 96Feb21 | 1200 | 2.0 | 0 | 0.086 |
| 7C0825+2443 | 08 25 56.62 +24 43 47.0 | ” | 96Feb21 | 2400 | 2.0 | 0 | 0.243 |
| 5C7.271 | 08 26 00.89 +25 04 01.8 | WHT+ISIS | 97Apr07 | 3600 | 2.5 | 105 | 2.224 |
3 Optical Spectroscopy
To attain the maximum scientific output from completely identified radio samples, it is necessary to obtain redshifts for as many sources as possible. The correlation between narrow emission line luminosity and radio luminosity (e.g. Willott et al. 1999) means that radio samples at fainter flux-density limits will also have lower flux emission lines. This makes the task of achieving 100% redshifts more difficult for the 7CRS than, for example, the 3CRR sample. In spite of this, over 90% of the sources in 7C–I and 7C–II have spectroscopic redshifts measured.
3.1 Observations, reduction and analysis
Optical spectroscopy has been attempted for all members of the sample except for 3C 200 (; Spinrad et al. 1985). These observations were made predominantly with the 4.2-m William Herschel Telescope (WHT) on La Palma in the Canary Islands. A few of the brighter sources have optical spectra obtained at the telescope at the McDonald Observatory, operated by the University of Texas at Austin. A full list of the spectroscopic observations of the radio galaxies is given in Table 1. Conditions were photometric for all observations except that of 5C6.292, where clouds affected the transparency.
All the WHT spectra were obtained using the ISIS double-beam spectrograph. This instrument uses a dichroic to separate the red and blue light into different beams which are detected on separate charge-coupled devices (CCDs). At that time, each TEK CCD comprised of pixels which were windowed down in the spatial direction to pixels to reduce the readout times. Two 158 lines mm-1 gratings were used to provide broad spectral coverage from 3000 Å – 5800 Å on the blue arm and 5400 Å – 8400 Å on the red arm. The pixel scale in the dispersion direction was Å pix-1 and the resolution Å. The scale along the spatial direction was 0.358 arcsec pix-1 giving a total slit length on the sky of 143 arcsec. Slit widths ranged from 1 to 4 arcsec, depending upon the seeing and the optical/near-IR spatial extent of the object. Position angles of slits on the sky were set to include several objects if the identification was uncertain or a close companion was to be observed simultaneously. In other cases the slit was usually oriented along the radio axis to search for extended line emission aligned with the radio axis.


The spectra were reduced using standard IRAF procedures as described in Willott et al. (1998). In general, the telescope pointing was very accurate and the object appeared in the expected row ( rows). In some ambiguous cases, other objects along the slit were identified on the -band images and the astrometry of the spectra could be determined. One-dimensional spectra of candidate objects were extracted from the two-dimensional spectra. Two extractions were made for each source: a full-width at half-maximum (FWHM) aperture for a good signal-to-noise ratio (snr) and a full-width at zero-intensity (FWZI) aperture for flux measurements. Atmospheric absorption features have not been corrected for, since the residuals from such processes can often appear as real features. Cosmic rays were identified in the 2-D spectra and edited out of the 1-D spectra. Finally, the red and blue spectra (in the case of ISIS observations) were joined together, averaging over 50 Å where the red and blue sensitivity functions crossed.
The final FWHM-aperture spectra of all radio galaxies which allowed redshift determinations are shown in Figure 1. Six sources (5C6.17, 5C6.62, 5C6.83, 5C6.242, 5C7.208 and 5C7.245) did not show any reliable continuum or emission lines in their spectra. However, the pointing positions of the attempted spectra of these sources are secure, since they have all been identified at -band. In addition, the spectrum of 5C7.47 has weak patchy continuum which does not allow a redshift determination. For these seven objects, we have obtained optical and near-IR imaging in order to constrain their redshifts by fitting model galaxy spectra. We have also obtained some near-IR spectroscopy to search for emission lines. These observations and the resulting redshift constraints are discussed fully in WRB. For all the other radio galaxies, emission and/or absorption lines were identified which allowed a secure redshift determination.
A gaussian fit was made to the lines on the FWHM aperture spectra to determine the line centres and FWHMs. The redshift of each object was determined from a weighted mean of emission and/or absorption line centres. Several of the radio galaxies in the redshift range show only one emission line which we identify as redshifted [OII] Å. Continuum bluewards of the emission line prevents it being Ly. Also, the continuum near the emission line is rising with increasing wavelength and the stellar 4000 Å break is observed, confirming the redshift. These sources are described individually in Section 4.
Emission line fluxes were measured with IRAF on the FWZI spectra, by fitting a linear continuum and integrating the flux above this continuum. The observed equivalent widths were also measured in this way. The main source of error here is in accurately determining the level of the underlying continuum. The errors quoted therefore represent the typical uncertainty in the continuum level. Appendix A contains the emission and absorption line data measured from all the spectra.
4 Notes on individual sources
For radio galaxies which do not have two or more reliable emission or
absorption lines in their optical spectra, we now discuss the evidence
for the redshifts quoted. In all cases unless stated, the -band
magnitudes are consistent within 2 with the derived redshifts
according to the relation for 3CRR, 6CE and 7CRS radio galaxies of
Willott et al. (2002).
5C6.19 has one strong emission line identified as [OII] and a rise in continuum redward of 7200 Å consistent with a
4000 Å break at the same redshift. The Ca H and K absorption
features are also marginally detected in the spectrum at the correct
redshift.
5C6.29 has one strong emission line which we identify as [OII]
. The rise in continuum redward of 7000 Å is
consistent with a 4000 Å break at the same redshift.
5C6.43 has a probable [OII] line and a rise in
continuum redward of 7000 Å consistent with a 4000 Å break at
the same redshift.
5C6.63 shows only weak, marginal emission and absorption lines,
but a strong continuum with a large 4000 Å break at 5800Å.
5C6.75 has one reliable emission line identified as [OII]
. Scattered light from a nearby star has been removed
fairly effectively from the spectrum, however this has led to an
increase in the noise level. There is an increase in continuum
strength redward of the emission line, consistent with its
identification as [OII].
5C6.201 is a large double-lobed radio source with a separation
between the hotspots of 90 arcsec. There is no radio core detected in
our current radio map. There is a galaxy approximately
equidistant between the hot spots which we believe to be the
identification. Although no definite emission or absorption features
are visible in the spectrum of this galaxy, there is probably a 4000
Å break at Å and possibly [OIII] lines in the
noisy sky emission at 8000 Å giving a redshift of . At
this redshift the [OII] is in a region of high noise
due to the dichroic. This object has very weak emission lines as
expected for some low–redshift sources (c.f. 5C6.63) from the
correlation between narrow line and radio luminosities (Willott et
al. 1999). Note that the -magnitude of this galaxy is about 1
magnitude fainter than the mean in the relation, but this is
within the 2 scatter about the relation, so does not rule out
this galaxy hosting the radio source. A close companion galaxy (7
arcsec to the north-west) could potentially be the host of the radio
source. This galaxy has a very similar -magnitude and optical
spectrum and is probably physically associated with the other
galaxy. Therefore we are fairly confident of the redshift of the radio
source. We are planning further radio observations to determine which
of these two galaxies is the actual radio source host and then deeper
spectroscopic observations. The radio source 5C6.214 is only 5
arcminutes from 5C6.201 and has an identical redshift. Thus they are a
pair of powerful radio sources separated by only Mpc
().
5C6.258 shows one strong emission line. We identify this as [OII]
on the basis of the magnitude of 17.8 making this
line unlikely to be Ly at .
5C7.15 has only one definite emission line. On the basis of a
lack of continuum and consequently high lower limit to the equivalent
width of the emission line and its faintness at -band, this line is
identified as Ly at .
5C7.82 has one strong emission line identified as [OII] and a rise in continuum redward of 7700 Å consistent with a
4000 Å break at the same redshift.
5C7.125 has one strong emission line identified as [OII]
and a rise in continuum redward of this line consistent
with a 4000 Å break at the same redshift.
5C7.178 shows many narrow emission lines at , as well
as a couple of stellar absorption features and a prominent 4000 Å break. However, the unusual thing about this object is that it is
several magnitudes fainter than the mean relation and the only
object in the 7C sample which is a serious outlier (Willott et
al. 2002). The strength of high ionisation lines such as [Ne III]
compared to the Balmer lines indicates that the ionisation mechanism
for this source is probably photoionisation by an active nucleus and
not a starburst. The [OII] line strength is abnormally weak compared
to other 7C galaxies at this redshift. These two facts suggests the
radio luminosity of 5C7.178 is unusually high.
5C7.242 has one definite emission line at 7427 Å and a
low-significance line at 3814 Å. These two lines are consistent
with a redshift of . There is little continuum evident in the
spectrum and hence no clear 4000 Å break is seen.
5C7.269 has only one definite emission line in our spectrum. On the basis of a lack of continuum and consequently high lower limit to the equivalent width of the emission line and its faintness at -band, we would expect this line to be identified as Ly at . We note that Eales & Rawlings (1996) presented an optical spectrum of this radio source which shows Ly and Si IV at and a near-infrared spectrum showing a marginal H line at a consistent redshift. Simpson et al. (in prep.) have obtained a deep near-infrared spectrum which confirms the presence of [OII] and [OIII] emission lines at this redshift.
5 Discussion
5.1 Redshift distribution
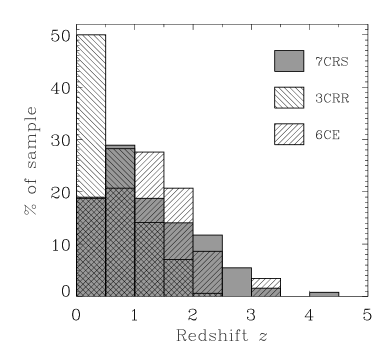
In Fig. 2 we show the redshift distribution of the 7CRS (including regions I, II and III). The distribution peaks at and the median redshift is . The redshift distribution is quite different to that of the 3CRR sample, which peaks at low redshift (median ). The 6CE sample has a redshift distribution very similar to that of the 7CRS and has the same median redshift. A full derivation of the radio luminosity function using these three samples is given in Willott et al. (2001).
5.2 Stellar content of 7CRS galaxies
Most of the low redshift () 7CRS radio galaxy spectra show a continuum dominated by stellar light, with absorption features visible in many cases. Therefore we can use these spectra to investigate the stellar content of the radio galaxies and in particular whether they show evidence for recent starburst activity. The snr of individual spectra do not permit detailed fitting by stellar population models. Instead, we investigate the size of the Å break in each galaxy to estimate the amount of recent star-formation or non-stellar UV component. In addition we can combine the radio galaxy spectra to obtain a high snr composite and use this to compare with stellar population models.

The Å break feature is a sensitive indicator of the age of the dominant stellar population, since a large break indicates few massive, young stars in the galaxy (Bruzual 1983). The size of the Å break was measured for all the radio galaxies at in 7C–I and 7C–II. We used slightly different wavelength bins compared to the definition of Bruzual in order to avoid emission line contamination and to enable a consistent comparison with the results of Tadhunter et al. (2002). We define . Errors were estimated by adding in quadrature the standard errors on the fluxes in each bin. The resulting values of are given in Table A1.

In Fig. 3 we plot against narrow [OII] emission line luminosity and redshift for all the radio galaxies where could be reliably measured (error ). On the right-hand y-axis we show how corresponds to the ages of instantaneous burst, single population Bruzual & Charlot (2001) models. The range of for the 7CRS galaxies corresponds to ages of Gyr for a single stellar population. There is marginal evidence for anti-correlations between both and in the 7CRS, but neither of these correlations are statistically significant at the 2 level. Given that within a single flux-limited sample radio luminosity and redshift are tightly correlated and is correlated with radio luminosity, there is also an apparent correlation between and . In order to investigate if is redshift or emission line luminosity dependent, we have included data from two brighter samples of low-redshift radio galaxies. Tadhunter et al. (2002) measures for radio galaxies with from the 2 Jy steep-spectrum radio galaxy sample (Tadhunter et al. 1998) and Wills et al. (2002) measure for 3CR galaxies. We exclude the broad-line radio galaxies from these samples, since they have systematically lower values of than the narrow line galaxies, indicating the presence of a strong non-stellar UV component. With the inclusion of the 2 Jy and 3CR radio galaxies, there are clearly anti-correlations between and and and (both significant at the 3 level). The correlation with redshift is due largely to the fact that the 3CR galaxies all have large 4000 Å breaks. At low redshifts and/or [OII] luminosities, most galaxies have large breaks () consistent with those found for inactive ellipticals at similar redshifts (Hamilton 1985). At higher luminosities, there is a greater spread in with many sources having smaller breaks. We will return to the interpretation of these results after examining the properties of the composite radio galaxy spectrum.
Composite optical spectra of objects spanning a wide range of redshifts have limited applications, since different objects will be contributing at different parts of the rest-frame spectrum. Since the high redshift galaxies in the 7CRS have only weak continua in their optical spectra, we choose to include only sources in the redshift range . To construct the composite spectrum the optical spectra of all the radio galaxies in this redshift range in the 7C–I and 7C–II regions (totalling 25 galaxies) were trimmed to exclude noisy regions at the ends and then shifted to the rest-frame using the redshifts in Table 1. All spectra were then normalised by the integrated flux over the range Å. This region was chosen because it is in the rest-frame spectra of all the included objects, it is devoid of bright emission lines and also lies above the Å break. The spectra were then rebinned, merged and smoothed with a 10 Å boxcar filter to form the composite which is shown in Fig. 4. Note that not all objects contribute across this whole wavelength range and only the region Å includes all 25 galaxies. However, the composite is reasonably complete at Å with 17 galaxy spectra going as low as Å and 16 as high as Å. The median radio and emission line luminosities of the radio galaxies comprising the composite are / WHz-1sr and / W
The composite 7CRS radio galaxy spectrum shows strong narrow emission lines of [OII] and [OIII]. The relative strengths of these lines in the composite is not indicative of the ratios of these lines in 7CRS radio galaxies, due to the facts that only the lower redshift (and hence lower luminosity) sources have [OIII] in their optical spectra and there is a strong correlation between the narrow line and radio luminosities (Willott et al. 1999). However, because the contributing spectra were normalised by their continua, the shape of the continuum and the strength of the absorption lines of the composite are not strongly affected by this problem (and certainly not in the region which contains all the galaxy spectra). The spectrum in Fig. 4 has .
We have compared the composite galaxy spectrum to a set of Bruzual & Charlot (2002) instantaneous burst stellar population models with various ages ranging from 0.01 to 20 Gyr. All the models have a Salpeter IMF, solar metallicity and are normalized over the range Å. A least-squares fit of the models to the composite spectrum (wavelength range 3000 - 5000 Å only, with the emission lines subtracted and rebinned to the model resolution) gives a best fit for an age of 2.0 Gyr . This model fits the composite galaxy spectrum remarkably well with reduced – this model is also shown in Fig. 4. This is particularly surprising given that the composite spectrum is a combination of 25 galaxies with different star-formation histories and quite a range of . The composite radio galaxy spectrum can be equally well-fit by a two population model of a dominant old (10 Gyr) population and a young (0.3 Gyr) component with only 1.5% of the total stellar mass (Fig. 4). A model comprising an old (10 Gyr) stellar population and a power law can also be fit to the composite, resulting in a slightly poorer fit (reduced ). Models involving significant young components with ages Gyr do not fit the composite well showing that most of the radio galaxies have not undergone recent starbursts involving 0.5% or more of the stellar mass (unless these starbursts are obscured by dust). This is consistent with the fact that the colours of most 7CRS radio galaxies are as expected for evolved galaxies which formed at high redshifts (WRB).
From the 4000 Å break analysis and the composite spectrum, we find that the 7CRS radio galaxies have a range of continuum shapes which can be accounted for by a dominant old stellar population and a blue/UV component of varying strength. This blue component could be due either to recent star-formation or non-stellar emission associated with the active nucleus. At higher redshifts and luminosities, it is well-known that there is a strong blue component, often aligned with the radio jet axis (McCarthy et al. 1987). No single mechanism for this alignment effect fits the data for all sources and scattered quasar light, nebular continuum and jet-induced star-formation all play a role (Best et al. 1998). Observations of the 2 Jy sample at show that the UV excesses in these relatively radio-luminous galaxies are due to a mixture of non-stellar emission such as nebular continuum and direct AGN light and young stellar populations (Tadhunter et al. 2002). The anti-correlation between and for our combined sample shows that the strength of the blue component decreases with emission-line luminosity. This therefore suggests that the strength of the blue component is more closely linked to the active nucleus than to recent star-formation. WRB found a similar correlation at higher redshifts such that the reddest radio galaxies at in 7C–I and 7C–II also had the weakest emission lines. Lacy et al. (1999b) showed that for 7CRS radio galaxies there is a measurable alignment effect, albeit weaker than that in more luminous radio galaxies. Therefore, we conclude that non-stellar emission is likely to be a more common cause for the blue excess in some 7CRS radio galaxies than recent star-formation.
6 Summary
We have presented the results of optical spectroscopy of the 7C–I and 7C–II regions of the 7C Redshift Survey. All but 7 of the 76 radio sources in the sample have spectroscopic redshifts. These seven objects have redshifts constrained by optical/near-IR imaging and near-IR spectroscopy (WRB). The high redshift completeness of this sample makes it ideal for combining with the brighter, low-frequency selected 3CRR and 6CE samples to study the nature and evolution of radio sources and their host galaxies. At 7CRS radio galaxies typically have optical continua dominated by evolved stellar populations. The UV excesses in some radio galaxies are most likely due to to non-stellar AGN-related emission, rather than recent star-formation. Early results using these data can be found in Blundell, Rawlings & Willott (1999) and Willott et al. (1999,2000,2001). Summary tables of basic data on the 7C–I and 7C–II samples can be found in Willott et al. (2002).
Acknowledgements
We would like to thank Steve Eales, Julia Riley and David Rossitter for important contributions to the 7C Redshift Survey. Thanks to Clive Tadhunter and Karen Wills for providing us with data ahead of publication and to Margrethe Wold for help with the McDonald Telescope observations. We thank the referee Dr E.M. Sadler for a useful referees report. Thanks to the staff of the ING for their excellent support during the spectroscopic observations. The William Herschel Telescope is operated on the island of La Palma by the Isaac Newton Group in the Spanish Observatorio del Roque de los Muchachos of the Instituto de Astrofisica de Canarias. Thanks to the staff of McDonald Observatory for their support of part of these observations. This research has made use of the NASA/IPAC Extra-galactic Database, which is operated by the Jet Propulsion Laboratory, Caltech, under contract with the National Aeronautics and Space Administration. CJW thanks PPARC for support. GJH acknowledges support from the Texas Advanced Research Program under Grant No. 009658-0710-1999.
References
- [1] Baum S.A., Heckman T.M., 1989, ApJ, 336, 702
- [2] Best P.N., Longair M.S., Röttgering H.J.A., 1998, MNRAS, 295, 549
- [3] Blundell K.M., Rawlings S., Willott C.J., 1999, AJ, 117, 677
- [4] Bruzual G., 1983, ApJ, 273, 105
- [5] Bruzual G., Charlot S., 2002, in prep.
- [6] Eales S.A., 1985, MNRAS, 217, 179
- [7] Eales S.A., Rawlings S., 1996, ApJ, 460, 68
- [8] Eales S.A., Rawlings S., Law-Green J.D.B., Cotter G., Lacy M., 1997, MNRAS, 291, 593
- [9] Hamilton D., 1985, ApJ, 297, 371
- [10] Irwin M.J., Maddox S.J., McMahon R.G., 1994, Spectrum: Newsletter of the Royal Observatories, 2, 14
- [11] Laing R.A., Riley J.M., Longair M.S., 1983, MNRAS, 204, 151
- [12] Lacy M., Rawlings S., Hill G.J., Bunker A.J., Ridgway S.E., Stern D., 1999a, MNRAS, 308, 1096
- [13] Lacy M., Ridgway S.E., Wold M., Lilje P.B., Rawlings S., 1999b, MNRAS, 307, 420
- [14] Lacy M., Bunker A.J., Ridgway S.E., 2000, AJ, 120, 68
- [15] Longair M.S., 1999, in ”The Hy-Redshift Universe: Galaxy Formation and Evolution at High Redshift”, eds. A.J. Bunker and W.J.M. van Breugel, ASP Conference Proceedings Vol. 193, 11
- [16] McCarthy P.J., van Breugel W., Spinrad H., Djorgovski S., 1987, ApJ, 321, L29
- [17] McGilchrist M.M., Baldwin J.E., Riley J.M., Titterington D.J., Waldram E.M., Warner P.J., 1990, MNRAS, 246, 110
- [18] Pearson T.J., Kus A.J., 1978, MNRAS, 182, 273
- [19] Rawlings S., Saunders R., Eales S.A., Mackay C.D., 1989, MNRAS, 240, 701
- [20] Rawlings S., Eales S., Lacy M., 2001, MNRAS, 322, 523
- [21] Roche N., Eales S.A., Rawlings S., 1998, MNRAS, 297, 405
- [22] Rossitter D., 1987, PhD thesis, University of Cambridge
- [23] Spinrad H., Marr J., Aguilar L., Djorgovski S., 1985, PASP, 97, 932
- [24] Tadhunter C.N., Morganti R., Robinson A., Dickson R., Villar-Martin M., Fosbury R.A.E., 1998, MNRAS, 298, 1035
- [25] Tadhunter C.N., Dickson R., Morganti R., Robinson T.G., Wills K.A., Villar-Martin M., Hughes M., 2002, MNRAS, 330, 977
- [26] Wall J.V., Peacock J.A., 1985, MNRAS, 216, 173
- [27] Willott C.J., Rawlings S., Blundell K.M., Lacy M., 1998, MNRAS, 300, 625
- [28] Willott C.J., Rawlings S., Blundell K.M., Lacy M., 1999, MNRAS, 309, 1017
- [29] Willott C.J., Rawlings S., Blundell K.M., Lacy M., 2000, MNRAS, 316, 449
- [30] Willott C.J., Rawlings S., Blundell K.M., Lacy M., Eales S.A., 2001, MNRAS, 322, 536
- [31] Willott C.J., Rawlings S., Blundell K.M., 2001, MNRAS, 324, 1 (WRB)
- [32] Willott C.J., Rawlings S., Jarvis M.J., Blundell K.M., 2002, MNRAS, submitted
- [33] Wills K.A., Tadhunter C.N., Robinson T.G., Morganti R., 2002, MNRAS, submitted
Appendix A Emission and absorption line data
In this appendix we give the emission and absorption line measurements from the optical spectra as described in Section 3.
| Name | line | FWHM | flux | snr | Wλ | |||
| (Å) | (Å) | (Å) | (W m-2) | (Å) | ||||
| 5C6.19 | [OII] | 3727 | 6706 1 | 21 1 | 1.7e-19 | 3.2 | 78 18 | |
| CaIIa | 3934 | 7088 7 | –– | — | 2.0 | –– | ||
| CaIIa | 3969 | 7128 4 | –– | — | 2.2 | –– | ||
| 5C6.24 | CIII] | 1909 | 3957 2 | 37 4 | 1.4e-19 | 1.1 | 99 30 | |
| CII] | 2326 | 4822 1 | 22 1 | 1.3e-19 | 6 | 142 24 | ||
| [OII] | 3727 | 7721 1 | 26 3 | 5.2e-19 | 8 | 146 20 | ||
| [NeIII] | 3869 | 8012 1 | 29 4 | 8.5e-20 | 3.2 | 65 18 | ||
| 5C6.25 | [NeIV] | 2424 | 4139 1 | 20 2 | 5.4e-20 | 2.8 | 25 9 | |
| [NeV] | 3426 | 5850 1 | 19 3 | 8.5e-20 | 2.5 | 51 13 | ||
| [OII] | 3727 | 6362 1 | 20 1 | 8.0e-19 | 12 | 113 15 | ||
| [NeIII] | 3869 | 6600 1 | 19 3 | 1.8e-19 | 3.6 | 42 9 | ||
| H | 4340 | 7407 1 | 37 11 | 1.5e-19 | 2.8 | 32 8 | ||
| 5C6.29 | [OII] | 3727 | 6409 2 | 35 4 | 3.8e-19 | 3.0 | 39 11 | |
| 5C6.43 | [OII] | 3727 | 6635 2 | 29 3 | 3.3e-20 | 1.3 | 52 8 | |
| 5C6.63 | [OII] | 3727 | 5451 1 | 26 2 | 8.0e-20 | 2.2 | 21 8 | |
| CaIIa | 3934 | 5798 4 | –– | — | 2.4 | –– | ||
| CaIIa | 3969 | 5815 2 | –– | — | 2.0 | –– | ||
| [OIII] | 5007 | 7347 1 | 18 1 | 1.4e-19 | 1.6 | 6 2 | ||
| 5C6.75 | [OII] | 3727 | 6617 1 | 26 1 | 1.9e-19 | 2.5 | –– | |
| 5C6.78 | [OII] | 3727 | 4711 2 | 32 4 | 8.1e-19 | 8 | 38 10 | |
| [NeIII] | 3869 | 4881 1 | 26 2 | 2.5e-19 | 3.3 | 13 3 | ||
| H | 4861 | 6139 1 | 16 1 | 3.0e-19 | 3.3 | 5 1 | ||
| [OIII] | 4959 | 6261 1 | 16 2 | 1.4e-18 | 9 | 27 3 | ||
| [OIII] | 5007 | 6321 1 | 13 1 | 3.1e-18 | 19 | 64 10 | ||
| 5C6.201 | CaIIa | 3969 | 6360 5 | –– | — | 2.7 | –– | |
| [OIII] | 4959 | 7939 2 | 27 3 | 1.0e-19 | 1.1 | 25 10 | ||
| [OIII] | 5007 | 7987 3 | 26 4 | 1.3e-19 | 1.5 | 30 10 | ||
| 5C6.214 | [OII] | 3727 | 5944 1 | 17 1 | 8.3e-20 | 2.3 | 39 6 | |
| CaIIa | 3934 | 6277 2 | –– | — | 1.3 | –– | ||
| CaIIa | 3969 | 6334 3 | –– | — | 2.7 | –– | ||
| H | 4861 | 7760 3 | –– | — | 2.2 | –– | ||
| [OIII] | 4959 | 7914 1 | 19 2 | 1.4e-19 | 1.9 | 19 3 | ||
| [OIII] | 5007 | 7982 2 | 25 2 | 2.1e-19 | 2.7 | 30 5 | ||
| 5C6.217 | HeII | 1640 | 3960 1 | 15 1 | 1.7e-19 | 2.4 | 74 30 | |
| CIII] | 1909 | 4599 2 | 19 1 | 6.5e-20 | 2.0 | 41 7 | ||
| [NeIV] | 2424 | 5831 1 | 21 1 | 7.6e-20 | 2.8 | 52 14 | ||
| [NeV] | 3346 | 8060 4 | 41 1 | 1.1e-19 | 1.6 | 72 14 | ||
| [NeV] | 3426 | 8254 1 | 28 2 | 1.5e-19 | 3.2 | 97 24 | ||
| 5C6.233 | [OII] | 3727 | 5816 1 | 25 2 | 1.5e-19 | 5 | 86 13 | |
| [NeIII] | 3869 | 6029 1 | 24 1 | 8.5e-20 | 3.1 | 39 7 | ||
| 5C6.239 | CII] | 2326 | 4217 1 | 33 2 | 8.9e-19 | 1.3 | –– | |
| [NeIV] | 2424 | 4369 2 | 28 1 | 9.1e-19 | 3.2 | –– | ||
| MgII | 2798 | 5048 1 | 26 3 | 9.8e-20 | 1.8 | –– | ||
| [NeV] | 3346 | 6041 1 | 41 4 | 7.1e-20 | 2.0 | 70 22 | ||
| [NeV] | 3426 | 6184 1 | 39 2 | 1.4e-19 | 3.3 | 64 12 | ||
| [OII] | 3727 | 6728 1 | 21 1 | 4.0e-19 | 18 | 121 11 | ||
| [NeIII] | 3869 | 6985 1 | 32 3 | 1.1e-19 | 5 | 95 30 | ||
| 5C6.258 | [OII] | 3727 | 6528 1 | 21 1 | 1.3e-19 | 6 | –– | |
| name | line | FWHM | flux | snr | Wλ | |||
| (Å) | (Å) | (Å) | (W m-2) | (Å) | ||||
| 5C6.267 | [OII] | 3727 | 5053 2 | 28 2 | 1.2e-18 | 3.1 | 49 7 | |
| CaIIa | 3934 | 5331 1 | –– | — | 2.2 | –– | ||
| CaIIa | 3969 | 5370 3 | –– | — | 1.4 | –– | ||
| Ga | 4304 | 5832 4 | –– | — | 2.1 | –– | ||
| Ha | 4861 | 6607 1 | –– | — | 3.1 | –– | ||
| NaIa | 5893 | 7983 1 | –– | — | 3.5 | –– | ||
| 5C6.279 | [NeV] | 3426 | 5067 8 | 60 15 | 1.5e-19 | 3.1 | 89 11 | |
| [OII] | 3727 | 5504 1 | 22 2 | 5.9e-19 | 4 | –– | ||
| H | 4861 | 7151 1 | 21 1 | 9.7e-20 | 2.5 | 10 3 | ||
| [OIII] | 4959 | 7300 1 | 20 1 | 3.2e-19 | 9 | 19 1 | ||
| [OIII] | 5007 | 7371 1 | 19 1 | 7.1e-19 | 21 | 44 5 | ||
| 7C0221+3417 | CII] | 2326 | 4305 2 | 13 1 | 3.1e-20 | 1.5 | –– | |
| [OII] | 3727 | 6900 1 | 23 1 | 1.2e-19 | 4 | –– | ||
| [NeIII] | 3869 | 7165 1 | 29 1 | 3.7e-20 | 1.2 | –– | ||
| 5C6.292 | HeII | 1640 | 3674 2 | 15 2 | 1.3e-19 | 2.6 | –– | |
| CIII] | 1909 | 4275 2 | 34 2 | 3.2e-19 | 5 | –– | ||
| [OII] | 3727 | 8379 2 | 29 1 | 9.0e-19 | 8 | –– | ||
| 5C7.7 | [OII] | 3727 | 5348 9 | 32 2 | 2.0e-19 | 2.3 | 15 3 | |
| CaIIa | 3934 | 5645 1 | –– | — | 2.6 | –– | ||
| CaIIa | 3969 | 5699 1 | –– | — | 2.8 | –– | ||
| Ga | 4304 | 6178 1 | –– | — | 1.0 | –– | ||
| H | 4861 | 6989 5 | 38 8 | 1.1e-19 | 0.8 | 7 2 | ||
| [OIII] | 4959 | 7114 3 | 48 2 | 3.3e-19 | 2.7 | 18 3 | ||
| [OIII] | 5007 | 7183 2 | 32 2 | 6.8e-19 | 6 | 33 6 | ||
| MgIa | 5175 | 7429 2 | –– | — | 1.3 | –– | ||
| 5C7.8 | [OII] | 3727 | 6236 1 | 19 1 | 3.8e-19 | 2.4 | 83 13 | |
| CaIIa | 3934 | 6585 2 | –– | — | 1.4 | –– | ||
| CaIIa | 3969 | 6646 4 | –– | — | 1.3 | –– | ||
| 5C7.9 | CaIIa | 3934 | 4852 2 | –– | — | 1.4 | –– | |
| Ga | 4304 | 5308 2 | –– | — | 5 | –– | ||
| [OIII] | 4959 | 6116 1 | 18 1 | 5.2e-18 | 8 | 27 3 | ||
| [OIII] | 5007 | 6174 1 | 16 1 | 1.3e-17 | 24 | 62 9 | ||
| 5C7.10 | Ly | 1216 | 3874 1 | 28 1 | 2.7e-18 | 12 | –– | |
| CIV | 1549 | 4935 1 | 41 3 | 2.0e-19 | 2.9 | –– | ||
| HeII | 1640 | 5206 2 | 12 1 | 1.9e-19 | 3.1 | –– | ||
| CIII] | 1909 | 6049 1 | 25 2 | 1.5e-19 | 4 | –– | ||
| 5C7.15 | Ly | 1216 | 4175 1 | 24 1 | 4.2e-19 | 6 | –– | |
| 5C7.23 | CIII] | 1909 | 3988 1 | 19 4 | 4.7e-20 | 0.9 | 72 13 | |
| MgII | 2798 | 5857 4 | 40 1 | 5.0e-20 | 2.5 | –– | ||
| [OII] | 3727 | 7820 2 | 18 1 | 2.0e-19 | 4 | –– | ||
| 5C7.25 | [OII] | 3727 | 6225 3 | 27 2 | 2.4e-19 | 6 | 104 30 | |
| CaIIa | 3934 | 6564 1 | –– | — | 2.1 | –– | ||
| CaIIa | 3969 | 6624 1 | –– | — | 2.0 | –– | ||
| Ga | 4304 | 7189 2 | –– | — | 3.1 | –– | ||
| 5C7.57 | CIV | 1549 | 4067 2 | 38 2 | 1.7e-19 | 4 | –– | |
| CIII] | 1909 | 5003 2 | 25 1 | 6.1e-20 | 2.8 | –– | ||
| MgII | 2798 | 7356 2 | 35 2 | 4.2e-20 | 2.6 | –– | ||
| 5C7.78 | CIII] | 1909 | 4107 3 | 33 7 | 8.0e-20 | 1.3 | –– | |
| [NeV] | 3426 | 7340 1 | 18 1 | 5.9e-20 | 1.0 | –– | ||
| [OII] | 3727 | 8032 2 | 38 3 | 3.7e-19 | 5 | –– | ||
| [NeIII] | 3869 | 8325 3 | 29 4 | 3.1e-19 | 4 | –– | ||
| 5C7.79 | [OII] | 3727 | 5994 1 | 20 5 | 8.9e-20 | 3.4 | 68 19 | |
| CaIIa | 3934 | 6315 1 | –– | — | 2.6 | –– | ||
| CaIIa | 3969 | 6379 1 | –– | — | 1.8 | –– | ||
| Ga | 4304 | 6921 5 | –– | — | 2.5 | –– | ||
| 5C7.82 | [OII] | 3727 | 7147 1 | 32 5 | 1.5e-19 | 3.5 | –– | |
| name | line | FWHM | flux | snr | Wλ | |||
| (Å) | (Å) | (Å) | (W m-2) | (Å) | ||||
| 5C7.106 | CaIIa | 3934 | 4975 1 | –– | — | 5 | –– | |
| CaIIa | 3969 | 5012 1 | –– | — | 1.1 | –– | ||
| Ga | 4304 | 5439 1 | –– | — | 1.4 | –– | ||
| MgIa | 5175 | 6541 1 | –– | — | 2.7 | –– | ||
| 5C7.111 | [OII] | 3727 | 6068 1 | 17 1 | 2.4e-19 | 7 | 86 14 | |
| [OIII] | 4959 | 8070 1 | 16 1 | 1.7e-19 | 6 | 20 3 | ||
| [OIII] | 5007 | 8149 1 | 19 1 | 5.0e-19 | 11 | 58 6 | ||
| 5C7.125 | [OII] | 3727 | 6715 1 | 16 1 | 1.2e-19 | 6 | 151 35 | |
| 5C7.145 | CaIIa | 3934 | 5283 2 | –– | — | 2.6 | –– | |
| CaIIa | 3969 | 5329 1 | –– | — | 2.4 | –– | ||
| Ga | 4304 | 5780 1 | –– | — | 1.7 | –– | ||
| Ha | 4861 | 6533 2 | –– | — | 2.3 | –– | ||
| MgIa | 5175 | 6949 4 | –– | — | 3.3 | –– | ||
| NaIa | 5893 | 7913 1 | –– | — | 3.1 | –– | ||
| 5C7.170 | CaIIa | 3934 | 4987 3 | –– | — | 2.7 | –– | |
| CaIIa | 3969 | 5030 1 | –– | — | 2.7 | –– | ||
| Ga | 4304 | 5460 2 | –– | — | 3.2 | –– | ||
| MgIa | 5175 | 6565 2 | –– | — | 3.5 | –– | ||
| NaIa | 5893 | 7477 1 | –– | — | 3.0 | –– | ||
| 5C7.178 | [OII] | 3727 | 4642 1 | 14 1 | 1.0e-19 | 4 | 18 2 | |
| [NeIII] | 3869 | 4805 1 | 20 2 | 1.2e-19 | 2.5 | 23 3 | ||
| CaIIa | 3934 | 4898 1 | –– | — | 1.3 | –– | ||
| CaIIa | 3969 | 4945 1 | –– | — | 3.0 | –– | ||
| [OIII] | 4959 | 6186 3 | 25 1 | 1.9e-20 | 1.4 | 5 2 | ||
| [OIII] | 5007 | 6236 1 | 22 5 | 2.5e-20 | 1.7 | 7 2 | ||
| NaIa | 5893 | 7341 1 | –– | — | 2.4 | –– | ||
| H | 6563 | 8175 1 | 14 1 | 2.5e-19 | 10 | 37 4 | ||
| 5C7.205 | [OII] | 3727 | 6375 2 | 24 3 | 5.8e-19 | 10 | 157 44 | |
| [NeIII] | 3869 | 6614 2 | 21 4 | 2.4e-19 | 3.4 | –– | ||
| H | 4340 | 7429 3 | 30 1 | 2.3e-19 | 3.4 | 81 30 | ||
| 5C7.223 | Ly | 1216 | 3760 3 | 26 2 | 1.7e-18 | 16 | –– | |
| CIV | 1549 | 4789 1 | 15 3 | 2.6e-20 | 2.8 | –– | ||
| HeII | 1640 | 5066 3 | 27 1 | 7.4e-20 | 2.9 | –– | ||
| 5C7.242 | CIII] | 1909 | 3814 1 | 8 1 | 3.2e-20 | 1.2 | –– | |
| [OII] | 3727 | 7427 1 | 23 1 | 9.0e-20 | 3.4 | –– | ||
| 5C7.269 | Ly | 1216 | 3909 1 | 21 3 | 9.4e-19 | 9.2 | –– | |
| 7C0825+2446 | CaIIa | 3934 | 4272 1 | –– | — | 2.7 | –– | |
| CaIIa | 3969 | 4314 2 | –– | — | 2.8 | –– | ||
| Ga | 4304 | 4667 1 | –– | — | 3.8 | –– | ||
| Ha | 4861 | 5283 1 | –– | — | 3.2 | –– | ||
| MgIa | 5175 | 5622 1 | –– | — | 5 | –– | ||
| NaIa | 5893 | 6399 1 | –– | — | 8 | –– | ||
| 7C0825+2443 | [OII] | 3727 | 4628 2 | 30 2 | 9.9e-19 | 2.1 | 42 11 | |
| CaIIa | 3934 | 4893 1 | –– | — | 5 | –– | ||
| CaIIa | 3969 | 4931 1 | –– | — | 4 | –– | ||
| Ga | 4304 | 5350 2 | –– | — | 1.9 | –– | ||
| MgIa | 5175 | 6433 2 | –– | — | 4 | –– | ||
| NaIa | 5893 | 7318 1 | –– | — | 2.7 | –– | ||
| 5C7.271 | Ly | 1216 | 3910 2 | 49 2 | 9.6e-20 | 3.8 | –– | |
| CIV | 1549 | 4981 3 | 28 2 | 3.2e-20 | 3.4 | –– | ||
| HeII | 1640 | 5305 1 | 27 5 | 3.2e-20 | 2.4 | –– | ||
| CII] | 2326 | 7498 4 | 47 1 | 3.5e-20 | 2.7 | –– | ||
| [NeIV] | 2424 | 7810 1 | 16 1 | 2.1e-20 | 2.0 | –– |